“The old adage says, iron sharpens iron. So we’re looking for somebody that brings something to the table that’s going to make all of us better.”
Guiding the training for over 20 teams at Wofford College, Director of Strength and Conditioning Keith Swift has a lot to juggle with only one other full-time career staff member and a pair of paid interns. Joining host Justin Ochoa for a new episode of Rapid Fire, Swift discusses how he makes that work through a combination of “all hands on-deck” moments and a willingness to empower his interns to take full ownership of their coaching roles.
“I don’t micromanage,” Swift says. “Of course I’m in the know of everything going on, but I let people be who they are as far as the staff.”
While the annual turnover of those internships creates continuity challenges, Swift describes how he tries to turn that problem into an opportunity through the hiring process and his efforts to mentor those younger coaches looking to develop skill sets in the field.
“We pride ourselves on good chemistry as far as continuity with our staff. I feel like good camaraderie bleeds over to all of us getting better as coaches and then subsequently our sport teams are more successful,” Swift says—and, the starting point is locating those young coaches most ready to hit the ground running. “You have to be able to take the concepts you learned (in undergrad study) and actually apply them. Every scenario is not going to be cookie-cutter…you gotta be resourceful.”
We pride ourselves on good chemistry as far as continuity with our staff. I feel like good camaraderie bleeds over to all of us getting better as coaches and then subsequently our sport teams are more successful, says @CoachSwift93. Share on XRapid Fire Episode 7. Watch the full episode with Coach Keith Swift and Coach Justin Ochoa.
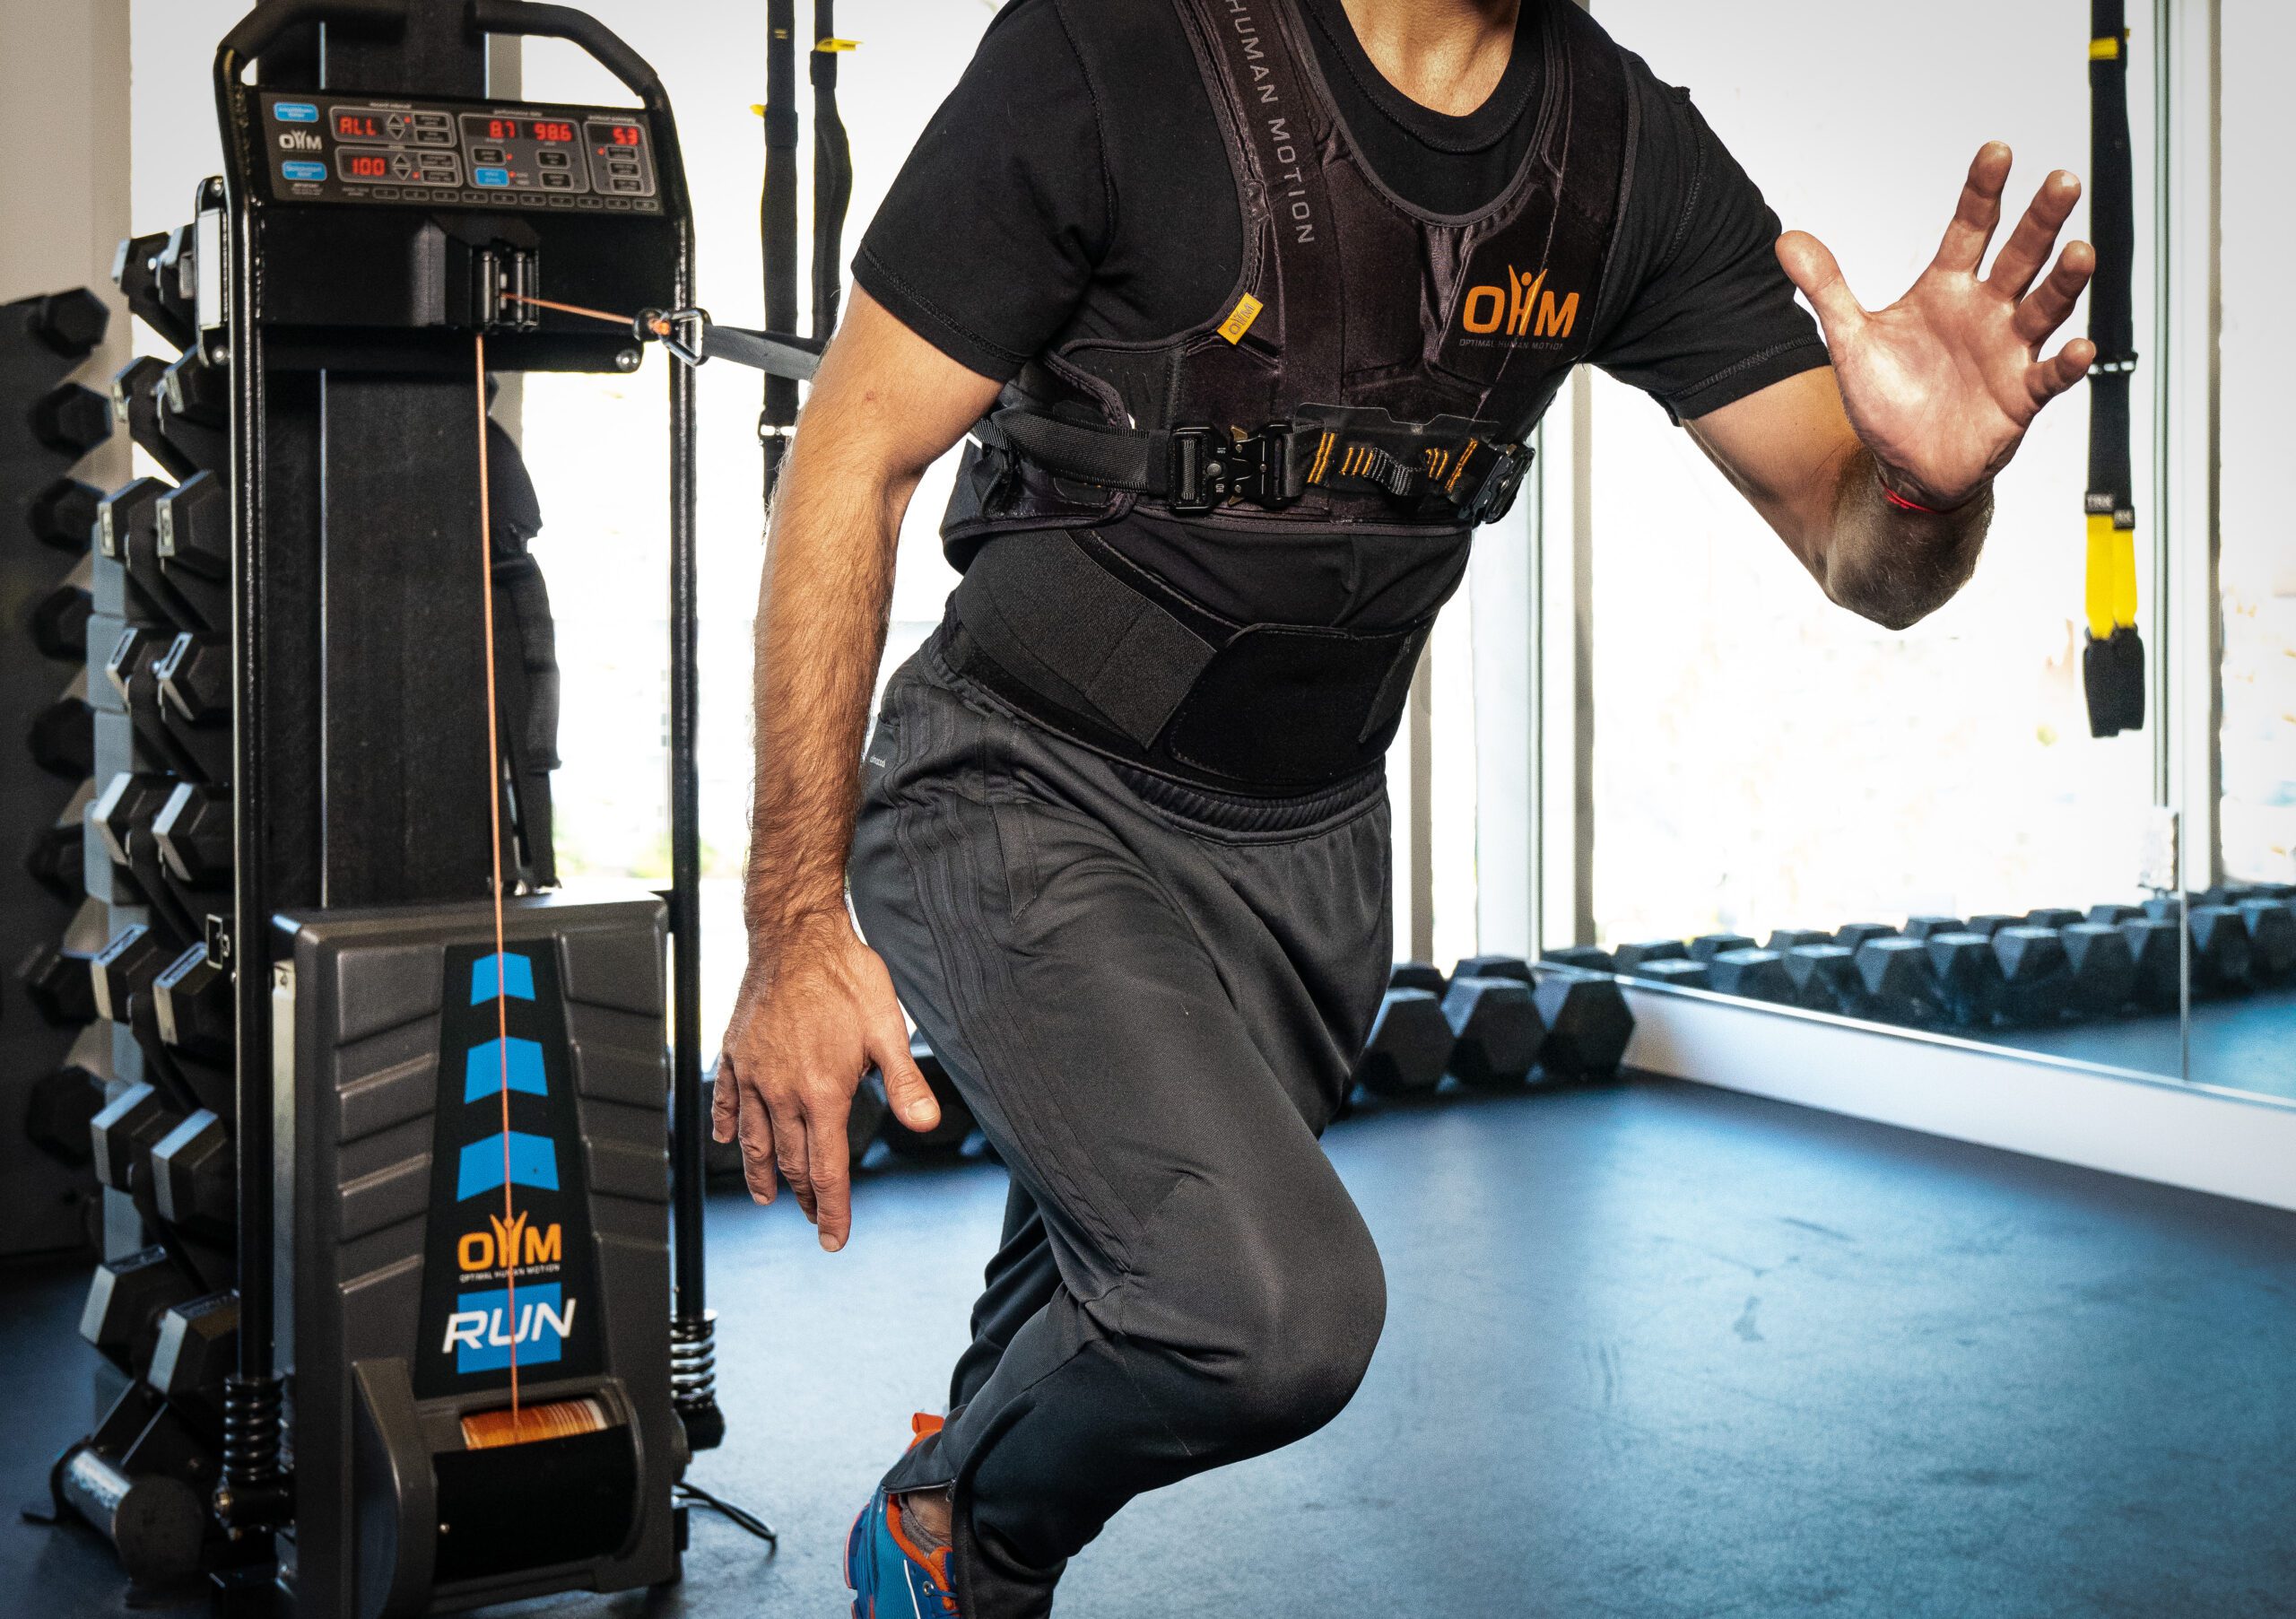
In addition to talking about time and staff management strategies, Swift also elaborates on what new tools and techniques he considers to be his most impactful recent investments. Among those, he singles out how Wofford has upgraded their program’s velocity-based training efforts with Vitruve.
“Hands down, (the best investment we’ve made) has to be Vitruve, velocity-based training devices,” Swift says. “If the athletes are fatigued, didn’t sleep well, stressed-out, didn’t eat…that 80% that day ain’t 80%, it’s more like 75%. And we can adjust that and train them and meet the kids where they are.”
If the athletes are fatigued, didn’t sleep well, stressed-out, didn’t eat…that 80% that day ain’t 80%, it’s more like 75%. And we can adjust that and train them and meet the kids where they are, says @ CoachSwift93. Share on XRapid Fire Excerpt. Coach Swift on integrating Vitruve velocity-tracking tools into their weight room.
Since you’re here…
…we have a small favor to ask. More people are reading SimpliFaster than ever, and each week we bring you compelling content from coaches, sport scientists, and physiotherapists who are devoted to building better athletes. Please take a moment to share the articles on social media, engage the authors with questions and comments below, and link to articles when appropriate if you have a blog or participate on forums of related topics. — SF