Charlie Francis’s 95% Speed Threshold: What Does it Look Like in Real Life?

Summary
It can be frustrating for coaches and athletes when PRs don’t happen as often as they would like. To give some perspective, Coach Matt Tometz explains why it is important to keep the 95% PR threshold in mind when training sprints.
High-quality speed training can happen without running a personal record (PR). You might be thinking, “well, obviously—PRs aren’t going to happen every day.” But, then, why don’t most coaches and athletes have a mindset that reflects this belief? I’ve seen countless coaches and athletes frustrated by sprint times that weren’t PRs, even though the times were very high percentages of that PR.
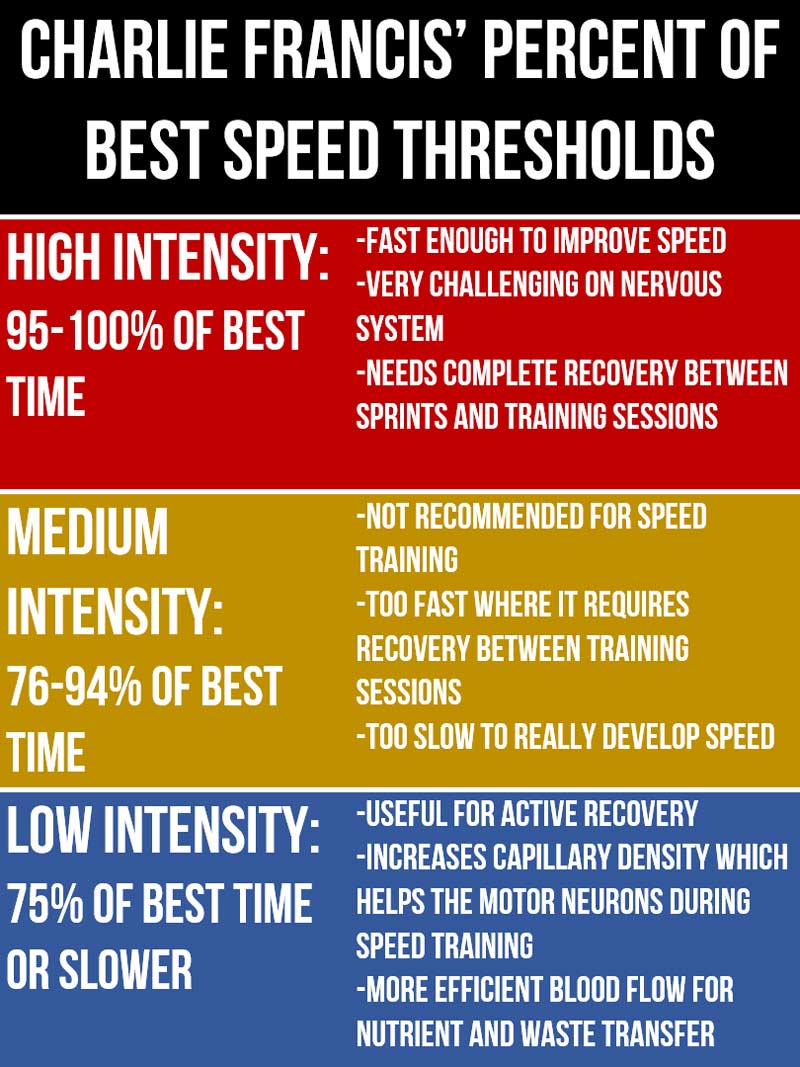
To truly evaluate progress, maintain athlete buy-in, and fight PR-itis (the belief that anything that is not a PR is a wasted training rep) with Charlie Francis-inspired long-term speed training, hitting 95% or better of your best threshold is an awesome goal. This threshold simply dictates that a sprint rep that’s 95-100% of your athlete’s best is a high-quality training rep and a good speed day, with under 95% being medium intensity and not fast enough to make the changes most speed training is pursuing.
We can all agree the 95% threshold is good for both the mental and physical sides of speed training, says @CoachBigToe. Share on XWe can all agree the 95% threshold is good for both the mental and physical sides of speed training. However, the questions to ask are not “Is 95% a good percentage?” or “Is 95% too high or too low?” Instead, better questions are:
- “What does the 95% threshold look like with real athletes and real data?”
- “How often are athletes under their 95%?”
- “How does this help me do my job better?”
In this article, I’ll take a dive into:
- How often athletes are actually under 95% of their best.
- Which data I drew this conclusion from.
- How this information can help you be a better coach.
Knowing the Threshold
With any sprint test (a Flying 10, a 15-yard timed acceleration, etc.), multiply your athlete’s best time by 1.05 (5% slower or 95% of their best) and that’s their range to be a high-quality speed training rep. For example, if an athlete’s best Flying 10 is 1.13 seconds, their range is from a 1.13 to a 1.19.
This all makes sense in theory, but what does it look like to actually coach with it?
Here is an example of a chart that could be printed out and posted on a wall in your facility wherever you time sprints.
This all makes sense in theory, but what does it look like to actually coach with it? asks @CoachBigToe. Share on X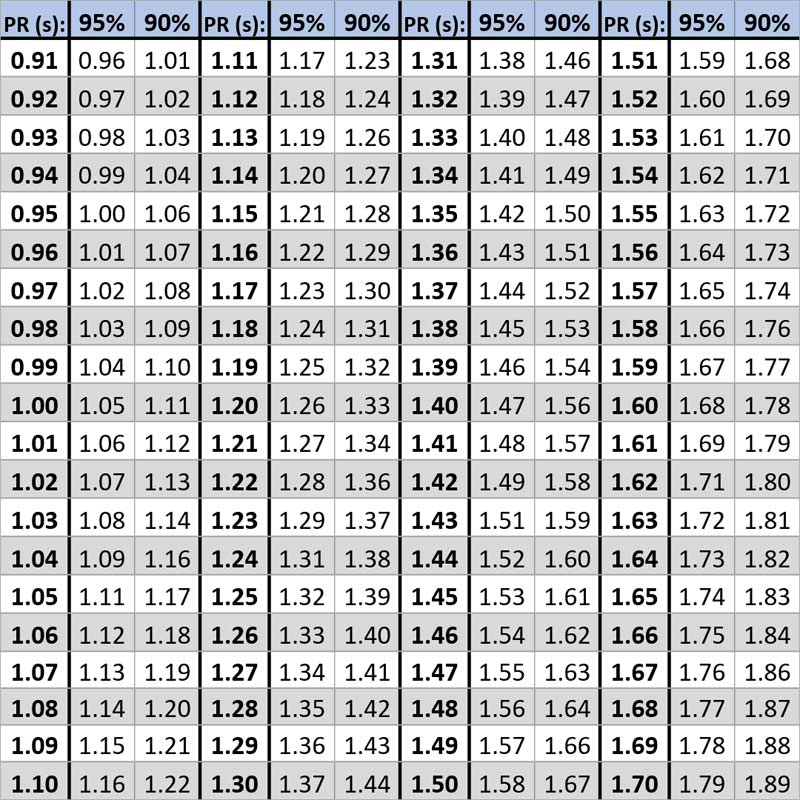
Methods
Within the TCBoost facility, I had 38 athletes (23 high school, 13 middle school, 2 college) with at least 10 sprint times of Flying 10’s and/or 5-15’s (15-yard acceleration with timing lasers at the 5- and 15-yard lines). During both the Flying 10’s and the 5-15’s, 28 of the 38 athletes had at least 10 entries, giving me a total of 66 series of 10+ sprint times.
The first entry of each series of sprint times did not have a percentage because it set the PR. If an athlete had 10 sprint times, 9 of those had a percentage of the PR associated with it. In total, this gave me a collection of 1,980 sprint times with a percentage to analyze.
Example Below 95%
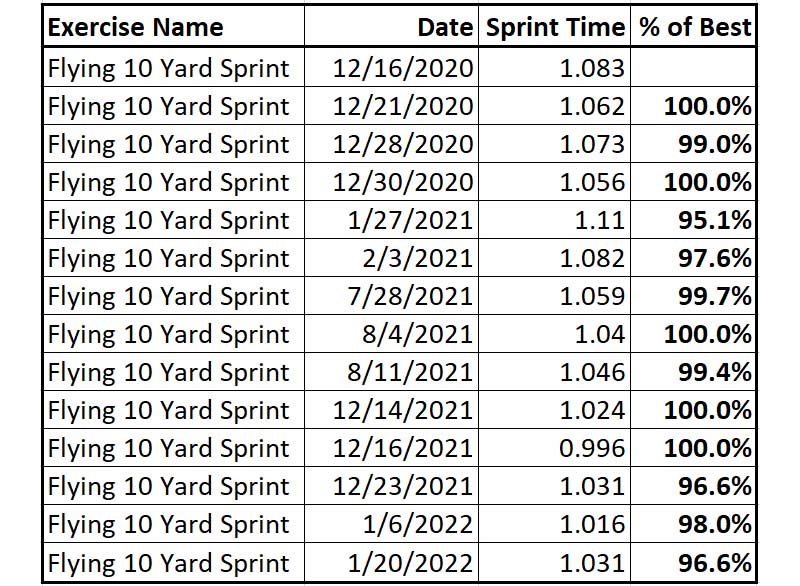
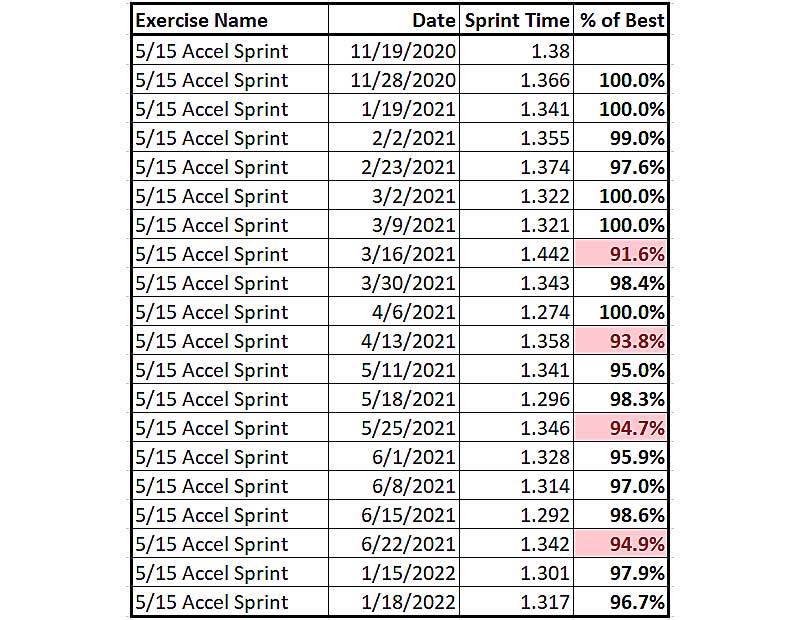
The athlete below PR’d 5 of their first 9 sessions (not including the first one), but didn’t PR in the last 10 sessions. A situation like this of early success and late plateaus could lead the athlete and coach to lose faith in each other and stop training. However, with the 95% threshold, there’s a new narrative of what progress looks like: 16 of the 19 sessions were fantastic speed days.
What the Numbers Say
On average, my athletes sprinted at 97.84% of their best time. Within each of the 66 series of 10+ sprint times, only 12.98% of the time were my athletes under 95% of their best. It’s important to note that some athletes spent 0.0% of the time under 95%, while some spent 50% of the time under 95%. A few factors among many that could affect sprint times include:
- Outside sports influencing their readiness and performance;
- Athletes being inconsistent with their coordination and output (believe it or not); and
- Emphasis on coaching/cuing and less on full speed.
It’s remarkable to think about the consistently high outputs athletes are capable of even with all those outside factors that could negatively influence performance.
It’s remarkable to think about the consistently high outputs athletes are capable of, says @CoachBigToe. Share on XContext of the Numbers
These numbers are specific to my athletes, the facility I coach at, the timing lasers we use, and the speed training we do. There are definitely grains of truth in these numbers, but there is a lot more context that needs to be explained.
The sprint times entered were only my athlete’s fastest ones of that day. The athlete could’ve run the first one just above 95% and all other consequent sprints below 95%. If so, that probably would’ve led to a modification of the session.
The faster the athlete and their PR, the smaller their threshold of 95% is. This could penalize faster athletes and reward slower athletes. An athlete with a PR of 1.00 has a 0.05 range, while an athlete with a PR of 1.50 has a 0.08 range. That’s why this is relative using a percentage of their best.
The faster the athlete and their PR, the smaller their threshold of 95% is, says @CoachBigToe. Share on XCoaching Solutions: Above the 95% Threshold
If your athlete is sprinting at or above the 95% threshold, stay the course. This means the athlete’s mind and body are in a good enough state to do high-quality speed training that day. Additionally, it’s an opportunity to reassure the athlete that their speed development is on the right path.
Coaching Solutions: Below the 95% Threshold
If your athlete is under the 95% threshold—which doesn’t happen as often as you’d think—there is some gray area in deciding what to do next. First, ask how they’re feeling. When incorporating data into your training, the flow should not run directly from data –> decision. Instead, the appropriate way to apply data follows the model of data –> discussion –> decision. Ask some questions and create a conversation to figure out the context of what could be the potential source(s) of the low sprint times.
If your athlete is under the 95% threshold—which doesn’t happen as often as you’d think—there is some gray area in deciding what to do next, says @CoachBigToe. Share on XIf your athlete looked good during their sprint and says their mind and body are feeling good, run another rep to see what happens. They could’ve needed one sprint to finish warming up, been thinking too much about coaching cues, etc.
If your athlete looked slow and the conversation exposed some factors negatively influencing their readiness to train, move on to something else. There are a variety of other ways to develop speed besides all-out timed sprints. An active recovery session could be the most valuable thing you can do for your athlete that day. Pushing forward with direct speed work could do more harm by causing excessive fatigue.
Key Takeaways
It’s incredible to know that in only about 1 out of every 10 speed sessions my athletes might not be ready for a very speed-intensive session. Meaning, an overwhelmingly large majority of the time, it’s a great day for speed training.
An overwhelmingly large majority of the time, it’s a great day for speed training, says @CoachBigToe. Share on XKnowing that athletes are not under 95% of their best as often as you might think, when it does happen, there are probably big causes negatively influencing their performance. It’s your job to be a detective before the sprints happen. Starting off each session with a simple question or two about how their day was and how ready they are to train starts giving you clues. The clues aren’t necessarily for how good their performance will be, but rather if you should be extra conscious of their first one or two sprints.
If my athlete is under their 95% threshold, I don’t end the session right away or throw my hands up in frustration. All I do is ask how they’re feeling and what’s been going on the last few days. I have my coach’s eye, my athletes know their bodies best, and the 95% threshold is just another tool in the toolbox (yes, I just rolled my eyes as well). Those three things contribute to my decision-making process by opening up discussion.
