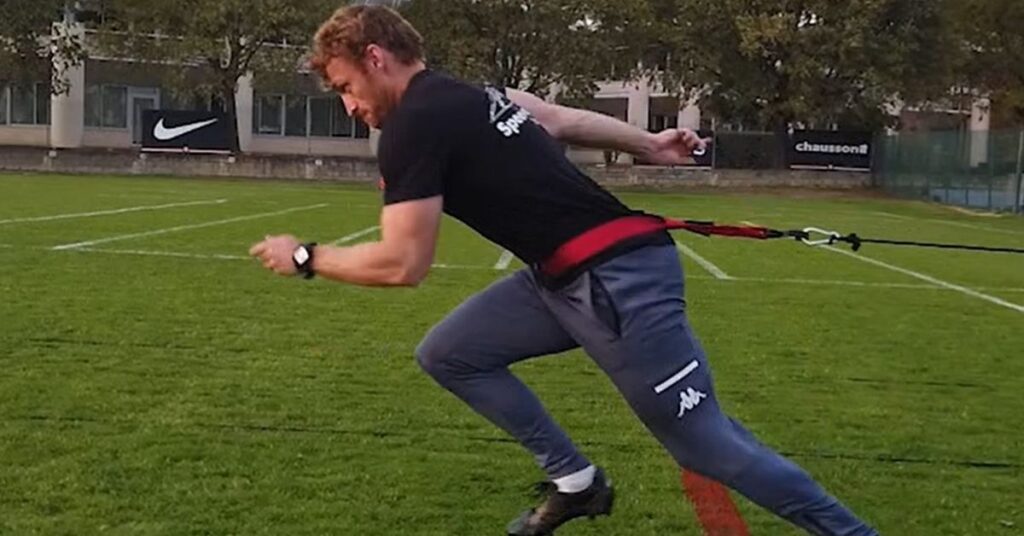
Resisted sprint training (RST) has been part of a coach’s repertoire for decades,1–3 with research showing the benefits of RST on sprint performance, specifically in the early acceleration phase.4–5 Coaches have historically used three main methods when prescribing RST loads:
- A load that is a certain percentage of the athlete’s body weight (%BW).
- A load to elicit a decrease in velocity compared to the athlete’s maximal velocity. Known more simply as velocity decrement (%Vdec).
- Absolute load (kg).
Depending on your situation (budget, time, and/or space), you may be obliged to use one method over the other. There have been numerous studies analyzing RST in a bid to help coaches determine what resistances to use. The study by Cross et al.6 found that the loading required to maximize power ranged from 69% to 96% of body weight. Another study by Cahill et al.7 found loads that caused a certain %Vdec differed between individuals.
These studies show us that RST is not as simple as putting 20kg on a sled and expecting the same adaptations across a group of athletes. Thanks to the development of technology such as the 1080 Sprint, it is now possible to easily and accurately profile athletes and program load.
Resisted sprint training is not as simple as putting 20kg on a sled and expecting the same adaptations across a group of athletes, says @jonobward. Share on XI’ve been fortunate enough to have had access to a 1080 Sprint for the last five seasons. My programming on the 1080 Sprint comes from reading and speaking with other coaches, experimenting, and putting my twist on “stolen” ideas. Previous SimpliFaster articles on RST have helped shape my approach to how I use the 1080 Sprint, including:
-
- George Petrakos wrote two great articles about methods of sled load prescription and programming for resisted sled sprinting. Good reads if you are starting off learning about RST or how to program for your athletes.
-
- Cameron Josse revealed how he uses maximum power sled sprinting in American football.
-
- Kyle Davey did an in-depth look at how he uses the 1080 Sprint with his athletes to target speed, strength, power, and potentiation.
- Matt Tometz gave us a load-velocity profiling 101 crash course using the 1080 Sprint in addition to this YouTube video, where he shows you how to create your own Excel spreadsheet to run the LVP calculations.
Finally, I have to give props to Dr. Julian Alcazar, who created this free, ready-made template to calculate %Vdec. I’m always grateful when smarter individuals share their work, as it makes my job that much easier!
In this article, I’ll share:
- How I use the 1080 Sprint with my team.
- Two different methods I use to profile my athletes.
- How I program resisted sprints.
- The results I have had using the 1080 Sprint.
1. Using the 1080 Sprint at Provence Rugby
To set the scene, I work in professional rugby union in France with a squad of 40+ players. I mainly use the 1080 Sprint in the gym, where there is a synthetic turf of 28 meters. I can move some equipment to increase the distance by 5 meters to give the athletes more space to decelerate, but this is not always possible.
The in-season period lasts 10 months, and the team normally has 2–3 gym sessions per week, depending on turnarounds between games. These sessions are split into two groups, the forwards and backs. The gym sessions are approximately 50 minutes and often are followed by a field session. This means I can’t stretch out the sessions. For this reason, I must be smart with my timing and precise in my programming.
The 1080 Sprint can provide resisted resistance in addition to assistance, and the resistance can be fixed or variable. For those of you who are unfamiliar with what that means, here is a breakdown in simple terms:
-
- Resistance = You’re the one pulling the 1080 Sprint cord.
-
- Assistance = You’re the one being pulled by the 1080 Sprint cord.
-
- Fixed Resistance = The weight stays the same throughout the run. For example, you are running 20m with a resistance of 15kg. You pull 15kg from the first meter to the last.
- Variable Resistance = The weight can change throughout the run. For example, you are running 20m with a starting weight of 20kg and program the end weight to be 10kg. Your first meter will be with 20kg, and the weight gets progressively lighter throughout the run, whereby you finish the 20m pulling 10kg.
There are more specifics around how to set the variable resistance—i.e., if you want the drop-off in weight to be quick or slow—but I’ll cover that later in the article.
Familiarization with the 1080 Sprint:
Before profiling my athletes, they all have a four-week familiarization block on the 1080 Sprint. Some of my athletes have been using the 1080 Sprint for five years, while new athletes may have never used the machine. The purpose of this familiarization block is to:
- Build RST capacity.
- Become familiar with the resistance of the 1080.
- Become familiar with the flow of the 1080 within the gym session.
- Cancel out any “newbie gains” that are seen as one gets more familiar with the 1080. Throughout the first couple of weeks, you’ll often see athletes improve their scores drastically as they become accustomed to sprinting with the machine.
There are two methods I have used for my familiarization blocks.
Familiarization Method #1, which I use before the Load Power Profile (LPP) method.
- Week 1: 1 x 10m @ 10kg / 1 x 10m @ 15kg / 1 x 10m @ 20kg
- Week 2: 1 x 10m @ 15kg / 1 x 10m @ 20kg / 1 x 10m @ 25kg
- Week 3: 1 x 10m @ 15kg / 1 x 10m @ 20kg / 1 x 10m @ 25kg / 1 x 10m @ 30kg
- Week 4: 1 x 10m @ 21kg / 1 x 10m @ 24kg / 1 x 10m @ 27kg / 1 x 10m @ 30kg
As you can see, the distance stays at 10 meters, with the loads getting gradually heavier each week. The last week uses the same weights that will be used during the LPP. This allows me to look at how the athlete responds under these heavier loads and potentially reduce the weight they will use during their LPP. This is generally the case for younger or lighter athletes.
Familiarization Method #2, which I use before the Load Velocity Profile (LVP) method.
- Week 1: 1 x 5m @ 21kg / 1 x 10m @ 15kg / 1 x 15m @ 10kg
- Week 2: 1 x 5m @ 24kg / 1 x 10m @ 18kg / 1 x 15m @ 10kg
- Week 3: 1 x 5m @ 27kg / 1 x 10m @ 24kg / 1 x 15m @ 15kg / 1 x 20m @ 10kg
- Week 4: 1 x 5m @ 30kg / 1 x 10m @ 27kg / 1 x 15m @ 15kg / 1 x 20m @ 10kg
As you can see, the distance gets longer, and the weight gets lighter. I only use 20m in my familiarization block due to space on the synthetic turf in the gym, which gives the athletes enough time to decelerate. If I sprint my athletes for longer and reduce the deceleration distance, some start decelerating before the end of the run because they are worried about not having enough time to decelerate safely.
A limitation of the first edition of the 1080 Sprint is that it only allows up to 30kg of resistance. While for the average Joe, this shouldn’t pose a problem, for professional athletes, you may find that 30kg is not enough to elicit max power (Pmax). Later in the programming part, I’ll touch on how I get around this, but apparently, the second edition of the 1080 Sprint allows up to 45kg of resistance!
2. Load Velocity and Power Profiling
The basic premise of profiling is to sprint your athletes using different resistances and record the velocity or power. If you are completing an LVP—the key here being velocity—you want your athletes to have achieved max velocity before the end of the sprint. Therefore, you need to choose a distance where this will occur.
For a Load Power Profile, use the same distance for each sprint while making sure the distance is long enough for the athlete to create relatively high amounts of power, says @jonobward. Share on XIf you are completing an LPP, you will use the same distance for each sprint while making sure the distance is long enough for the athlete to create relatively high amounts of power. You need a long enough distance to ensure a clear differentiation in power output across different loads, which helps to identify the load that generates peak power.
The LVP and LPP each have their strengths and weaknesses, and each will produce slightly different results. In the end, you must ask yourself what suits your situation best and whether you’re okay with accepting a small deviation in results.
Choosing the profiling method that you will use depends on:
- How many athletes do you have?
- How much time do you have?
- How much distance do you have available to sprint maximally and decelerate safely?
In my situation, I have one 1080 Sprint and 40+ athletes. For this reason, I split up the profiling throughout the week. I won’t gain any friends in the academic world by profiling over different days and different conditions (morning vs. afternoon, etc.), but this is the real world. In the first session of the week, I test the front row and second row from the forwards group and the halves from the backs group. In the second session of the week, I test the back row from the forwards group and the centers and outside backs from the backs group.
The example profiles I have included below are from the same athlete. He was recently injured (hand), which allowed me to use him as a guinea pig. For those interested, he is a 26-year-old flanker who weighs 105.4 kilograms. I also ensured adequate rest time (at least three minutes) between each sprint. He completed the LPP on one day and the LVP on another.
Load Power Profile
Distance: 4 x 10m
Loading: Incremental 21kg, 24kg, 27kg, and 30kg.
Calculate LPP: To calculate the LPP, I take the load that elicited Pmax and assume that the athlete achieved 50% of their max velocity during this sprint.
Because I am using peak power and not peak speed to calculate my LPP, I do not need to sprint my athletes over longer distances to obtain a peak velocity. Also, 95 times out of 100, the load at which the athlete develops peak power won’t change by them running an extra 5 meters. Below is an example of that, where the athlete is sprinting, and between the 8-meter and 15-meter mark, there is no large improvement in their Pmax. This is common to see among most athletes as the load gets heavier. So, to save time and keep the athletes slightly fresher, I stay with 10-meter accelerations.

The athletes complete four accelerations at 3kg increments because it is easy to repeat, I can turn the athletes around fast (and still allow approximately three minutes’ rest between each sprint), and it allows me to put athletes into “buckets” later when programming. I cannot individualize a resisted sprint training program for 40 athletes, so creating these “buckets” lets me semi-individualize the program. I’ll talk more about these buckets later in the programming section.
Ninety-five times out of 100, the load at which the athlete develops peak power won’t change by them running an extra 5 meters, says @jonobward. Share on XI should note that with my younger (or less powerful) athletes, I might perform the first run with 15kg or 18kg and work up from there. During the familiarization block, you will see how your athletes respond under certain loads, and this will help you choose the correct loads to run for your LPP. If you have fewer athletes, you could complete 5–6 accelerations at 2kg increments for a bit more precision. It all comes down to your situation!
Below, we can see four sprints over 10 meters with incremental loading. This athlete achieved peak power with 30kg of resistance.


Using the LPP Method, we assume that the athlete was running at a 50% velocity loss when achieving peak power, from which I then calculate their profile.

Load Velocity Profile
Distances: 1 x 40m, 1 x 25m, 1 x 15m.
Loading: 40m @ 1kg, 25m @ 20kg, 15m @ 30kg
Calculate LVP: To calculate the LVP, we use a linear regression model.
I use an LVP when I have more time, more space, and fewer athletes. For me, this is often the case during a session with the non-match day 23 (players not selected to play that weekend). A benefit to using this method is that the athlete completes a 40m sprint, which gives me a snapshot of their max velocity. Because I am using the athlete’s peak speed to calculate their LVP, I need the athlete to have achieved max velocity before the end of the run. If they don’t, we run the risk (excuse the pun) of underestimating their LVP.
I use a Load Velocity Profile when I have more time, more space, and fewer athletes, says @jonobward. Share on XRegarding the weight, I often use 1kg, 10kg, and 30kg with my athletes. When using the 1080, it is impossible to sprint at 0kg; therefore, I am obliged to put 1kg of resistance on the cord. If you have less powerful athletes, you can run with lighter loads for the 15-meter and 25-meter sprints.
Below, you can see the athlete’s three sprints, from which I calculate their LVP.

Above, the trace has leveled out, which means the athlete hit their max velocity before the end of the run. If the trace graphic has not leveled out, you will need to run the rep again and increase either the distance or the weight. Once you have the athlete’s velocity, you can calculate their profile.

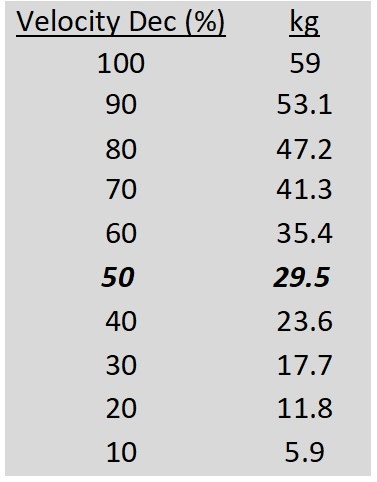
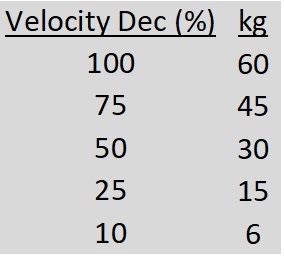
You can see there is only a 1kg difference (LPP 60kg vs. LVP 59kg) between the two methods at 100%Vdec, a 0.5kg difference (LPP 30kg vs. LVP 29.5kg) at 50%Vdec, and 0.1kg (LPP 6kg vs. LVP 5.9kg) at 10%Vdec. In my situation, when time and space are a constraint, I prefer to complete an LPP, as these small differences are acceptable to me.
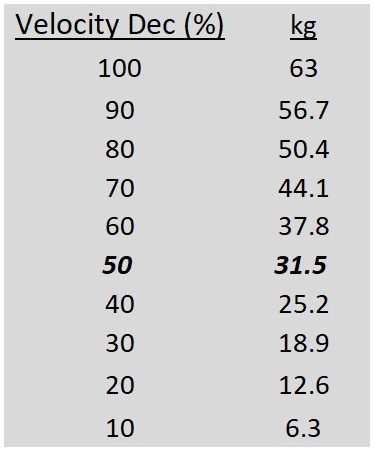
There is one caveat when using the LPP. The first edition 1080 Sprint only has a max resistance of 30kg, and it may not be heavy enough to elicit Pmax for certain athletes, says @jonobward. Share on XHowever, there is one caveat when using the LPP. The first edition 1080 Sprint only has a max resistance of 30kg, and it may not be heavy enough to elicit Pmax for certain athletes. See an example below of an athlete whose LVP shows their 50%Vdec load to be 31.5kg. I’ll address how I overcome this in the programming section later.
3. Programming Resisted Sprint Training (RST)
We program RST to improve sprint performance via:
- Increasing the power output.
- Improving horizontal force application.
We can program RST to target different aspects of a sprint, which are the acceleration phase, the transition phase, and the maximum velocity phase.2–8 Given the unique kinetics of each phase, we can modify the training to target each phase of the sprint.
The figure below is from Petrakos’ second article. When programming RST, you must ask yourself what part of the sprint you want to focus on. This will then determine the load and distance that you should prescribe.

Bucketing Athletes:
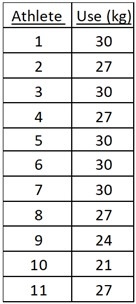
I mentioned earlier that I bucket athletes. This means that instead of programming 40+ resistances on the 1080 Sprint, I set 4–5 resistances most of the time. Next to the machine, I put a list with the athlete’s name and the weight they need to use for that session. Below is an example.
Early Acceleration:
If I want to target early acceleration (0–10m), I’ll use heavier loads that elicit a 50%–75%Vdec as I look to target Pmax and max force (Fmax). To determine the %Vdec that I want to work at, I calculate the individual athlete’s velocity decrements and compare this to their LVP or LPP to figure out the load I should use.
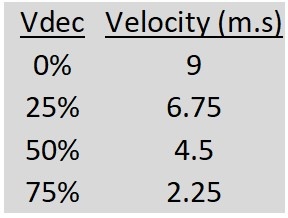
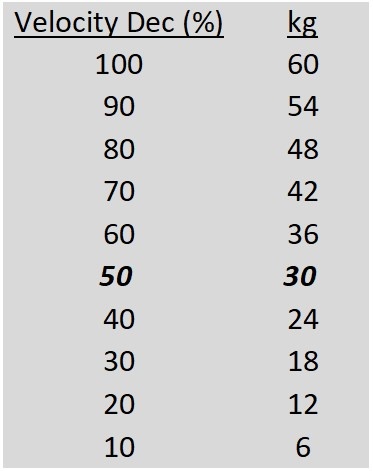
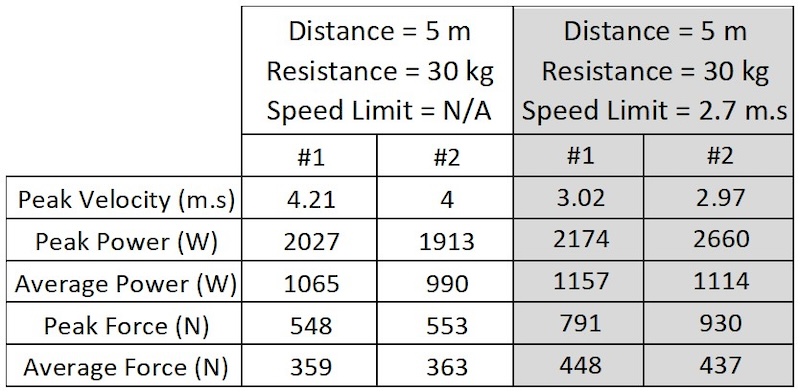
The data below is from an athlete who completed 2 x 5m accelerations with 30kg of resistance on the 1080 Sprint, with the objective of a velocity decrement of 50% (4.5 m/s). The athlete reached a peak velocity of 4.21 m/s at the 5m mark, which is a velocity loss of roughly 53%.


As mentioned earlier, the limitation of the first edition 1080 Sprint is that it only goes up to 30kg, which is not heavy enough to elicit a 50%–75%Vdec in my more powerful athletes. To counter this, I restrict the speed of the 1080 Sprint cord.
A word of warning—using the speed limit setting on the 1080 Sprint can create some very big technical changes in the sprint, says @jonobward. Share on XA word of warning—using the speed limit setting can create some very big technical changes in the sprint. I find my powerful athletes can stay stiff through the ankle, knee, and hip and drive forward horizontally. In my less powerful athletes, I find they are not strong enough to maintain good technique and often move side to side and “spin the wheels”; in these instances, I decrease the velocity decrement and only work to a 60%Vdec.
Below are two 5m accelerations where I wanted a 70% velocity loss, which for this athlete was 2.7 m/s.


You can see in the velocity trace that the speed limit kicked in around the second step. Sometimes, the athlete will break the speed limit as they strike the ground, and above is a prime example of that. The limit was set at 2.7 m/s; however, they hit 3.02 m/s. This raises the question of whether I should lower the speed limit further to avoid these small spikes in velocity and keep the athlete around 2.7 m/s, but honestly, I have not played around with this. For now, I’m happy to program the speed limit in accordance with their profile.
Something interesting when running at lower velocity decrements with the speed limit setting is that I see larger peak and average power scores, even though I’m working at a higher Vdec. One would think using a resistance that elicits a 50%Vdec would result in higher power scores, but that is not the case, as seen below. Both the Pmax and Fmax, in addition to the average power and force, were higher in the 70%Vdec accelerations.
Late Acceleration
If I want to target late acceleration (0m–15m), I’ll use loads that elicit 30%–50%Vdec. I understand 0m–15m is not considered “late acceleration” to some coaches, but in rugby, where most accelerations and sprints are over short distances,9,10 this is what I consider late acceleration.
Below is an example of 3 x 10m accelerations with 30kg of resistance on the 1080 Sprint.


You can see the athlete achieves max velocity between the 7m and 9m marks. Their max velocity was 4.48 m/s, which is nearly bang on the 50%Vdec for this athlete. With the power trace, we can see the athlete achieves Pmax between the 7m and 9m marks, which they then hold through to the end of the run.
Often, I only need to use the resistance of the 1080 Sprint to elicit Pmax; however, if the athlete requires more than 30kg to achieve Pmax, I will use the speed limit setting. As mentioned earlier, there can be detrimental technical changes in an athlete’s running technique when using the speed limit setting. This is something to consider if you are going to use this method. You may have an athlete who qualifies to use the speed limit method, but when they sprint with it, they fall apart technically, and you may find that their power output is not markedly different. In these instances, I would consider not using the speed limit.
Often, I only need to use the resistance of the 1080 Sprint to elicit Pmax; however, if the athlete requires more than 30kg to achieve Pmax, I will use the speed limit setting, says @jonobward. Share on XOkay, so what does an athlete need to do before I consider them for the speed limit method?
- The athlete achieves Pmax between the 9m and 10m marks (picture below).

- The velocity the athlete achieved is greater than their 50%Vdec.

The athlete above qualified for the speed limit method since he achieved Pmax between the 9m and 10m marks, and the max velocity of the sprint was 5.11 m/s, which was a 44% velocity decrement from his 9.2 m/s max velocity.
Below are two 10m accelerations from the same athlete using different loading protocols. The blue trace is the 10m acceleration with an added resistance of 30kg. The green trace was the 10m acceleration that had a speed limit of 4.3 m/s (50%Vdec) and a resistance of 15kg.


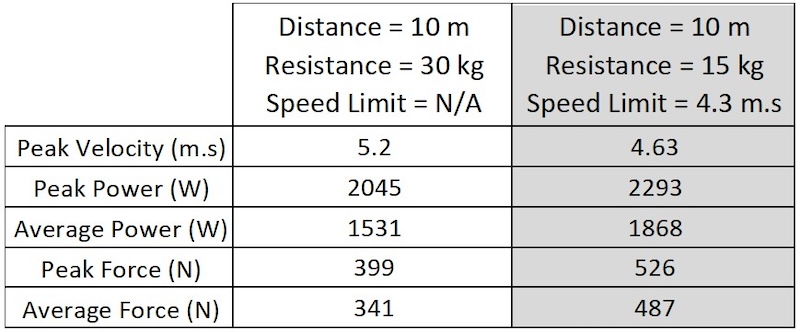
In the speed limit protocol (green trace), you can see the athlete reached the 4.3 m/s speed limit around the 3.5m mark. They hit Pmax shortly after the 4m mark and held it through to the end of the run. In the 10m acceleration with 30kg of resistance (blue trace), the athlete continued accelerating throughout the 10m, finishing at 5.2 m/s (above their 50%Vdec), and achieved Pmax in the last meter of the run. Due to the athlete hitting Pmax earlier in the speed limit protocol, it increased the 10m average power by 337 W. They also achieved a higher Fmax and average force.
Through trial and error, I found programming a resistance of 15kg in addition to the speed limit works best. When I use the minimum weight possible on the cord (1kg), the athletes explode off the mark, and they reach their 50%Vdec within the first 1–3 strides. This sounds ideal, BUT the cord jerks suddenly when the speed limit kicks in, which causes a noticeable disruption to their technique and rhythm.
On the opposite end, when I put 30kg on the cord, and the athlete accelerates, they will typically reach Pmax after the 7m–9m mark, and if they are only sprinting 10 meters, it means they are exposed to Pmax for 1–3 meters. When I put a 15kg resistance on the cord, and the athletes accelerate, they generally achieve Pmax between the 3- and 4-meter mark, meaning they will be exposed to Pmax for 6–7 meters. In addition, when the speed limit kicks in, the technique change is only slightly noticeable. For this reason, I use 15kg of resistance when using the speed restriction.
Below is an example of two 10m accelerations, with the green trace having a speed limit of 4.3 m/s in addition to 15kg and the red trace having a speed limit of 4.3 m/s in addition to 30kg.

In the 4.3 m/s and 15kg protocol (green trace), the athlete hit 50%Vdec and achieved a Pmax of 2347 W around 3.5 meters, and their 10m average power was 1773 W. For the 4.3 m/s and 30kg protocol (red trace), the athlete hit 50%Vdec and achieved a Pmax of 2335 W around 8.4m, and their 10m average power was 1416 W. While the difference in peak power between the two runs was small, they differ in when the athlete first hit peak power. This greatly impacts the average power, as seen by the 357 W difference in favor of the green trace acceleration.
Transition Phase:
If I want to target the transition phase (10–20 meters), I’ll use loads that elicit a 10%–25% Vdec. I am restricted by distance in my gym, but if using the 1080 on a longer track or field, I program longer distances. Below are two 20m sprints from the same athlete. The yellow trace is a 20m acceleration with 1kg of resistance. I included this repetition to give an understanding of what speed, power, and forces the athlete produces during unweighted sprinting. The green trace is a sprint using 15kg of resistance (25%Vdec).


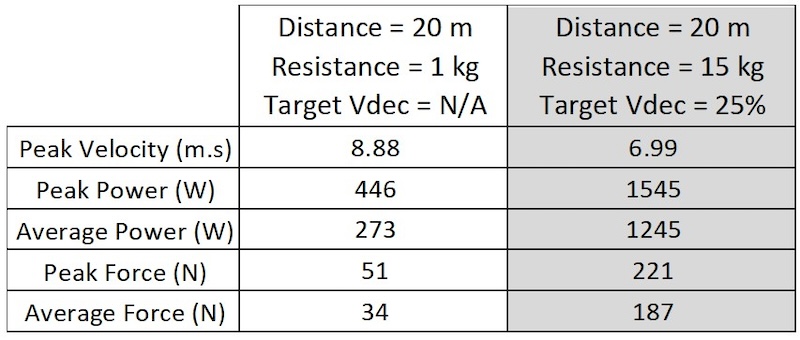
From above, we can see that this athlete hit 8.88 m/s when pulling 1kg (yellow trace), which equates to almost 99% of their max velocity. I’ll be the first to admit he is a great accelerator but lacks top speed. In the second sprint (green trace), he ran 20m, pulling 15kg, and hit 6.99 m/s, which is 77.5% of his max velocity, or a Vdec of 22.5%. This is in the ballpark for the 25%Vdec. The only thing I noticed is that he started to decelerate in the last meter, whereas I would have liked him to push through to the finish.
When programming for the transition phase, I sometimes prescribe variable resistance, says @jonobward. Share on XWhen programming for the transition phase, I sometimes prescribe variable resistance. The starting resistance on the cord is set at the athlete’s 25%Vdec resistance, and the end resistance is in conjunction with their 10%Vdec. Using the athlete’s data from Table 11, I would set the starting resistance at 15kg and the end resistance at 6kg.
When using the variable resistance setting, I must also set the velocity where the drop-off in resistance stops. I set the starting resistance at 15 kg (25%Vdec) and program the linear drop-off to stop when the athlete hits their 10%Vdec velocity.
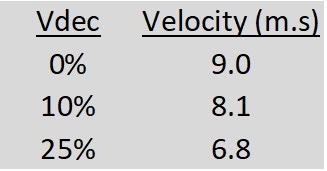
Using the data from the table above, I would schedule the drop-off to stop when the athlete hits 8.1 m/s. Because of space in the gym, I am restricted to using 15m–20m, but in a perfect world, I would program 20m–40m using this method. Anything under 15 meters is not long enough, and even then, some athletes who are slower accelerators or have high top-end speed won’t reach 10%Vdec before 20m.
4. Improvements from RST
The goal of RST is to become faster. With my group, I test the efficacy of the intervention in one of three ways:
- A 20m sprint on the 1080, looking at the 5m splits.
- Complete an LVP or LPP and compare the results from the previous profile.
- In session, by looking at the power output the athlete produces when using the same resistance.
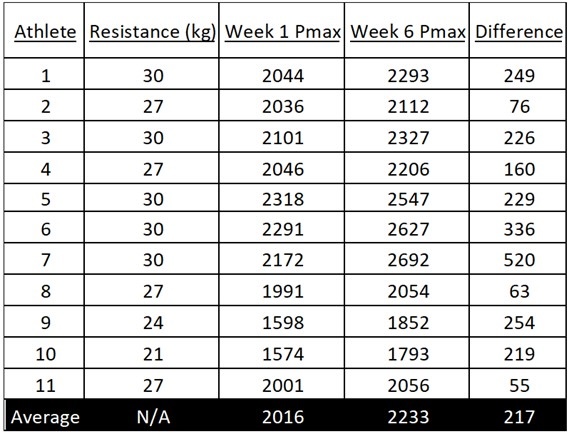
Below is an example of using the third method. I ran a familiarization protocol recently, completed load power profiles with the squad, and then ran a six-week intervention where athletes ran 3 x 10m at the resistance that elicited their Pmax. Below are 11 backs (I left out any player who missed one or more sessions), and you can see that six sessions were enough to improve players’ peak power.
Last season, I completed two interventions, side by side, on the 1080 Sprint with nine backs and six back rowers. (If you aren’t familiar with rugby but know American football, these guys are like rugby’s version of linebackers.) I ran a 50%Vdec intervention, targeting acceleration, which consisted of 3 x 10m sprints completed inside the gym session.
Of the 10 players, only seven completed the pre-20m test, six-week intervention, and post-20m test. The other intervention focused on the transition phase, where I had athletes sprint 15 meters with variable resistance on the cord, starting at 25%Vdec and finishing at 10%Vdec. These athletes were my good accelerators, and they hit 25%Vdec around 8m–10m.
I admit that the athletes rarely finished the 15m at their 10%Vdec due to space limitations. I would have liked to use 20m, but that will be for a future intervention! Of the five players in this group, only four completed the intervention and testing. Below are the results.
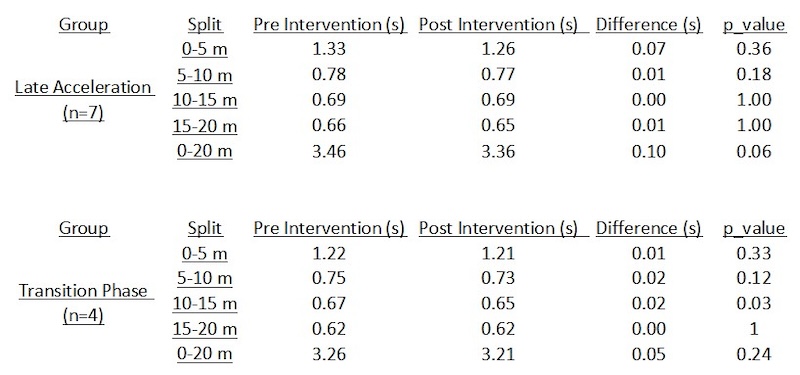
What stands out to me is the 0.08-second improvement in the 0m–10m split for the 50%Vdec group and the significant improvement in the 10m–15m split for the transition phase group. No improvements were seen in the 15m–20m split, which does not surprise me for two reasons, mostly relating to the SAID principle (specific adaptation to imposed demands).
- We did not train this part of the sprint in the intervention.
- The athlete rarely sprints 20m–40m all out during the week to elicit improvements.
One final note!
For those who do not have a 1080 Sprint, unfortunately, you cannot compare your data to the above. Even different starting positions using speed gates will result in performance differences11; however, I know that as practitioners, we still like to compare, so below is data from a 20m sprint using the 1080 Sprint and speed gates.
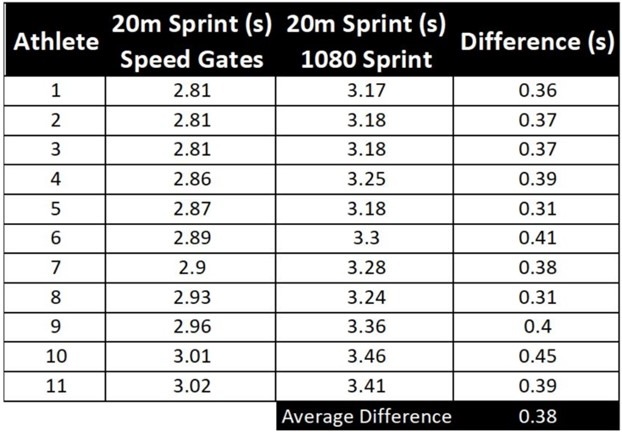
The average difference of 0.38 seconds, in favor of speed gates, is similar to the study by Rakovic et al.12 where they found a difference of 0.31 seconds also in favor of the speed gates. The authors found that the difference in time between the two timing methods occurred during the 0–5m split and related to the trigger motion of the sprint. The trigger of the 1080 Sprint is more sensitive than a timing gate and, in my opinion, more accurate, as it responds to any movement above 0.2 m/s.
The trigger of the 1080 Sprint is more sensitive than a timing gate and, in my opinion, more accurate, as it responds to any movement above 0.2 m/s, says @jonobward. Share on XExperiment with the 1080 Sprint on Your Own
I have no affiliation with the 1080 Sprint, yet it is one of the best tools available for training the sprint. The ability to individually profile and program means you can be accurate in your prescription. If you are lucky enough to have access to a 1080 Sprint, you may find your team setting could be very different from mine, and this dictates how you can use it.
When I was with another team, we used the 1080 Sprint at least twice per week, and sometimes three times per week, to great effect. I encourage you to play around on the machine, be a guinea pig yourself, and share what you find!
Since you’re here…
…we have a small favor to ask. More people are reading SimpliFaster than ever, and each week we bring you compelling content from coaches, sport scientists, and physiotherapists who are devoted to building better athletes. Please take a moment to share the articles on social media, engage the authors with questions and comments below, and link to articles when appropriate if you have a blog or participate on forums of related topics. — SF
References
1. Costello, F. “Speed: Training for Speed Using Resisted and Assisted Methods.” Strength & Conditioning Journal. 1985;7:74.
2. Cronin J and Hansen KT. “Resisted Sprint Training for the Acceleration Phase of Sprinting.” Strength & Conditioning Journal. 2006;28:42.
3. Lockie R, Murphy A, and Spinks C. “Effects of Resisted Sled Towing on Sprint Kinematics in Field-Sport Athletes.” Journals of Strength and Conditioning Research/National Strength & Conditioning Association. 2003;17:760–767. doi:10.1519/1533-4287(2003)017<0760:EORSTO>2.0.CO;2.
4. Petrakos G, Morin J-B, and Egan B. “Resisted Sled Sprint Training to Improve Sprint Performance: A Systematic Review.” Sports Medicine. 2016;46:381–400. Doi:10.1007/s40279-015-0422-8.
5. Alcarez PE, Carlos-Vivas J, Oponjuru BO, and Martínez-Rodríguez A. “The Effectiveness of Resisted Sled Training (RST) for Sprint Performance: A Systematic Review and Meta-Analysis.” Sports Medicine (Auckland, NZ). 2018;48:2143–2165. doi:10.1007/s40279-018-0947-8.
6. Cross MR, Brughelli M, Samozino P, Brown SR, and Morin J-B. “Optimal Loading for Maximizing Power During Sled-Resisted Sprinting.” International Journal of Sports Physiology and Performance. 2017;12:1069–1077. doi:10.1123/ijspp.2016-0362.
7. Cahill MJ, Oliver JL, Cronin JB, Clark KP, Cross MR, and Lloyd RS. “Sled-Pull Load-Velocity Profiling and Implications for Sprint Training Prescription in Young Male Athletes.” Sports. 2019;7:119. doi:10.3390/sports7050119.
8. von Lieres und Wilkau HC, Irwin G, Bezodis NE, Simpson S, and Bezodis IN. “Phase Analysis in Maximal Sprinting: An Investigation of Step-by-Step Technical Changes between the Initial Acceleration, Transition and Maximal Velocity Phases.” Sports Biomechanics. 2020;19:141–156. doi:10.1080/14763141.2018.1473479.
9. Nicholson B, Dinsdale A, Jones B, and Till K. “The Training of Short Distance Sprint Performance in Football Code Athletes: A Systematic Review and Meta-Analysis.” Sports Medicine. 2021;51:1179–1207. doi:10.1007/s40279-020-01372-y.
10. Nicholson B, Dinsdale A, Jones B, and Till K. “The Training of Medium- to Long-Distance Sprint Performance in Football Code Athletes: A Systematic Review and Meta-Analysis.” Sports Medicine. 2022;52:257–286. doi:10.1007/s40279-021-01552-4.
11. Weakley J, McCosker C, Chalkley D, Johnston R, Munteanu G, and Morrison M. “Comparison of Sprint Timing Methods on Performance, and Displacement and Velocity at Timing Initiation.” Journal of Strength and Conditioning Research. 2023;37:234–238. doi:10.1519/JSC.0000000000004223.
12. Rakovic E, Paulsen G, Helland C, Haugen T, and Eriksrud O. “Validity and Reliability of a Motorized Sprint Resistance Device.” Journal of Strength and Conditioning Research. 2022;36:2335–2338. doi:10.1519/JSC.0000000000003830.

