Load-Velocity Profiling on the 1080 Sprint: Everything You Need to Know
Summary
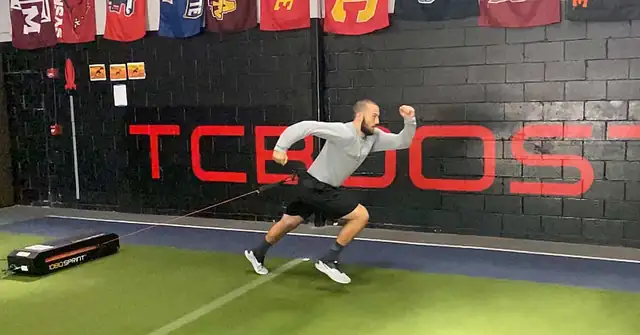
As Coach Matt Tometz states, load-velocity profiling is how to stop guessing about how much resistance to use for each athlete in sprint training. Here, he walks us through the process of load-velocity profiling speed athletes using the 1080 Sprint or any resisted sprint training method.
We’ve entered the speed era of sports performance; however, we’ve also entered the era of data availability and athlete individualization. Coaches understand that technology can help target training to give each athlete what they specifically need to increase the odds of optimal adaptations for increasing speed. When strength training, you program based on percent of 1 rep max or specific velocity zones rather than putting arbitrary amounts of weight on the bar or using the same weight for everyone; the same concept applies to speed development and resisted sprinting.
Load-velocity profiling is how we stop guessing about how much resistance to use for each athlete in sprint training. It is a holistic assessment to describe an athlete’s ability to perform a certain exercise or movement, typically comparing two variables: in this case, load (resistance) and velocity. The relationship between load and velocity is negatively linear—as the load increases, sprinting velocity decreases.
Load-velocity profiling is how we stop guessing about how much resistance to use for each athlete in sprint training, says @CoachBigToe. Share on XInstead of just doing a 1RM back squat, which only tests an athlete’s ability to squat against maximal loads, or one unresisted timed sprint at max velocity, a profile gives broader insight into their skill on that movement by using 3-5 data points. We can use this relationship to our advantage when programming to have individual athletes sprint at specific speeds to get the desired training adaptations. The catch, however, is that each athlete has their own specific relationship to how load affects their velocity.
*Note 1: This article is specifically about using the 1080 Sprint, but the concepts and principles about load-velocity profiling are universal and can be applied to any resisted sprint training.
*Note 2: I will say “yards” as that is how I determine distances when profiling and programming in training, but the 1080 Sprint measures distance in meters.
Linear Regression
A linear regression is a predictive model aimed not just at measuring the association of two variables, but how one can be used to predict the other. In this situation, if I know the load or velocity of a sprint, can I predict the other? Load-velocity profiling is collecting actual data points about the athlete’s load-velocity relationship when sprinting and using a linear regression to help predict everything else in between.
If we know what velocities we want, we can predict what loads to use to achieve those velocities. This is how the data gets turned into action, says @CoachBigToe. Share on XWhen individualizing resisted sprint training, the goal is to sprint at certain velocity decrements of the athlete’s fastest velocity. If we know what velocities we want, we can predict what loads to use to achieve those velocities. This is how the data gets turned into action. Each athlete has their own unique relationship of load and velocity and consequently their own regression.
Acclimation to Resisted Sprinting
In order to get a reliable and valid profile, the athlete has to be familiar with the movement, technology, and resistance they will be performing against. Reliability is the consistency of the test and validity is whether the test actually assesses what you say it is measuring. At the beginning, the athlete will improve due to neuromuscular adaptations simply by becoming more familiar and proficient at that movement (think “newbie gains”); thus, comparison to future profiles is not as meaningful.
For those who have never experienced the feeling of sprinting against a 1080 Sprint with moderately high resistance (15+ kg)—it is quite the challenge. It is an extremely high quality and smooth resistance with the ability to go up to 30 kilograms, which is not for the faint of heart. Let’s just say a first attempt at heavy sprinting is not always pretty.
The athlete will get better at running against the 1080 Sprint the first few times without actually becoming “faster.” The addition of a familiarization session is not just to ensure the reliability and consequent validity of the profile, but also the most accurate pre- and post-test analysis and reflection on the training program. The athlete should be familiar with the 1080 Sprint and similar resistances they will be running against for the profile.
Velocities
We can break “load-velocity profile” into its components: specific “loads” (resistances) relative to the athlete’s fastest “velocities” at those loads. A fundamental part of load-velocity profiling is having the athlete’s truest max velocities at those loads.
The 1080 Sprint is extremely convenient for this because it automatically calculates the fastest 5 meters of every sprint. In the case of alternative methods of load-velocity profiling such as timing gates, you are assuming the athlete will reach their true max velocity within the gates based on how much distance you give them beforehand to accelerate. If it is too much distance, the athlete will be slowing down due to fatigue before the end of the gates; if it is too little distance, the athlete will be at sub-max velocities when they enter the gates.
The issue of having too much distance is mitigated by the 1080 Sprint calculating the fastest 5 meters regardless of where it occurs in the sprint. (However, the issue might arise from having too little distance, which does not allow the athlete to truly reach their max velocity at that load.)
“Peaking Out”
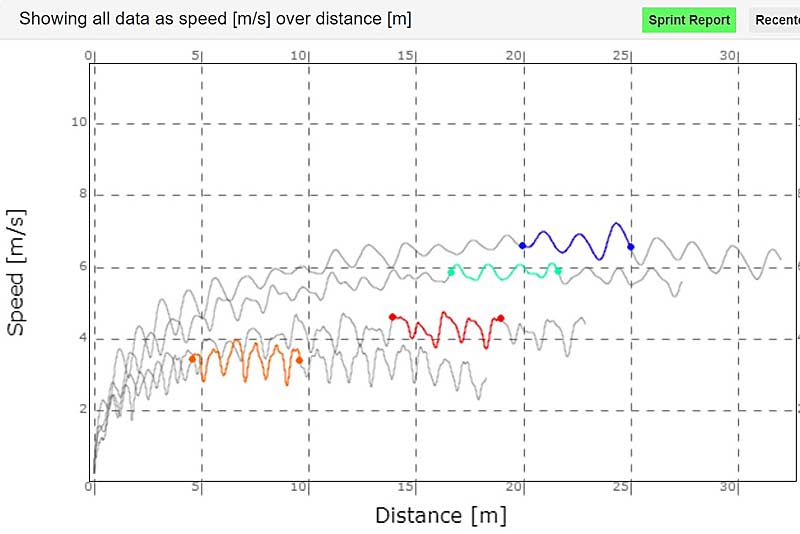
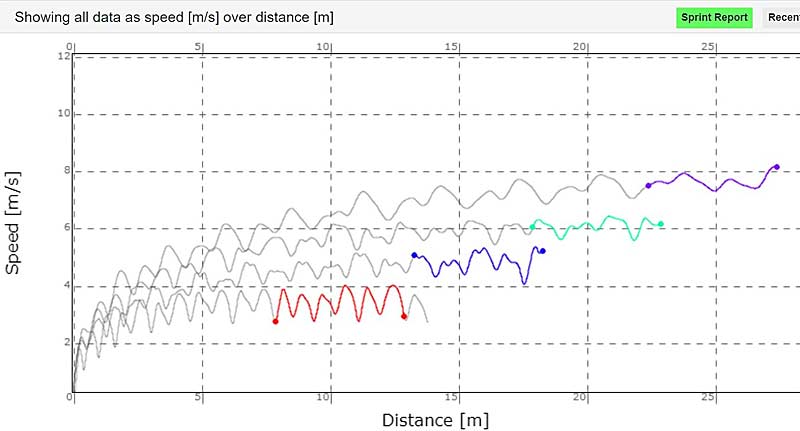
My colleagues and I use the term “peaking out” when there are at least 1-2 complete steps after the fastest 5 meters, which shows that the athlete’s velocity has truly “peaked” during the sprint. On the tablet of the 1080 Sprint, the fastest 5 meters will automatically be bolded, and it will turn a different color on the website. Figure 2 is an example of an athlete who has truly “peaked out” on all four sprints. Each “mountain” from bottom to bottom is a complete step. The first (top) sprint had 3.5 steps after the fastest 5 meters, the second had three, the third had 2.5, and the fourth (bottom) had eight.
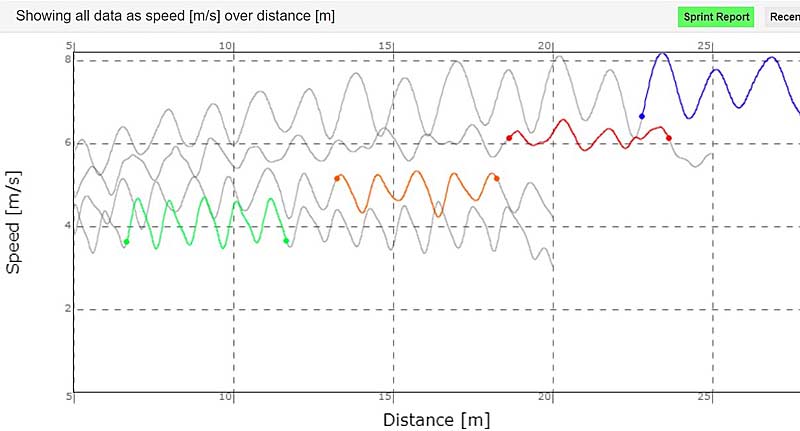
In figure 3, would the 5-meter velocities have changed if the sprints were extended 5 more yards? Probably. Would they have changed a substantial amount to alter the profile? Maybe yes, maybe no. Was the athlete close enough to their max velocity? Not for a true load-velocity profile. Want to know the easiest way to leave no doubt that it was their true max velocity? Be certain they peaked out.
Want to know the easiest way to leave no doubt that it was their true max velocity? Be certain the athlete peaked out, says @CoachBigToe. Share on XIt is important to note if the athlete “peaked out” or not because future reassessment of the profile might not reflect adaptations and changes in velocity from training, as the distances are not sufficient to reach max velocity. If that is the case, I would recommend adding 5 yards to every sprint and re-profiling the athlete the next training session. Additionally, comparing the profiles of athlete A, who “peaked out,” to athlete B, who did not, might not lead to the most accurate comparisons.
Protocols: Resistances and Distances
Now that we are all on the same page for what profiling is and why it is important, how do we actually do it? First, we pick which resistances to run against. Protocols recommended by sports scientist and resisted-sprint expert Dr. Micheál Cahill include:
- Four total sprints, all reaching true max velocity (aka “peaking out”).
- One unresisted sprint and three resisted sprints, with one of the resisted sprints being slower than a 50% velocity decrement (Vdec).1
For determining the distances: In a full sprint, is there enough distance for the athlete to achieve max velocity and maintain it for 5 meters, then have one or two slower steps due to fatigue (“peak out”), but not have such an extended sprint distance to where the required rest would be excessive? There is definitely a sweet spot, and I have experimented with different combinations with the four sprints, from 30-25-20-15 yards to 30-25-20-20 yards to 35-30-25-20 yards (my recommendations are below).
How do you know where 50% Vdec is, and what resistance should you utilize for the last sprint? There are a few ways:
- Do a lot of profiles and be able anecdotally to guess roughly where it is for each athlete (my protocol recommendations for general athlete skill levels are below).
- Because load and velocity have a negatively linear relationship, you could likely guess after the first two sprints how many more kilograms you will need. If the athlete’s 5-meter velocity of the first sprint was 8.0 m/s at 1 kg and the second sprint was 6.75 m/s at 5 kg, you could reasonably assume that every 4 kg reduces velocity about 1.25 m/s. Nine kilograms would be 5.5 m/s and 13 kg would be 4.25 m/s, which is pretty close to 50% of 8.0 m/s (because 1 kg is essentially an unresisted sprint at max velocity). In that situation, continue with 4 kg increases.
Here are the three standard protocols that we use in our facility:
- Beginner: 1 kg for 35 yards, 5 kg for 30 yards, 10 kg for 25 yards, 15 kg for 20 yards.
-
- Beginner males, beginner females, and intermediate females.
- Intermediate: 2 kg for 35 yards, 8 kg for 30 yards, 14 kg for 25 yards, 20 kg for 20 yards.
-
- Intermediate males and advanced females.
- Advanced: 3 kg for 35 yards, 10 kg for 30 yards, 17 kg for 25 yards, 24 kg for 20 yards.
-
- Advanced males.
The skill groups are recommended based on anecdotal evidence of what resistances their 50% Vdec usually calculate to. There will always be other factors, such as experience sprinting with the 1080 Sprint, body weight, and psychological and physical readiness to train, but those protocols are a great place to start.
“Intermediate” and “advanced” will mean different things to different coaches, but here is an example: Of the nine “advanced” female athletes I have profiled (three high school athletes committed to play in college, five college athletes, and one professional athlete), their profiles yielded an average 50% Vdec of 16.1 kg ± 1.7 (range: 13.8-19.2). With an average 50% Vdec of 16.1 kg and max of 19.2, the “intermediate” protocol would be the most appropriate.
Rest Intervals
To create a true load-velocity profile, you need to ensure that the athlete has recovered and is ready to achieve max velocity before each sprint. A very general rule of thumb for rest periods during speed development is one minute for every 10 yards. However, in the case of resisted sprinting, the same yardage could take twice as long, so that rule does not always apply.
Anecdotally, a minimum of two minutes’ rest between sprints might be the lower limit of adequate rest, with anything above three minutes yielding diminishing returns. As soon as the athlete finishes their sprint, unclips the belt of the 1080 Sprint, and starts walking back, I start the timer on my watch. When it gets to around 2:15 of rest, I have the athlete hop back in the belt and get ready to sprint. That gives us 2:30 of rest.
Whatever rest intervals you choose, try to keep it consistent for repeatable protocols across all your athletes and for retesting purposes, says @CoachBigToe. Share on XI am conscious that there is a fine line between keeping the flow of the session going (especially when profiling multiple athletes), resting to ensure full recovery, and maximizing your time coaching. But if you can get four high-quality resisted sprints in during 10 or 12 minutes while yielding a valid load-velocity profile, I believe that is an effective use of your time. Whatever rest intervals you choose, try to keep it consistent for repeatable protocols across all your athletes and for retesting purposes.
Calculating the Profile
Ever thought you would need to bring back that algebra you learned in middle school? Well, here it is! But this is at least a little more exciting because it has to do with resisted sprint training. Bring back those suppressed memories, because we are talking about linear regressions and the equation Y = M(X) + B.
Here is a cheat sheet for all the variables:
- Y = 5-meter velocity achieved during that sprint (m/s).
- M = slope, ability to sprint against resistance.
- X = load/resistance (kg).
- B = Y-intercept (when load is 0), athlete’s maximum 5-meter velocity (m/s).
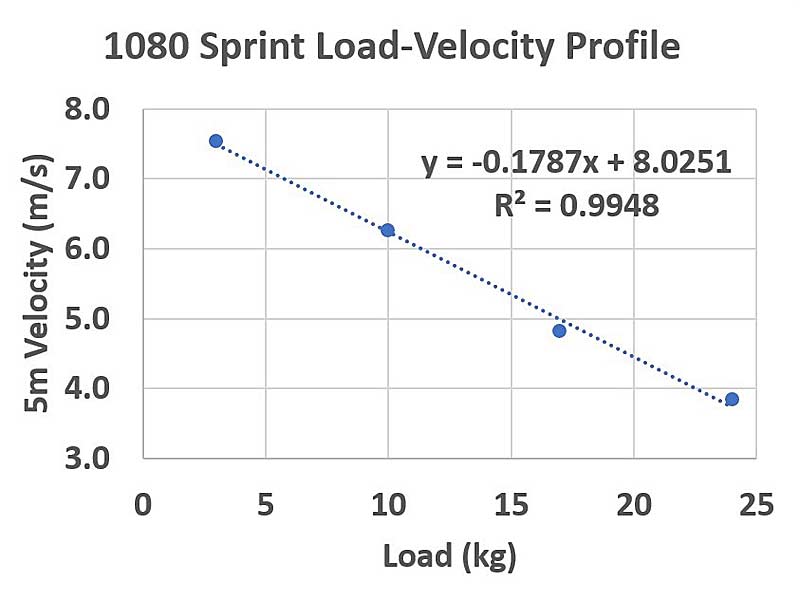
M and B are automatically calculated from the regression, so you will be given an equation that looks something like this: Y = -0.1787(X) + 8.0251.
In resisted sprint training, we speak in terms of velocity decrement or reduction from the athlete’s max velocity. Similar to them squatting at 75% of their 1 rep max, they can sprint at 25% Vdec of their max velocity. Every athlete has their own unique equation and will have specific loads required to sprint at certain velocity decrements, which is how training is individualized.
Using algebra and knowing what velocity decrement and consequent actual velocity we want to sprint at (variable Y), we work backward to calculate the load (variable X) to put on the 1080 Sprint to achieve that velocity.
Let’s work through an example using the equation above. If 8.0251 is the max 5-meter velocity, we can calculate the following velocity decrements. Velocity decrement is how much slower from the fastest we are: 10% Vdec is 90% of the fastest, 25% Vdec is 75% of the fastest, 50% Vdec is 50% of the fastest.
- 10% Vdec = 8.0251 * 0.90 = 7.2226 m/s
- 25% Vdec = 8.0251 * 0.75 = 6.0188 m/s
- 50% Vdec = 8.0251 * 0.50 = 4.0126 m/s
Let’s rewrite the equation and work through a 25% Vdec:
- Y = M(X) + B
- Velocity sprinted at for 25% Vdec = slope (kg on 1080 Sprint) + max 5-meter velocity
- 6.0188 = -0.1787(X) + 8.0251
- -2.0063 = -0.1787(X)
- X = 11.2
- Kg on 1080 Sprint = 11.2
In order for the athlete to run at 25% Vdec and achieve a “peaked out” 5-meter velocity of 6.0188 m/s, the load on the 1080 Sprint should be 11.2 kg. Sometimes that number will exactly line up in real life, and it is pretty cool when it does, but humans are not machines or equations. There are multiple factors that could affect the velocity achieved when actually sprinting compared to the calculated: the athlete has improved and will reach a higher velocity, the athlete is fatigued during the session and it will be lower, or the distance was not long enough to peak out. Those are all factors to consider, and the athlete will be close to the calculated number, but that is how you take the guessing out of programming resistances (at least at the beginning).
Personally, I like doing this all in Microsoft Excel, but 1080 Motion has a load-velocity profile function built in. If you do it in Excel, I have an extensive YouTube video on how to do this for sprinting, lifting, and jumping here.
R2 Value
The R2 of a linear regression is the level of ability the equation has to predict the other variables. A high R2 value means it was a reliable profile and fits the negatively linear load-velocity relationship extremely well, making it really good at predicting values based on the four sprints the athlete performed.
The average R2 of 73 profiles I have administered across 55 different athletes is 0.992 ± 0.007 with a maximum of 1.000 and minimum of 0.968. R2 values can range from 0 (no ability to predict) to 1 (perfect ability to predict). With only eight of the profiles (11%) being below 0.985, an R2 of 0.985 is the threshold we use as a reliable profile. Within these 73 profiles, I have used a variety of protocols, including:
- Combinations of distances and resistances
- Assessing athletes from middle school to professional
- Whether it is the athlete’s first time on the 1080 Sprint
- Sometimes not achieving 50% Vdec
- Sometimes not being “peaked out”
- Sometimes using three or five data points
This is all in the process of learning and determining my consistent protocols and still getting an incredibly high R2 value.
One of the reasons the R2 value of the load-velocity profiles on the 1080 Sprint is very high is the fact that it automatically calculates the fastest 5 meters of every sprint. The 1080 Sprint is extremely effective at describing the relationship of load and velocity and consequently predicting the variables, but the question now becomes whether the protocols and sprints performed truly represent that relationship. Did the athlete “peak out” every sprint? Was it fatigue or effort that made the graph appear it was “peaked out”? Was one sprint slower than 50% Vdec? That is how a reliable profile becomes valid.
Programming
There are aspects of resisted sprint training that we know are associated with optimal loading zones.
- 0%-10% Vdec is the technical zone.
- 10%-40% Vdec is the speed-strength zone.
- 40%-60% Vdec is the power zone.1
- 50% Vdec is about where max power is.2
Having a 1080 Sprint does not make you a good speed coach, and simply sprinting at certain velocity decrements will not guarantee the best speed improvements. You need a goal, a program, progressions, and coaching to help you get there. Load-velocity profiling just takes the GUESSING out of picking resistances; it does not write your programs or do the coaching for you.
Load-velocity profiling just takes the GUESSING out of picking resistance; it does not write your programs or do the coaching for you, says @CoachBigToe. Share on XHere is an example of how you could program resistances into your sprint development:
- Phase 1 (Skill Acquisition): resisted mechanics/technique drills at loads consistent with 10%-40% Vdec (4 x 10 yards), paired with contrast sprints at 0%-10% Vdec (4 x 15 yards).
- Phase 2 (Speed-Strength Development): resisted sprints at 50% Vdec (4-6 x 10-15 yards).
- Phase 3 (Speed-Realization): resisted sprints at 25% Vdec alternating with contrast sprints at 1 kg (3-4 rounds of one resisted sprint with one contrast sprint, 15-20 yards each).
Understanding what is high or low for the slope (M, the athlete’s ability to sprint against resistance) and the y-intercept (B, the athlete’s max velocity) can help determine where to start focusing training efforts to improve the profile. Additionally, tracking those variables through multiple profiles can provide insight into how the training is affecting the athlete’s performance.
Other Nuances
There are many other factors you also should take into consideration.
Coaching
This nuance is choosing whether or not to coach the athlete between sprints. If you give the athlete a cue between their first and second rep that helps them on their next sprint, it may affect their load-velocity profile for that day. I am not saying give your athlete zero feedback—profiling is a training session, and it should be used to get better—but you have to understand that coaching could affect the athlete’s sprinting ability from rep to rep. I have kept the tablet secret between sprints, not showing my athlete any data, and I have maximized the rest period coaching. There is no right or wrong on this one, just keep it consistent.
Fatigue
Did the athlete “peak out” because of fatigue or effort? Fatigue-wise, they are still trying as hard as possible, they just cannot maintain their max velocity. Effort-wise, they might have stopped trying before they crossed the finish line. Both fatigue and lack of effort will look the same on the graph.
I have seen athletes simply run to the line and stop, meaning they decelerated before the line instead of running through the line. They simply could not be motivated, or they were just not comfortable with a heavy resistance over a moderate distance. This is where you as a coach must decide from visually looking if they “peaked out” from effort or fatigue, which will affect whether it is a valid profile. Your eyes will help you out the most on this one.
Retesting
Load-velocity profiling is an assessment and can be used to track progress over time. How long do you expect it to take to achieve meaningful adaptations from training? Four weeks plus a deload? Do your training blocks typically last six weeks? What numbers will you focus on improving the most? This will all depend on your goals and programming.
It is extremely important to make sure you get a valid profile the first time—that way your protocols do not need to be modified in the future, says @CoachBigToe. Share on XSecond, when retesting, you should use the exact same protocols to allow for the most accurate comparison. That is why it is extremely important to make sure you get a valid profile the first time—that way your protocols do not need to be modified in the future.
Familiarization
Although this pertains to a prior section, including this now will make much more sense with your newly acquired information. Anecdotally, I had nine high school athletes perform two load-velocity profiles 48 hours apart. Some athletes had experience using the 1080 Sprint, while for others it was their first time.
For all variables going into and calculated from the profiles, using a paired (dependent samples) t-test, no variables were statistically significantly different from the first profile to the second besides 5-meter velocity at 10 kg (p < 0.05). The variables analyzed were 5-meter velocities at 1 kg, 5 kg, 10 kg, and 15 kg; the slope (M); max velocity (B); R2 of the regression; and predicted loads to run at 10% Vdec, 25% Vdec, and 50% Vdec. With that said, no two profiles were perfectly the same and this caused different resistances to be programmed; however, the average difference for resistances between profiles for 10% Vdec, 25% Vdec, and 50% Vdec was 0.2 kg, 0.5 kg, and 1.0 kg, respectively.
Exceptions
I have also seen many profiles that look like this where the athlete was not “peaked out” for the first two sprints, but “peaked out” for the last two (see figure 4 below). What do you do? Is it invalid? Do you add 5 more yards to the first two sprints but leave the distances for the last two next time? Probably not.
This could mean one of three things:
- They were not given enough rest and were tired for the last two sprints.
- They stopped trying for the last two sprints.
- They are better at running against light resistance and needed more distance for the first two sprints.
I believe it is important to keep the changes in resistance and distance consistent between sprints to achieve a well-rounded profile. It is important to know what a typical profile looks like, so you are aware of when you need to intervene and manage during the sprint, whether that means staying the course, instructing to remember to finish all the way through the line, etc.
Specificity
Although these concepts are universal for training and load-velocity profiling, these numbers are specific to the 1080 Sprint, my coaching style, my programming, and my athletes. You can apply all of this in your setting, but there should be a critical period when you first learn and experiment to see what YOUR numbers look like. Go experiment. Mess around with different resistances and distances and calculate the profiles for your own athletes to see where the 10% Vdec, 25% Vdec, and 50% Vdec are.
Conclusion
Load-velocity profiling on the 1080 Sprint removes the guesswork when assigning resistance, gives consistent assessment and reassessment protocols, and provides objective feedback. Capitalizing on this opportunity to individualize training will help you do your job as a coach when developing speed. Although it takes time to learn this process, the main point to remember is that all nuances and factors come back to ensuring the athlete hits their true max velocity at each resistance and sprint.
As with all sport science, do not load-velocity profile your athletes just because you can. You should have a very solid idea of how the data will directly become action, says @CoachBigToe. Share on XAs with all sport science, do not load-velocity profile your athletes just because you can. You should have a very solid idea of how the data will directly become action. The specifics can change and get sorted out later, but knowing “this profile will dictate what resistances I will use” or “this will be my main objective assessment of progress for the next X weeks based on these two variables” is incredibly more beneficial than “I want to see where my athlete is at.”
Although load-velocity profiling is an assessment tool, the same rules of coaching still apply. As soon as you hit start on the 1080 Sprint’s tablet, watch the athlete throughout the entirety of their sprint. Once that is all done, then see what the graphs and numbers say.
References
1. Cahill, Micheál. (2020, December). “A targeted approach to resisted sled training for speed development: Assess, prescribe and coach.” Track Football Consortium. https://trackfootballconsortium.com/tfc-2020/
2. Cross, MR, Brughelli M, Samozino P, Brown SR, and Morin JB. “Optimal loading for maximizing power during sled-resisted sprinting.” International Journal of Sports Physiology and Performance. 2017;12:1069-1077.
