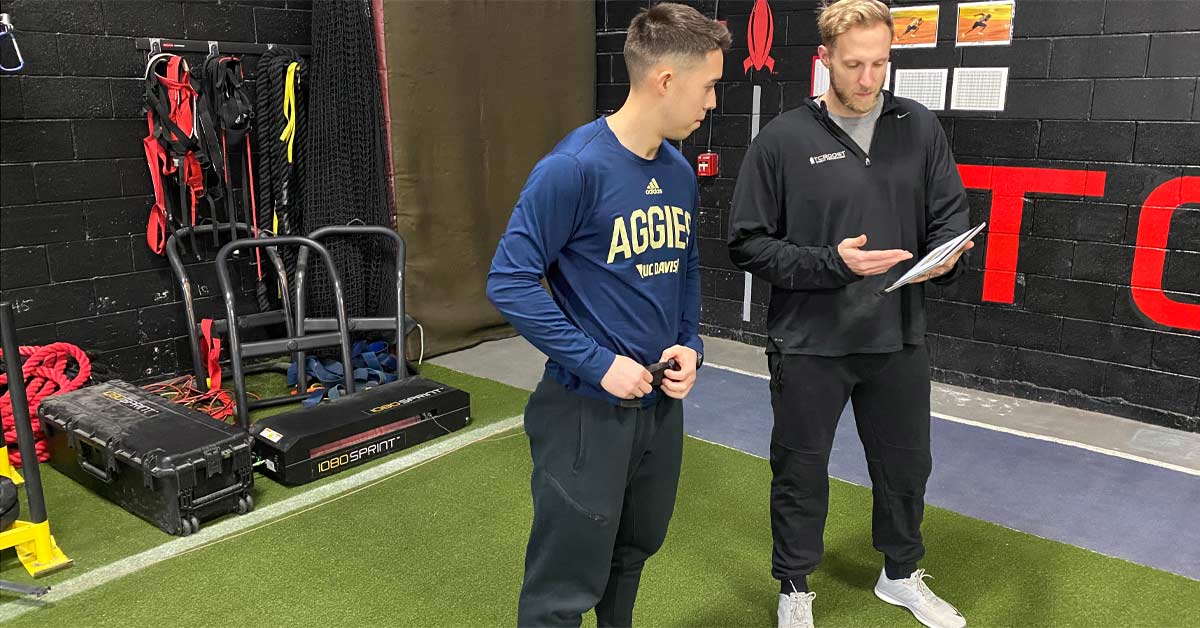
Data is pragmatic because it simply answers the question are we actually doing what we say we’re doing? Especially with the 1080 Sprint, we can directly answer are we specifically doing what we say we’re doing with our resisted sprint training? Now, that’s not to say it makes the decisions for you or takes the human coaching component out of it—you still must decide what it is you want to do, and then data comes in and supports that process of how do we make that happen?
Most sports aren’t dictated by how strong you can be—they are about how fast you can be strong. One of the biggest variables of sport is the time (or lack thereof) that constrains the movements and skills that need to be performed.
One of the biggest variables of sport is the time (or lack thereof) that constrains the movements and skills that need to be performed, says @CoachBigToe. Share on XUsing basic physics, power is force x distance all divided by time. In a post on his LinkedIn page, Matt Rhea—Director of Performance Science for University of Alabama football—shared an insight about training his football players that influenced my thought process: “Improvements in strength with a power-focused program were occurring simultaneous to power whereas power was not improving significantly with a strength-focused program.”
This makes total sense: training something not exactly as specific as power, like strength, won’t directly lead to power improvements. If we know power is relevant for sports and want to improve it, we must specifically train power. Although this referred to training power for lifting, the concept is still the same: if we say we’re training max power with our resisted sprints, are we actually doing that?
Lastly, training power must be actionable to help you do your job better as a coach. Assuming all things are equal, that your resisted sprint training is always at max effort with appropriate sets, reps, and distances, load will be the most modifiable variable and the biggest influence on speed and power. In the remainder of this article, I will answer:
- Why I compared load-velocity and load-power relationships, and what the difference between the two means for you as a coach.
- How I used the 1080 Sprint to answer, “are we actually training at max power with resisted sprints?”
- How the insights from this evaluation get turned into action for answering “how much load should we use to achieve max power?”
Resisted Sprinting
What we currently know about resisted sprint training is that max power occurs around a 50% (48%–52%) velocity decrement (Vdec) or a load used that makes the athlete sprint at half of their max speed. This came from a study1 that had athletes perform resisted sprints with increasing loads until 50% Vdec was achieved and then evaluated the force-velocity and force-power relationships. Building on that, we also know general Vdec zones and their training emphases:
- 0%–10% Vdec is the technical zone. This zone is light enough to maintain the natural rhythm and timing of sprinting while using slight resistance to draw out more effort.
- 10%–40% Vdec is the speed-strength zone. This zone is a combination of resistance and speed to develop some sprinting-specific strength while still focusing on speed.
- 40%–60% Vdec is the power zone.2 This is the optimal zone that’s heavy enough draw out maximal effort and develop sprinting-specific strength while being fast enough to still be powerful.
- 50% Vdec is about where max power is.1 This specific Vdec has been found to be the sweet spot of load and speed to maximize power in sprinting.
Load-Power Profiling
Language is important, and we should be precise about the words we choose when describing our profiles and protocols. It IS important to differentiate that force-velocity and force-power relationships were evaluated in prior research, whereas I’m evaluating load-power and load-velocity relationships. Can both profiles end up at the same answer for choosing a load for max power? Yes. Are they the exact same thing? No.
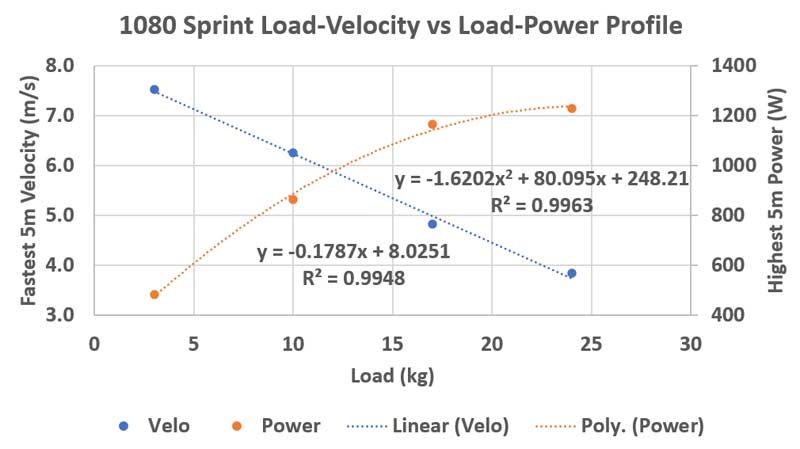
If we want to know precisely what load gives the most power for each athlete when resisted sprinting, we need to evaluate the LOAD-power relationship, says @CoachBigToe. Share on XIf we want to know precisely what load gives the most power for each athlete when resisted sprinting, we need to evaluate the LOAD-power relationship. Using the protocols outlined in this article using the 1080 Sprint, my athletes completed a series of four sprints at 35 yards, 30 yards, 25 yards, and 20 yards, each with increasing load. The set of loads (kg) were either 1/5/10/15 (beginner), 2/8/14/20 (intermediate), or 3/10/17/24 (advanced). The 1080 Sprint calculated the highest 5-meter split of both velocity and power for every sprint, and we used this to compare load-velocity and load-power relationships.
We know load and velocity have a negatively linear relationship: as load increases, velocity decreases. We also know load and power have a parabolic relationship: as load increases, power increases up to a certain point before decreasing. This means there’s a sweet spot of load that’s not too heavy and not too light that yields max power. Linear relationships have an equation that follows y = m(x) + b and parabolic relationships have an equation that follows y = a(x)^2 + b(x) + c. In this case, y is velocity sprinted and x is load. M, a, b, and c are all numbers generated by a regression individual to each profile.
Coaches can directly turn this into action by calculating the regression (equation) of each athlete’s load-power profile and working backward to determine which load yields max power. This is important because you program resisted sprints based on load, not force or velocity. With that being said, the goal of your program can be either a certain Vdec or max power, but you still have to pick a load to achieve that. Although 50% Vdec is similar to max power, load-power profiles literally answer the question “are we actually doing what we say we’re doing [training max power]?”
Protocols
At TCBoost Sports Performance, I collected resisted sprint profiles using the 1080 Sprint with 79 high school athletes, 8 college athletes, 8 post-college/professional athletes, and 1 middle school athlete. Sixty-three of these athletes were male and 33 were female. With protocols from the article I mentioned before, 82 profiles were completed on the “beginner” protocol, 4 on the “intermediate” protocol, and 10 on the “advanced” protocol. All loads, fastest 5-meter trimmed velocities, and highest 5-meter power outputs were charted on a dual-axis graph. The load-velocity data points were fitted to a linear regression and load-power data points were fitted to a second-order polynomial regression.
Forty-two percent of the profiles achieved greater than a 50% Vdec during the four sprints. It is important to note this, as 50% Vdec was achieved during all profiles in the previous study.1 Additionally, my athletes fall into a different demographic than those of the previous study (12 recreational-level mixed-sport athletes and 15 highly trained sprinters).
The resistance for 50% Vdec was calculated by solving for x with the equation 0.50b = m(x) + b. The resistance for max power from the load-power profiles was calculated by using load = -b/(2a) from the power regression equation y = a(x^2) + b(x) + c. Here’s an Excel tutorial on how to do all this.
Results: Comparing Load-Velocity to Load-Power Profiles
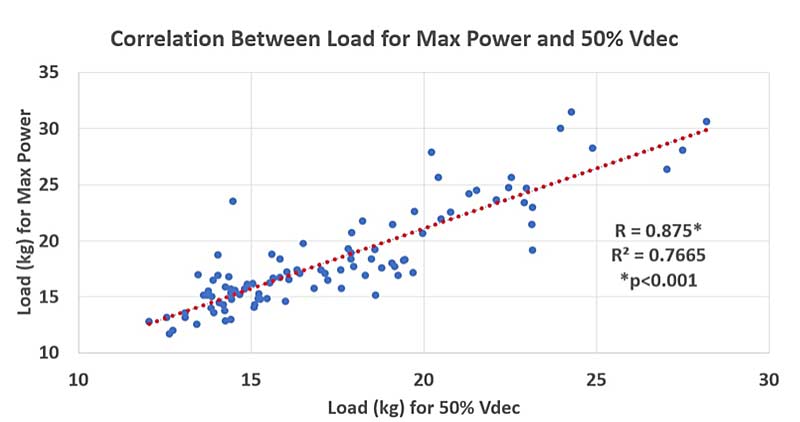
Using a paired-samples t-test, the loads needed for max power when compared to the loads needed for 50% Vdec were statistically different (p<0.001, ES = -0.417). This means a moderate difference existed between the two loads. There was a very high correlation (0.875, p<0.001) between the loads needed for max power and 50% Vdec. The correlation but statistical difference means the loads are similar but not close enough to be called the same.
The correlation but statistical difference between the loads needed for max power and those needed for 50% Vdec means they are similar but not close enough to be called the same, says @CoachBigToe. Share on XThe average “residual,” or difference between the load needed for max power and the load needed for 50% Vdec, was +0.9 ± 2.2kg. This means, on average, max power would be achieved with a load of 0.9 kg more than what would achieve 50% Vdec. With that being said, the residual had a huge standard deviation; meaning, there was a big range of overestimations and underestimations of the loads needed for max power when compared to the loads for 50% Vdec. The load for max power for 95% of profiles (two standard deviations) would fall between needing 5.3 kg more than 50% Vdec and needing 3.5 kg less than 50% Vdec. The maximum and minimum residual for max power was 9 kg more and 4 kg less than 50% Vdec, respectively, showing a lot of individual variation.
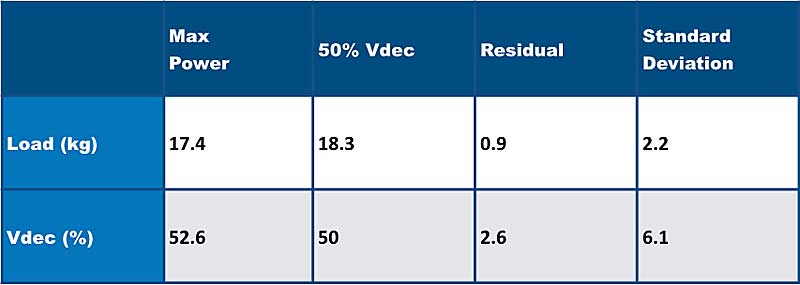
On average, 52.6% ± 6.1% Vdec was where max power was achieved, which is pretty similar to previous research. However, this came with a huge standard deviation. Ninety-five percent of the profiles (two standard deviations) had max power between 40.3% and 64.9% Vdec, with the minimum being 40.7% and the maximum being 81.2%. Again, showing a lot of individual variation.
For the sake of following protocols as illustrated in research, let’s look at just the profiles of the 40 athletes who achieved greater than a 50% Vdec during their four sprints. The average Vdec of max power was 54.2% ± 6.4% with the average load needed for max power being +1.3 kg ± 1.9 kg greater than that of 50% Vdec. Using an independent-samples t-test to compare the residuals of the profiles that achieved a 50% Vdec during their four sprints versus the profiles that did not, there was not a statistical difference (p<0.05, ES = 0.320). This means achieving 50% Vdec or not during profiling did not create a difference in the residual.
The average coefficient of determination (R2) for the 96 load-velocity profiles was 0.992 ± 0.007 and load-power profiles was 0.998 ± 0.002, showing reliable protocols. However, the correlation between the R2 of the load-velocity profiles and the R2 of the load-power profiles was low (0.372, p<0.001), meaning that a more reliable load-velocity profile didn’t necessarily mean a more reliable load-power profile.
If You Can, Create a Load-Power Profile
In summary, this data confirms, on average, the load needed for 50% Vdec is a good estimate of the load needed for max power. This has practical applications for coaches whose resisted sprint equipment doesn’t measure power, such as sleds and timing gates. However, with the 1080 Sprint and the ability to evaluate max power directly, the load needed for max power was achieved with as little as 41% Vdec and as much as 81% Vdec.
If you have the ability to measure power and want to truly individualize programming for your athletes, then create a load-power profile and calculate max power, says @CoachBigToe. Share on XEach athlete is unique and will have their own strengths and weaknesses relative to not only their sprinting ability but also their resisted sprinting ability (hence, all the variability in the data above). Thus, if you have the ability to measure power and want to truly individualize programming for your athletes and answer are we actually training max power?, then you should create a load-power profile and calculate max power.
Since you’re here…
…we have a small favor to ask. More people are reading SimpliFaster than ever, and each week we bring you compelling content from coaches, sport scientists, and physiotherapists who are devoted to building better athletes. Please take a moment to share the articles on social media, engage the authors with questions and comments below, and link to articles when appropriate if you have a blog or participate on forums of related topics. — SF
References
1. Cross, MR, Brughelli M, Samozino P, Brown SR, and Morin JB. “Optimal loading for maximizing power during sled-resisted sprinting.” International Journal of Sports Physiology and Performance. 2017;12:1069-1077.
2. Cahill, Micheál. (2020, December). “A targeted approach to resisted sled training for speed development: Assess, prescribe and coach.” Track Football Consortium.

