[mashshare]
Dr. Dan Weaving is a Lecturer in Sports Performance within the Carnegie Applied Rugby Research Centre at Leeds Beckett University and works as an applied sports scientist at Leeds Rhinos Rugby League Club. He is in his 10th year working in professional rugby league. Dr. Weaving gained his Ph.D. in 2016 and has experience working as a strength and conditioning coach, transitioning to a sports scientist with the increased use of data to support S&C practice. Alongside his applied science work, Weaving’s research interests focus on the multivariate quantification, modeling, and visualization of training load and response data, including the use of analysis techniques such as principal component analysis and partial least squares correlation analysis to help facilitate the use of data to help decision-making. He has published a number of peer-reviewed articles in this area.
Freelap USA: You have a great publication on modeling performance for the sport of rugby. In the U.S., most of the sports at best only monitor load with their athletes. Can you explain some of the complexities of trying to measure the training process?
Dan Weaving: While monitoring load is an essential aspect of measuring the training process, we can all appreciate that the true value is only achieved by understanding the relationship between load and both acute (e.g., measures of fatigue) and chronic (e.g., measures of training adaptation) outcomes.
We want to understand the dose-response for individual athletes, and as athletes will respond differently to the same load, we need to understand their own responses. However, when you start to unpack how we can measure these very broad areas of the training process, we start to see how complicated this can quickly become.
For example, if we consider the training load of an American football athlete across a single week of training, we know they undertake a lot of different modes (technical-tactical work, resistance training, speed, conditioning, etc.) that mean they complete a lot of different activities (i.e., external load—accelerations, distance, sprinting, 3×5 reps @ 70% 1RM, etc.). This will lead to different internal loads for the different physiological systems and, therefore, different accumulated fatigue responses.1
So, if we view “load” and “response,” etc. as all-encompassing terms for the training process, we can only conclude that we require different measures to represent these different aspects of “load” and different measures to represent different aspects of the “fatigue” response across the training week. However, at the moment, we collect multiple measures, but then in our modeling we try to extrapolate a single measure to represent each area (e.g., load = distance or heart rate TRIMP; fatigue = countermovement jump or heart rate variability), run multiple models, and expect to have a good understanding of the training process.
We need to move away from providing tables with lots of numbers or multiple line graphs to decision-makers who have a more limited background interpreting data than we do. Share on XMy view is that to gain a more valid model of these all-encompassing terms of load and response, we need to represent both areas with a number of variables in our models. While it is, of course, crucial to consider the reliability of the individual measures first, with developments in technology, a sports scientist in the field is still left with a number of measures that have been shown to be reliable! So how do you choose which to monitor? And how do we provide a lot of information in an understandable way to the coach? I think we need to completely move away from providing tables listing a lot of numbers or multiple line graphs to decision-makers who have a more limited background interpreting data than we do.
Freelap USA: Building on your outlined framework for load and response models, can you also highlight some of the steps/approaches to upgrade a simple monitoring program to something more sophisticated with regard to modeling?
Dan Weaving: To upgrade to a more sophisticated modeling system, we need to somehow represent the complexity of the overall training process highlighted previously, but in a way that we can communicate simply to the actual staff who design and deliver the training programs. We’ve proposed techniques such as principal component analysis to reduce multiple measures into simpler/fewer variables to represent the training process2 and as a method to evaluate which measures you could remove or keep within from your monitoring workflow3.
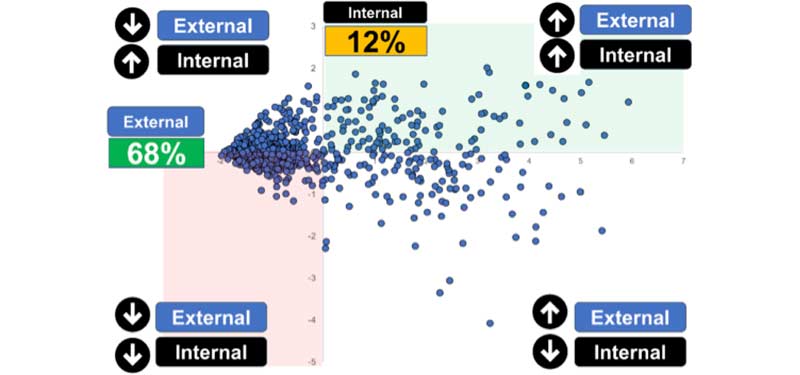
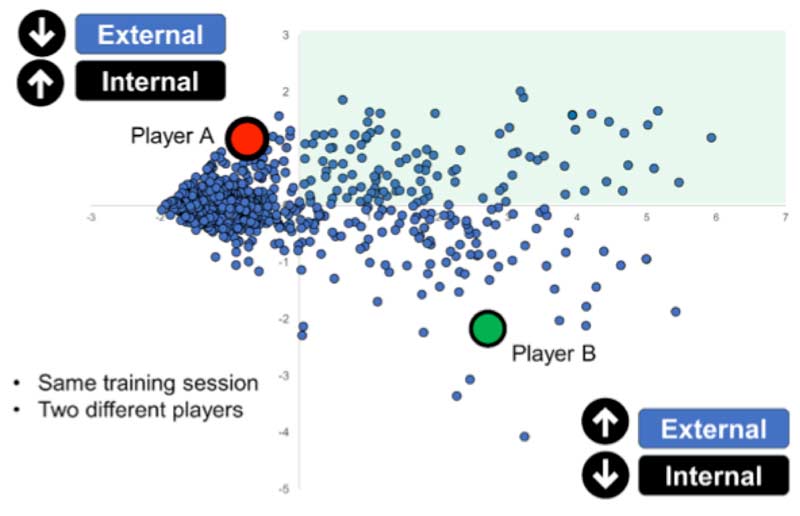
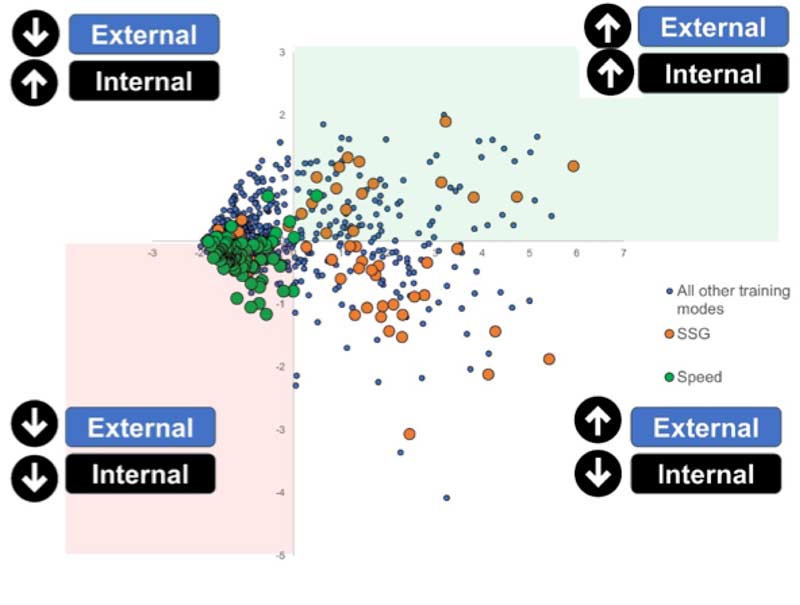
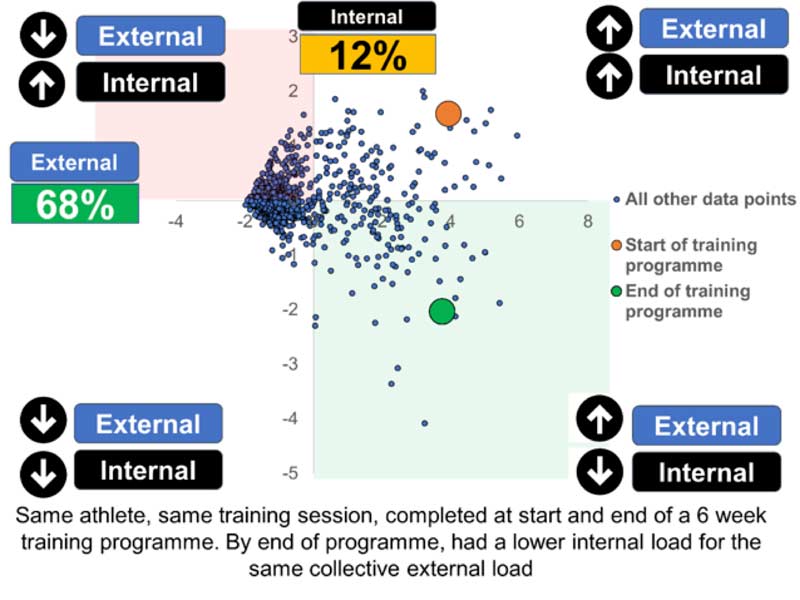
Using PCA, we’re able to condense a lot of data onto a single graph without losing much information. In this example (figure 1), we’ve reduced five training load variables (3 x microtechnology, sRPE, and heart rate) across 712 training sessions (712 * 5 = 3,560 data points) onto a single graph. By adding color coding to the data points to highlight different contexts (e.g., training types, training days, players), we can use the same data to provide us with a lot of different insights into the training process (as highlighted in the figures below).
We feel techniques like PCA can help to balance the theoretical complexity of the training process with the practical reality of avoiding data overload for the people who actually design and deliver the training in our fast-paced environments. While the math underlying PCA might be complicated, you don’t need to understand it to implement it, and there are plenty of online resources to walk you through its implementation. Plus, if your sole role is an applied sports scientist, I feel it is our duty to advance our practices in this area and actually help the people who need to benefit from our data, rather than simply paying lip service to our role (e.g., “there is no point, the coach doesn’t listen”).
Freelap USA: Collisions in rugby can complicate recovery patterns and other components of play. Now that microsensors have evolved, what can professionals in sports such as American football and ice hockey learn from your rugby research? What should contact sports learn from the science that is available?
Dan Weaving: Quantifying and understanding the response to collisions is the holy grail for contact sports such as rugby league, American football, etc. I might be biased, but I feel that rugby league has a critical mass of researchers attempting to understand this topic, from its mechanistic aspects (Mitch Naughton – University of New England4) to the relationship between collisions and fatigue responses (Chelsea Oxendale – Chester University5, Dr. Greg Roe – Bath Rugby and Leeds Beckett6) to its impact on energy expenditure (Nessan Costello – Leeds Beckett University7) to understanding the highest collision intensities of competition (Dr. Rich Johnston – Australian Catholic University, Billy Hulin – St. George Illawarra Dragons8).
An important step has been the valid automation of collision detection in rugby league9. This has allowed us to more easily quantify the collision frequencies of training and competition. We’ve recently published a study8 investigating the highest collision intensities of competition, which we found can be as high as 15 collisions (either attack or defense) in a five-minute period of the match, highlighting just how tough the match can become! This should hopefully help the design of training practices to expose players to this intensity, particularly during return to play protocols.
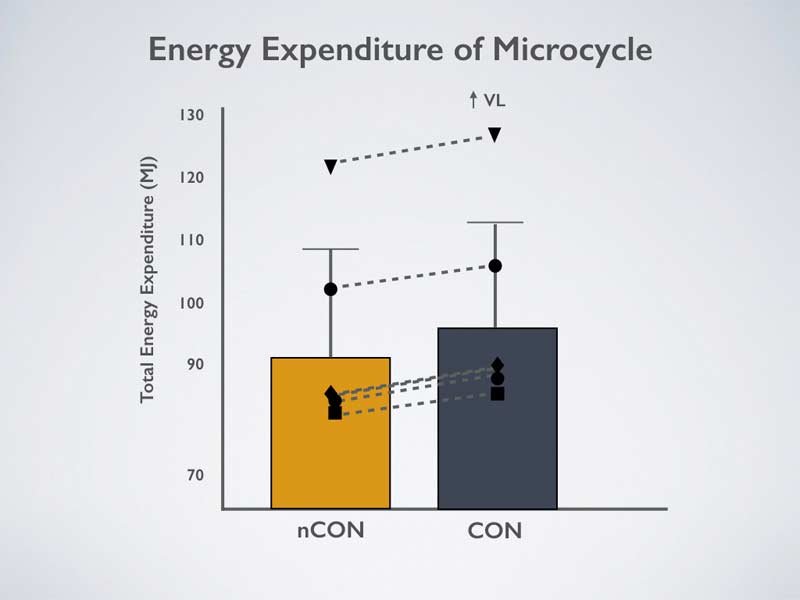
From a response point of view, work by Nessan Costello7 within the Carnegie Applied Rugby Research Centre at Leeds Beckett (led by Professor Ben Jones) has highlighted the effect of collisions on the energy expenditure of adolescent rugby league players. When matching the training week and measuring energy expenditure with the gold standard (doubly labeled water), we observed a seven-day increase in energy expenditure of ~1200 kcal when the training week included 20 match intensity collisions compared to a non-collision week (see figure 5).
Given that rugby players and American football players will likely have more than 20 collisions when training and competing, the study highlights the important nutritional considerations when working with collision athletes, and also when training periods have an elevated collision prescription during training. After all, an important element of success in collision sports is to maintain appropriate muscle mass and strength to be successful in the collision bout, and, therefore, as practitioners we really need to focus in on how that impacts the athlete’s variability in nutrition away from the organization.
In addition to collision frequency, the holy grail is to get a valid measure of collision intensity, and this is where a lot of future work should focus, says @DanWeaving. Share on XIn the future, the holy grail will be to get a valid measure of collision intensity too, and this is where I feel a lot of future work should focus. It might be that we need to integrate other technologies than GPS, etc. to provide a valid understanding of this. For example, I feel monitoring mouthguards (e.g., Prevent Biometrics) could help this by measuring head accelerations, and this is probably where American football is ahead.
Freelap USA: High-intensity work on the field is hard to monitor and even visualize. When communicating their practices to team coaches, how do you recommend strength coaches who don’t have a full-time sports scientist chart out their practices to warn them of risk? With the ACWR taking some heat now, what are other promising options to communicate workload?
Dan Weaving: I think if I was an S&C coach without a sports scientist to help me translate the data to coaches, I would focus less energy on communicating the total training load (e.g., weekly total distance/ACWR, etc.) that has no contextual relevance for the coach. Instead, I would try and communicate the data through the coach’s drill terminology and measure the training intensity that specific drills provide. For me, rather than being reactive to “spikes” in training load, you can avoid those “spikes” in the first place through better planning of technical-tactical content (which takes up the largest proportion of field-based training) by helping the coaches to understand which typical components of training load (e.g., average speed, acceleration, high-speed, sprinting) a given drill provides.
This certainly isn’t anything new, but I’ve found that the biggest barrier to achieving this is gaining a consistent classification of the training drills by the coaching staff and then achieving that consistently over time. Some coaches are meticulous with every detail, while others scribble session plans on the back of a piece of paper, never to be seen again. If you’re unfortunate to work with the latter, it can still be done. It just takes more persistence and frequent verbal communication, but I think it pays off in the long run, especially if coaches have “go-to” drills!
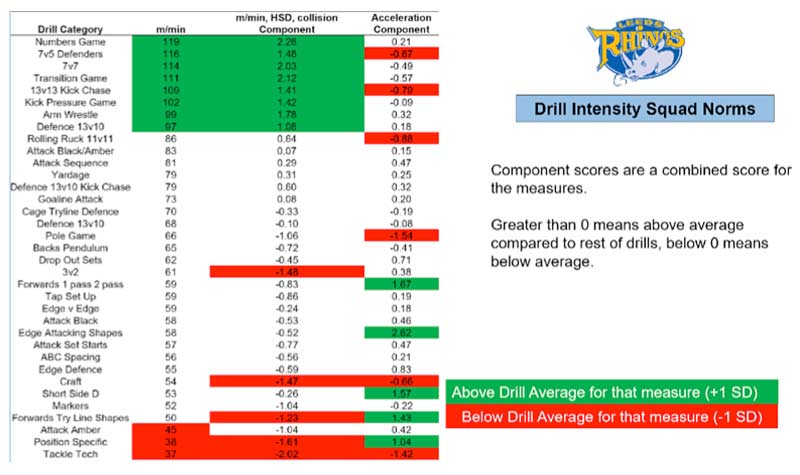
What was interesting when we took this approach over a long period of time (figure 6) was that the coaches’ “go-to” drills for high-intensity were actually genuinely high-intensity drills (e.g., numbers game, etc.), which was positive. However, the drills typically used on “low-intensity” days, while being low for m/min or high-speed work, actually possessed higher acceleration intensities (e.g., try line shapes, short side defense, etc.—figure 6). For me, this highlights two areas where this type of load monitoring is very useful, as: 1) we were potentially prescribing too high an intensity (from an acceleration POV) on the days that were planned as more recovery sessions, and 2) you can’t just rely on a single measure (e.g., m/min or acceleration) to understand the demands of your training!
Freelap USA: The balance between internal and external monitoring isn’t easy, but it paints a more complete picture than only one method of tracking. Can you share what is a good solution outside of subjective data capture for scholastic athletes ages 14–18 here in the U.S.? With the GPS systems becoming more affordable and improving with data quality, how can an athlete take care of their own monitoring without overthinking it?
Dan Weaving: Based on the work we have completed in rugby league/rugby union, team sport athletes capturing their own data can achieve a good, but simple, monitoring system by tracking three measures: the overall volume of the session (e.g., total distance), the high-intensity aspect of the session (e.g., distance > 5 m/s), and then internal response (e.g., HR TRIMP). If sprinting is a key component of your sport, adding in exposure to 95% maximal speed could potentially be useful to take that count to four measures.
Team sport athletes capturing their own data should track three measures: the overall session volume, high-intensity aspect of the session, and internal response, says @DanWeaving. Share on XAdding other measures is likely just adding redundant and less streamlined data.3 Simply tracking the total weekly load and how that changes can help with progression/regression of training volume. If the aim is to track changes in training response in a simple way, I really like the training efficiency index proposed by Dr. Jace Delaney.
Training efficiency is the relationship between your external output and your internal response and how this changes over time. If we think about it in its simplest sense, just like a car, if we use less fuel (internal load: heart rate) for the same speed (external load: distance), then this could suggest adaptation to training (e.g., better “miles to the gallon”). The value in this method is tracking the changes in efficiency over time. Dr. Delaney even provides a useful spreadsheet so that you can implement this without having to learn the underlying calculations!
Since you’re here…
…we have a small favor to ask. More people are reading SimpliFaster than ever, and each week we bring you compelling content from coaches, sport scientists, and physiotherapists who are devoted to building better athletes. Please take a moment to share the articles on social media, engage the authors with questions and comments below, and link to articles when appropriate if you have a blog or participate on forums of related topics. — SF
[mashshare]
References
1. Weaving, D., Jones, B., Till, K., Abt, G., and Beggs, C. “The case for adopting a multivariate approach to optimize training load quantification in team sports.” Frontiers in Physiology. 2017; 8: 1024.
2. Weaving, D., Beggs, C., Barron, N.D., Jones, B., and Abt, G. “Visualizing the complexity of the athlete monitoring cycle through principal component analysis.” International Journal of Sports Physiology and Performance. 2019; 1304–1310.
3. Weaving, D., Barron, N.D., Black, C., et al. “The same story or a unique novel? Within-Participant Principal Component Analysis of Training Load Measures in Professional Rugby Union Skills Training.” International Journal of Sports Physiology and Performance. 2018; 13(9): 1175–1181.
4. Naughton, M., Miller, J., and Slater, G. “Impact-Induced Muscle Damage and Contact-Sport: Aetiology, Effects on Neuromuscular Function and Recovery, and the Modulating Effects of Adaptation and Recovery Strategies.” International Journal of Sports Physiology and Performance. 2017; 13(8): 1–24.
5. Oxendale, C., Twist, C., Daniels, M., and Highton, J. “The relationship between match-play characteristics of elite rugby league and indirect markers of muscle damage.” International Journal of Sports Physiology and Performance. 2015; 11(4).
6. Roe, G., Jones, J.D., Till, K., et al. “The effect of physical contact on changes in fatigue markers following rugby union field-based training.” European Journal of Sports Science. 2017; 17(6): 647–655.
7. Costello, N., Deighton, K., Preston, T., et al. “Collision activity during training increases total energy expenditure measured via doubly labelled water.” European Journal of Applied Physiology. 2018; 118(6): 1169–1177.
8. Johnston, R.D., Weaving, D., Hulin, B., Till, K., Jones, B., and Duthie, G.M. “Peak movement and collision demands of professional rugby league competition.” Journal of Sports Sciences. 2019; 37(18): 1–8.
9. Hulin, B., Gabbett, T., Johnston, R.D., and Jenkins, D.G. “Wearable microtechnology can accurately identify collision events during professional rugby league match-play.” Journal of Science and Medicine in Sport. 2017; 20(7): 638–642.


