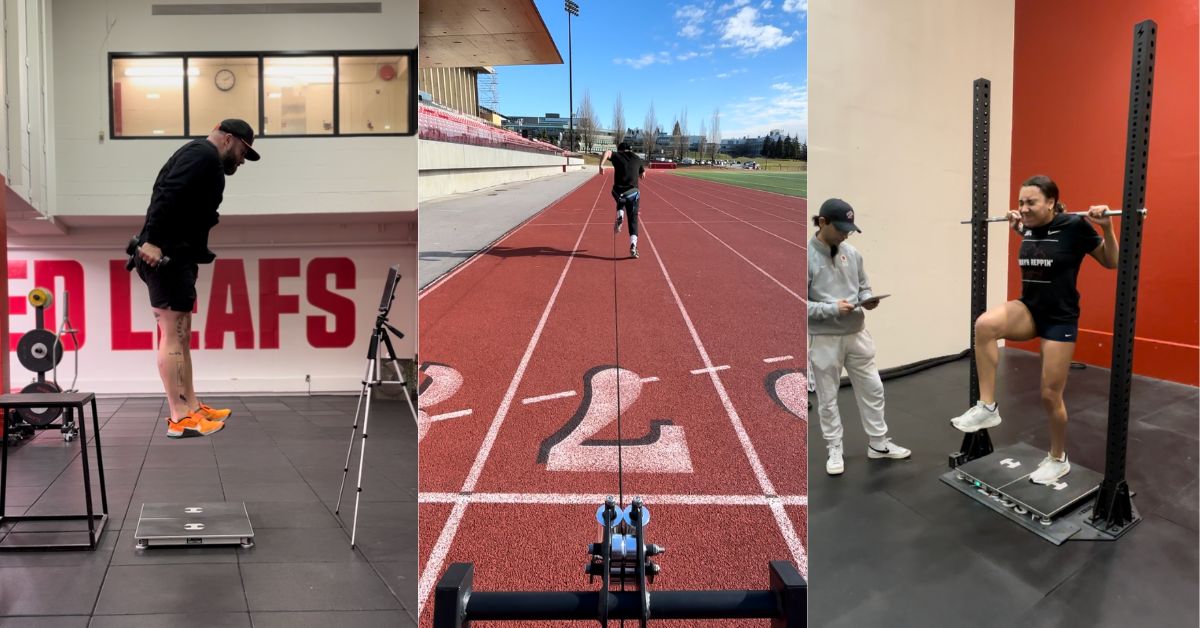
In the field of sports performance, most practitioners can agree that high-velocity sprinting is the most potent stimulus our athletes can be exposed to. However, practitioners rarely lean on speed data as a guiding principle for their weight room operations. I believe this is largely due to the complexity of speed development, the varying contexts in which speed development exists, and the lack of prioritization within the continuing strength and conditioning educational framework.
This became very apparent to me during several consultation experiences at Power 5 institutions: I witnessed practitioners hungry to move the needle while seamlessly integrating best-in-class methods for speed development, all to have their speed data fail to provide them with any real value or actionable information (outside of trends) in the weight room.
The main objective of this article is to provide practitioners with a framework for better understanding/interpreting speed data and to share how I’ve utilized speed as a guiding principle for periodization and athlete bucketing that has produced more than 30 All-Americans. This will be accomplished through an extensive overview of several bucketing methods, including:
- 10-/20-yard sprint split times.
- Run-specific isometric testing.
- Hawkin Dynamics quadrant reporting.
In total, this should provide the reader with several means to better understand and utilize speed and force plate metrics to help guide their practices.
System Development Part 1: 10/20 Model
For me, this has been a system roughly 10 years in the making. In its early inception, I utilized the 10/20 model from Cal Dietz that sought to bucket athletes based on their 5-, 10-, and 20-yard split times. While the majority of this work has been conducted on collegiate-level athletes—including sprinters, throwers, jumpers, and rugby athletes—I believe it can be applied across several other sports at the collegiate, professional, and national levels. However, while this model could benefit practitioners who work with a wide variety of athletes and sports, I advise that the model be reserved for those considered “high-performance athletes” who have maximized general physical qualities and require more specialization to receive a training effect.
The upside of this system is that the splits provide valuable insights about athletes’ physical qualities and opportunities (see specifics from Cal Dietz here). For example:
0–5 yards (strength):
- Athletes whose greatest opportunity lies within 0–5 yards lack several physical qualities in force production, and more specifically, starting strength and lower limb integrity.
- Starting strength, by definition, is: “the ability for the muscles to develop force at the beginning of a working contraction before external movement occurs.”
- Regarding lower limb integrity, I believe a lack of foot/arch strength during the first four steps in the acceleration phase can compromise sprint kinematics, increase horizontal braking forces, and result in energy leaks.
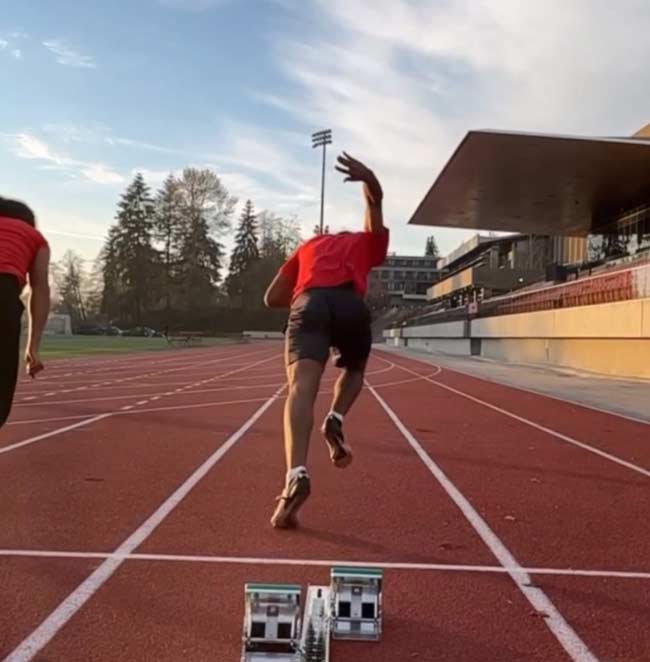
5–10 yards (power):
- Athletes whose greatest opportunities exist between 5 and 10 yards generally have several kinematic deficits during the transition segment of their sprint.
- These deficits can be successfully addressed with expression interventions that entail ballistic triple extension and rate of force development enhancement.
10–20 yards (coordination/reactivity):
- If I were to generalize to field sport athletes, this segment would entail the achievement of 80%+ max sprint speed (MSS) and, therefore, greater dependence on reactive qualities, a high capacity for eccentric forces (2–4 x BW), and coordination.
- If an athlete is deficient within this particular split, they likely need to enhance coordination and reactive qualities to clean up contact time(s), refine thigh switching, and enhance lumbopelvic posture/position (via free-elastic energy).
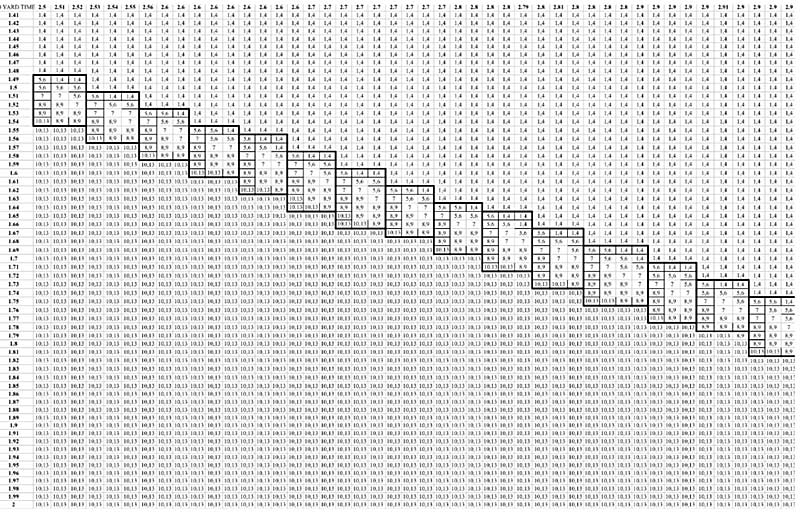
The value of the Dietz 10/20 model is that it provides practitioners with clarity on what stimuli athletes need based solely on their sprint times (see above). This is organized through 13 training zones (see below) that range from neurological adaptations to more tissue/strength adaptations. Simply put:
- Zones 1–4 are speed classifications that seek to elicit changes in the nervous system.
- Zones 5–8 are power classifications that range from speed-power to power-strength loading schemes.
- Zones 10–13 are strength-intensive classifications.
For example, if an athlete’s 10/20 split were 1.55 and 2.6, the 10/20 resource would advise that particular athlete train in Zones 8–9 (power-strength) and prescribe the constraints found in the table below:

In terms of implementation, bucketing a cohort of 20+ athletes in a room can seem like a daunting task; however, utilizing a session structure with general movements (i.e., split squat, bench, hinge) with varying constraints (such as specification, loading, or initiation) can be fairly seamless. For example, practitioners can program a session with bench, split squat, and hinge movements but have athletes abide by their respective training zones and loading parameters:
Athlete One: Zone 4 (peaking speed) – split squat – variation: banded oscillatory @ 30%
Athlete Two: Zone 8 (power-strength) – split squat – variation: split squat @ 0.65 m/s
Athlete Three: Zone 12 (supramax strength) – split squat – variation: 130% eccentric accentuated Hatfield
While this algorithm provided some excellent speed returns, I had concerns about implementing it in a block periodization manner because it neglected other training residuals. For this reason, I integrated this intervention concurrently as a means of ensuring that tissue quality was adhered to in-season, residuals were “tapped,” and every individual athlete had the opportunity to refine their specific needs.
System Development Part 2: Natera Run-Specific Isometrics
The next evolution of this system came in the form of run-specific isometrics, popularized by Alex Natera. When it comes to the refinement of physical qualities, especially in the realm of speed development, force production is not always a key indicator for the improvement of high-speed outputs.
“Strength is an expression, not a measurement.”
-
- –
The value that this joint-specific model brought to my practice was incalculable because, up to that point, I believed there was a clear gap between an evaluation like an IMTP and how my athletes could actually express their physical qualities, and these protocols confirmed it. I’ve seen All-American sprinters rank the lowest in their cohort in an IMTP while conversely ranking in the highest percentile for hip-, ankle-, and/or knee-dominant force output, impulse, and RFD.
While the IMTP is widely considered the gold standard of force evaluation in our field, I felt it wasn’t providing the whole picture.
While the IMTP is widely considered the gold standard of force evaluation in our field, I felt it wasn’t providing the whole picture, says @TannerCare. Share on XOnce I could produce normative data on my sprinters, jumpers, and throwers, patterns began to occur, opportunities to bucket athletes became more apparent, and a graduation system emerged. (See figure 3. I also touched on this graduation system in my discussion with Hunter Eisenhower and Mike Sullivan on the “Move the Needle” podcast.)
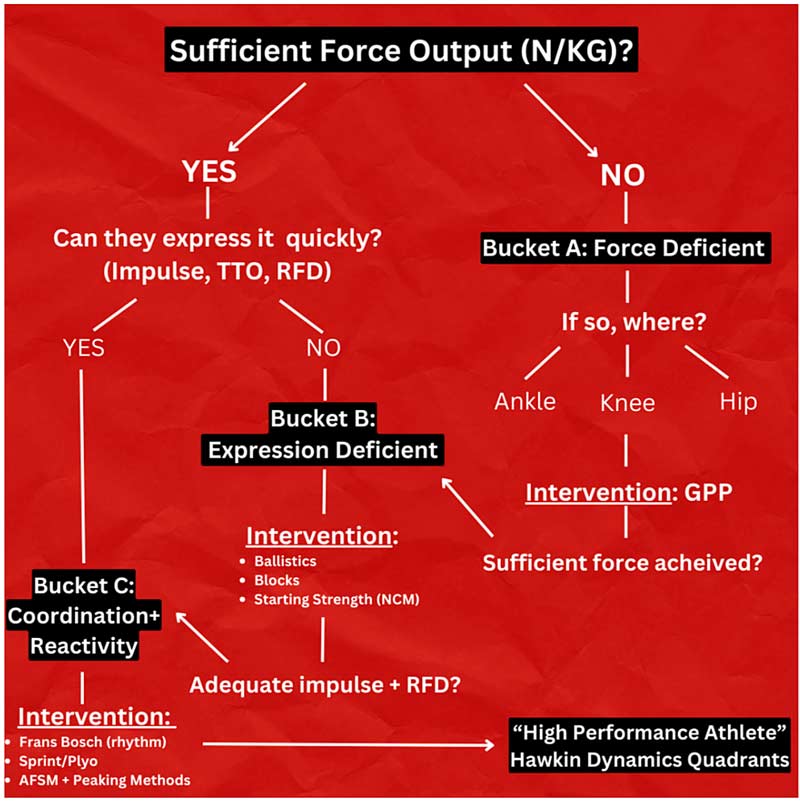
In order to provide a contextual framework within our in-season concurrent training model for readers, I typically organize my sprinters’ training week in the following way:
- Day 1: Regen (high tissue – low neuro)
- Day 2: Perform/Individual (mod neuro – mod tissue)
- Day 3: Primary CNS prep day (high neuro – low tissue)
The purpose of the day 2 “individuals” is to implement the modality in which the athlete is most deficient. While all joint isometrics are utilized concurrently, they are bucketed based on our normative data classification criteria and prioritized/organized from greatest weakness to greatest strength (keeping residuals in mind).
For example, if an athlete is deemed expression-deficient at the hip, that will take precedence in their training in the form of split-iso ballistics, followed by expression and force work at the ankle and hip.

This classification system has allowed for great ease in programming. I simply use the “tag” feature in Teambuildr to prescribe movements (such as ankle, knee, and hip isos) and have the athlete select the appropriate intervention.
Video 1. SFU Athletes Marie-Eloise Leclair, Carly Seemann, and Serena Kennedy Hailu performing iso exercises.
As a byproduct, the training block that this bucketing system was utilized in played a vital role in the improvement of key metrics such as linear sprint times and force plate CMJs, in addition to several sprinters achieving lifetime personal bests.

System Development Part 3: Hawkin Dynamics Quadrant Report Utilization
While the Natera run-specific isometrics became an essential diagnostic tool and training intervention within my practice, I needed a solution for the athletes I would deem “high-performance.” As you can imagine, these are individuals who check a lot of boxes in the realm of physical qualities that often need more specific/individualized methods of diagnostics and interventions to move the needle.
Enter Hawkin Dynamics…
One of the fantastic features that Hawkin Dynamics offers is its quadrant reports. This feature allows the user to compare metrics, scatterplot where an athlete’s opportunities are, and group athletes into four distinct categories based on the defined criteria (Hawkin Dynamics Quadrant Summary).
For context, this feature provides practitioners with immense clarity on complex athlete diagnostics by plotting athletes into quadrants off a test as simple and time efficient as a countermovement jump. In doing so, practitioners can obtain valuable insights into training needs based on the countermovement jump metrics they deem important.
Within my practice, I utilize the quadrant resource for my high-performance athletes who check the boxes of force, expression, and coordination exclusively. This is because high-performance athletes generally need more analytics and specialization to effect change and yield returns versus their developmental counterparts, who generally have a large training effect size with general preparation (GPP).
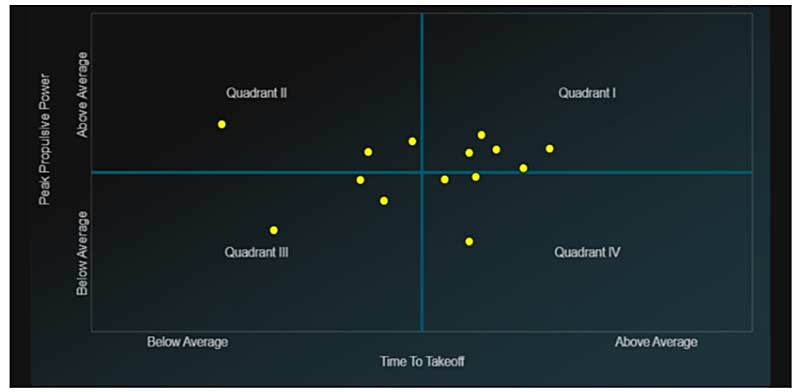
For my track and field sprinter cohort in particular, I tend to look at the ratios between peak propulsive power and time to takeoff in addition to peak propulsive force and peak braking force.
The main reason I look to quadrant those particular metrics is that I believe they provide the clearest insights into an athlete’s capacity for displacement, expression, and reactivity that generally have a large transfer to linear speed development. For example, after conducting a quadrant report on one of my All-Americans, the analysis indicated that despite being well within the top percentile among their peers, they were far below average in braking forces.
Now, while some of you may ask, “What do braking forces have to do with sprinting?” as I’ve alluded to before with lower limb integrity, your capacity to yield and amortize high forces (up to 4–6x BW) has dramatic implications on sprint kinematics.
For instance, if the lower limb cannot accommodate high forces during the acceleration phase, you will likely see more energy leaks upon the pull phase touchdown. When the foot/arch collapses/pronates due to an inability to yield high forces in steps 1–6, several common kinematic repercussions occur. These include:
- Increased ground contact time (due to collapsed arch and pronation).
- Compromised backside mechanics and lumbopelvic orientation.
- Increased horizontal braking forces due to neutral shin angle on frontside touchdown.
Similarly, if the lower limb cannot accommodate high forces during max velocity sprinting, you will see a dampening of reactive qualities, such as pre-tension/stiffness, impulse, and ground contact time, which can result in kinematic breakdowns. These include:
- Compromised backside mechanics (result of anterior pelvic tilt due to increased ground contact times).
- Loss of lumbopelvic integrity. (A lack of pre-tension prior to touchdown results in lower impulse and dampening of stance leg stiffness that causes depressed/lower hip height.)
- A dampening of free elastic qualities results in higher metabolic costs in sprinting.
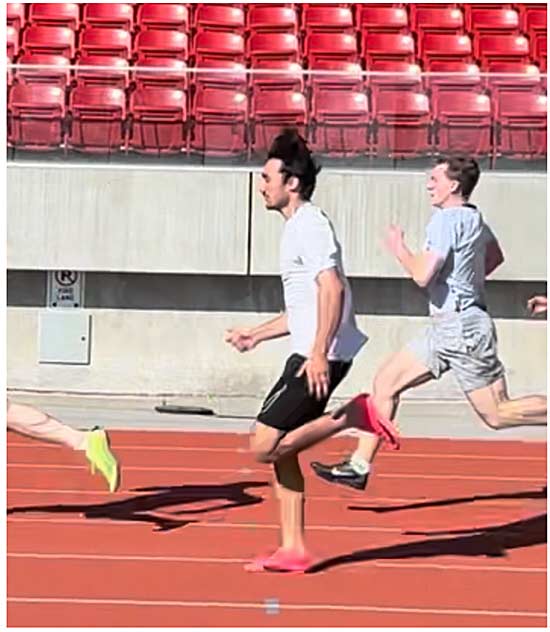
So, to answer the question, “What do braking forces have to do with sprinting?” Simply put, an athlete’s capacity to yield and amortize high-speed forces sets the ceiling for neuromuscular expression in speed.
An athlete’s capacity to yield and amortize high-speed forces sets the ceiling for neuromuscular expression in speed, says @TannerCare. Share on XNow, going back to my All-American sprinter, once the quadrant diagnostic was completed, I utilized several different methods, including high-force altitude landings (Matt Aldred – drop landings), spring ankle isometrics (Cal Dietz/Chris Korfist – spring ankle), and oscillatory work. This resulted in the athlete shifting from a Quadrant II (below-average braking force) to a Quadrant I (above average), along with a much-improved mRSI, time to takeoff, and propulsive force, which led to a huge personal best in their sprint times at the following meet.
Bringing It All Together
Now, taking the full evolution of the system into consideration (10/20, Natera run-specific isometrics, and Hawkin Dynamics quadrant reports), we now have several resources and criteria to bucket athletes as a means of enhancing linear speed performance.
This section aims to provide the reader with an organizational model to implement speed and force plate metrics to guide their operations in the weight room.
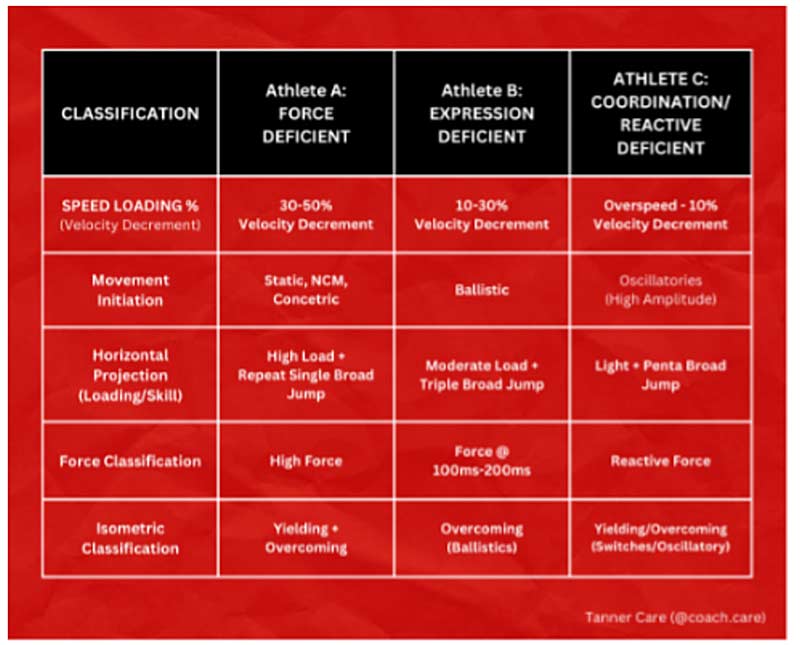
When it comes to the primary tools we use within our in-season, concurrent models for our individual and CNS prep days, I greatly value these five categories for speed-based athlete development:
1. Velocity Loading Percentage
For the development of physical qualities that transfer to linear speed, tools such as a 1080 Sprint, Zeus Rebel Pro, or simple sled/harness are staples within my program. These tools prescribe velocity detriments.
Video 2. SFU Athlete Emma Cannon performing resisted sprint training. Velocity decrement percentage is a valuable tool because it allows practitioners to be intentional with their speed/loading prescriptions to yield specific returns, says @TannerCare. Share on X
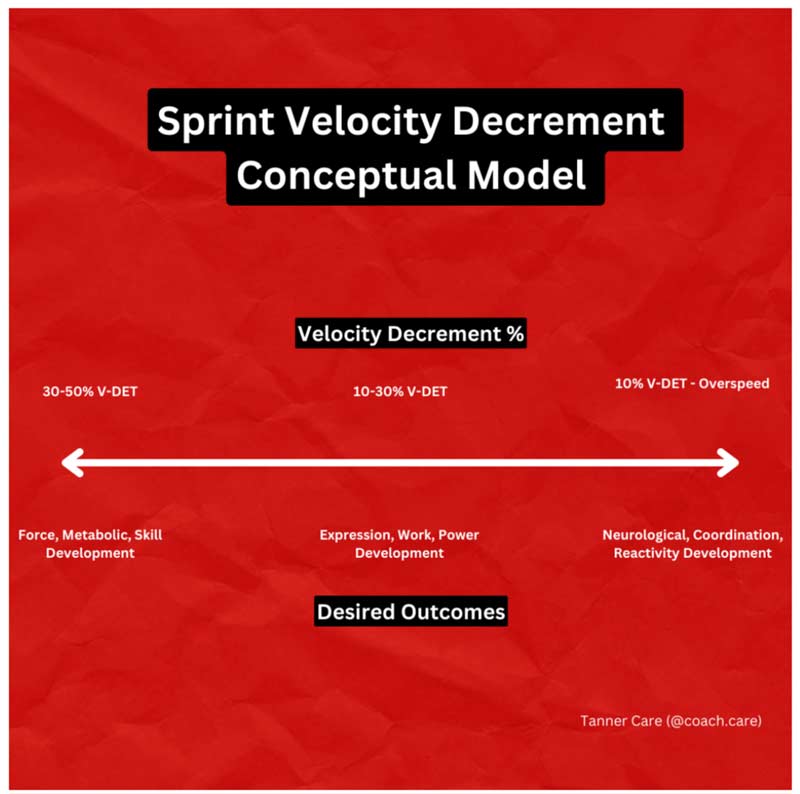
Velocity decrement percentage is a valuable tool because it allows practitioners to be intentional with their speed/loading prescriptions to yield specific returns. Prescriptions may range from qualities such as starting strength that benefit acceleration to more neurological/coordination that benefit max velocity sprinting. Moreover, it is a safe and repeatable method that practitioners can utilize at a high frequency because while the athletes’ outputs are high, we are reducing their velocities to submaximal speeds that often are too slow to risk a hamstring or other soft tissue injury.
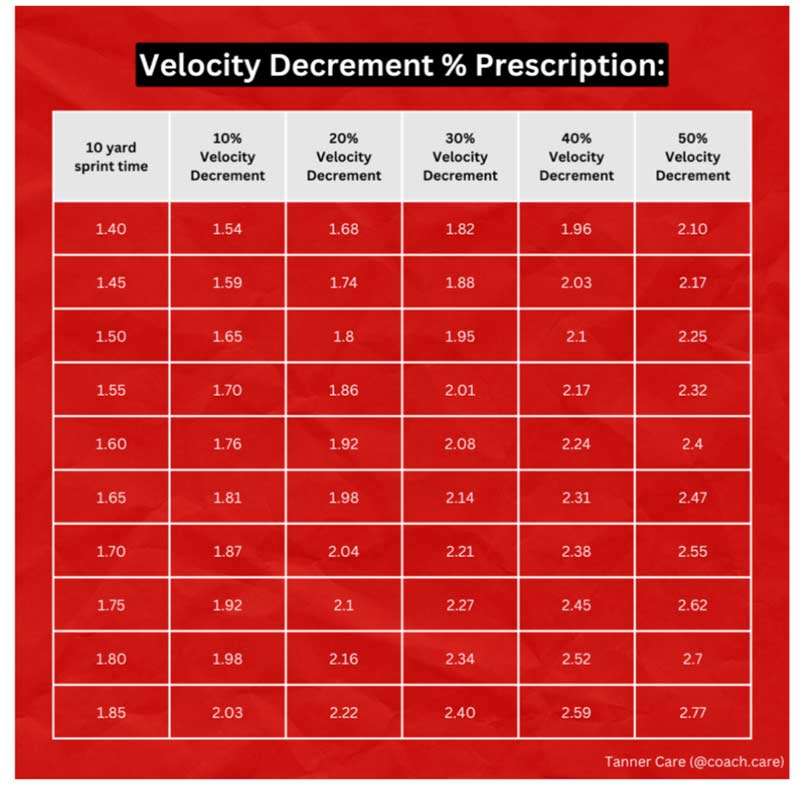
For example, if you want to use a load/sled/harness system to develop acceleration, you can prescribe a 30%–50% velocity decrement (force). If an athlete needs to improve in transition, you can prescribe a 10%–30% velocity decrement (power). If an athlete needs to improve in their max velocity qualities, you can prescribe overspeed—10% velocity decrement (coordination).
2. Movement Initiation
Another important pillar within this model is how movements are performed. When discussing periodization, the movements I select are pretty consistent throughout my in-season concurrent model, which generally coexists throughout training mesocycles—things like hip, knee, upper push/pull, sling development, plyometrics, isometrics, horizontal displacement, and distal hamstring. However, within my bucketing classifications, these movements are initiated differently for different athletes.
For example, if I have programmed a split squat on our day 2 perform/individual session, I may have three different athletes performing the same unilateral hip and knee movement, but they will have different initiations (see above). If an athlete is deemed force-deficient, they will use a non-countermovement/static split squat variation. Similarly, if an athlete is deemed expression-deficient, they will likely perform a ballistic variation such as a banded split squat countermovement jump. Lastly, if an athlete is coordination/reactive deficient, they will perform an oscillatory split squat variation (see below).
Video 3. Split squats by SFU Athletes Haley Dewalle, Marie-Eloise Leclar, and Emma Cannon.
3.Horizontal Projection
Sprint, jump, bound—these staples should exist in all programs, regardless of sport. Within my particular practice, I utilize a harness system (Zeus Rebel Pro) to modify the initiation and stimuli received by each bucket of athletes for three exercises in particular:
- Sprinting
- Straight leg bounds/primetimes
- Broad jump variations
For example, if an athlete is deemed force deficient, I will have them perform high-load repeat single broad jumps; in doing so, I provide a necessary constraint to get them into favorable shapes (shins parallel to the floor) to optimize horizontal displacement and express high force without energy leaks.
Similarly, if an athlete is deemed expression deficient, I will have them perform moderate-load triple broad jumps, as these individuals need to produce the large forces they can generate FASTER and with strategies that favor a more expansive and ascending hip orientation.
Lastly, if an athlete is deemed coordination/reactive deficient, I will have them perform low-load penta jumps, as these individuals need to enhance their reactive qualities (such as reducing ground contact times) and ability to self-organize efficiently. For this reason, I will load them enough to get the shapes I want; however, I get the intent I want by having these athletes perform these five jumps in a timed sequence (i.e., how fast they can perform the five jumps + the distance they cover).
Similar movements, different intentions, and desired adaptations.
Video 4. SFU Athlete Caysen McDiarmid performs low-load penta jumps.
4. Force Classification
Within this conceptual model, there are several different force classifications that I bucket athletes into based on speed and force plate numbers.
Side note: If you’re trying to improve your understanding of the different variations and interventions in force classifications, I highly recommend checking out my friend Hunter Eisenhower’s article.
As I’ve mentioned before, max force output doesn’t necessarily transfer to high-speed linear sprinting. Within Division II NCAA athletics, I regularly see high outputs (such as 59N/kg IMTP, 11.5 m/s peak velo, 14,000N forces), but often, these athletes have deficits elsewhere and generally need assistance putting it together.
Within this conceptual model, athletes will either:
- Yield high forces (altitude drops, supramaximal Loading)
- Produce force fast (ballistics peak force @ 100–200 m/s, blocks, Olympic lifting derivatives)
- Amplify forces (reflexive trimetrics, oscillatories, AFSM, Frans Bosch)
5. Isometric Classification
Lastly, I tend to vertically integrate isometrics concurrently within my practice, meaning everything exists synchronistically but is prioritized differently to fit our athlete bucketing criteria.
Video 5. SFU Athlete Olivia Windbiel performs isometric exercises.
What does this mean in application? Well, I typically program general movements (global, hip, knee, ankle); however, once our student-athletes are bucketed into force, expression, and coordination/reactive groups, the initiation will vary.
Maximize the Potential of Speed Data
This article should serve as a valuable resource for practitioners by shedding light on effectively utilizing speed and force plate metrics to enhance decision-making and programming. Within the realm of sports performance, the recognized potency of high-velocity sprinting often fails to translate into practical application in weight room operations. However, through a comprehensive review of bucketing methods such as the Dietz 10/20 algorithm, the Natera run-specific isometrics, and the Hawkin Dynamics quadrant report, this article equips practitioners with actionable insights.
The recognized potency of high-velocity sprinting often fails to translate into practical application in weight room operations. These strategies help change that, says @TannerCare. Share on XBy offering a framework for understanding and interpreting speed data, coupled with strategies for integrating force plate metrics, practitioners are empowered to make informed decisions that drive athlete performance to new heights. As the sports performance landscape continues to evolve, this resource paves the way for practitioners to maximize the potential of speed data, thereby unlocking opportunities for innovation and excellence in athlete development.
Since you’re here…
…we have a small favor to ask. More people are reading SimpliFaster than ever, and each week we bring you compelling content from coaches, sport scientists, and physiotherapists who are devoted to building better athletes. Please take a moment to share the articles on social media, engage the authors with questions and comments below, and link to articles when appropriate if you have a blog or participate on forums of related topics. — SF

