Dos and Don’ts of Data Collection in College Football
In this Article
- Do Not Claim and Post Football Players Running Over 23 MPH
- Do Use MPH to Drive Effort and Competition
- Do Not Claim That You Prevent Injuries
- Do Check Your Data and Information for Accuracy
- Do Not Give Coaches Complicated Material
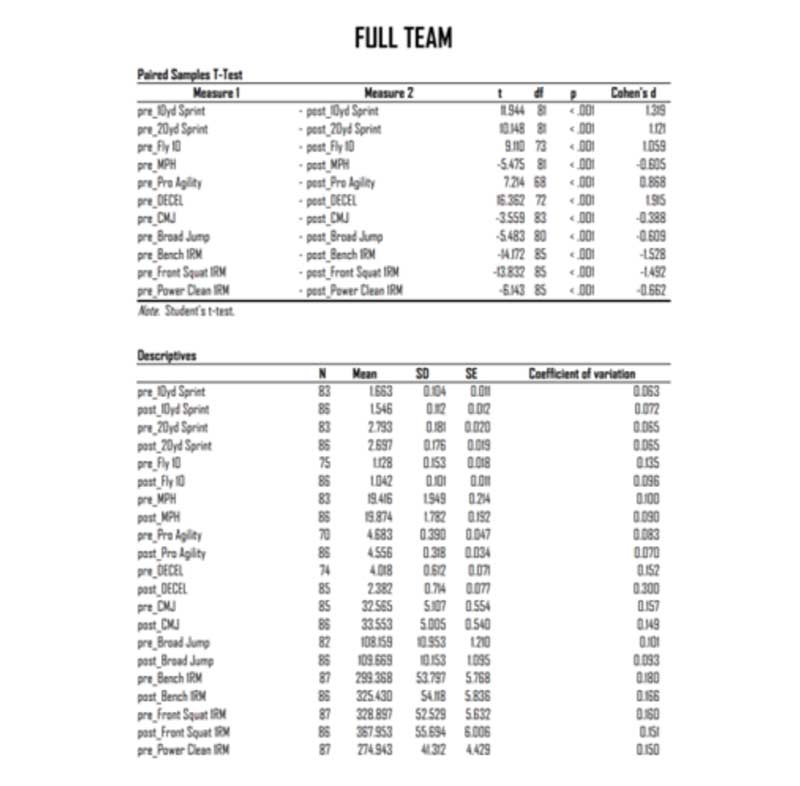
- Do Run Real Statistics on Your Testing Data
- Do Not Just Use Player Load and Yardage to Determine Load
- Do Track and Monitor Decelerations
- Do Not Just Buy Into One Model
- References

Summary
The growth of sports technology and resulting data has enabled coaches to make better-informed decisions for their athletes. But it’s also brought with it an overwhelming amount of information. Coach Joey Guarascio and Director of Sports Science Dr. Chad Herring help you sort out the wheat from the chaff when it comes to the dos…
By Joey Guarascio and Chad Herring
Information is money! The more info coaches have, the more better-informed decisions they can make. Coaches, like everyone, are living in an information-saturated era, which can be overwhelming at times. It’s hard to have tunnel vision on any specific topic when there are 10 new tabs of research articles open on your computer, a podcast of the next guru on pause, and the book you just ordered on your desk—not to mention Twitter, which has more opinions than any one coach can sift through. I have been that coach who feels the anxiety of the learning process because, at the end of the day, we coaches only have enough room to mentally digest a certain amount of info.
The current surge in sports technology has afforded strength and conditioning coaches many positive breakthroughs in training and has also given us a concrete way to validate that the prescribed training is working. Prior to this explosion of technology, S&C coaches were handcuffed to qualitative assessments such as how “tough” a team was with really no way to judge this outside of competition results.
The growth of technology, though, has also brought with it an abundance of data, leaving many S&C programs without a concrete plan on what to do with all these numbers. Enter the sport scientist. While many S&C programs simply assign sport science responsibilities to one of their staff members, a true “sport scientist” is educated and dedicated to “the study of sport using scientific methods of inquiry in the fields of human performance, athletic endeavor, and sporting competition”1 (p. 36). The sport scientist does this by collecting, organizing, and analyzing data in order to make better-informed decisions, with the ultimate goal of maximizing performance in competition.
The effectiveness of an S&C program can now be evaluated through the ability of the sport scientist to supply actual data-driven feedback. Using real analysis, the sport scientist can determine the impact of the strength and conditioning coach’s programming on performance metrics and injury resiliency. No longer are S&C coaches writing programs and guessing that what they prescribed is working—this recent tidal wave of data leads to more accurate and progressive training regimens.
Time is our most critical asset, and data saturation can waste crucial time if coaches collect data purely for data’s sake. The information that we collect must be actionable and usable. Share on XAlthough there are many benefits to this new flood of technology and information, it’s not all positive. The strength and conditioning profession, at least from my viewpoint, is seeing a rise in unskilled and uncharismatic coaches on the floor. At the end of the day, it is a person-to-person profession, so soft skills like personality, relatability, likability, and integrity are necessary. Understanding how to create macros in Excel is a valuable skill, but it will not increase the ability to coach a sprint or connect with a player and should always remain secondary to the purpose of the job. Time is our most critical asset, and data saturation can waste crucial time if coaches collect data purely for data’s sake. The information that we collect must be actionable and usable.
This article is a case study of my tenures as Head Strength and Conditioning Coach at Colorado State (CSU) and Florida Atlantic (FAU) and how in both positions we used technology and the accumulation of data to create action plans—and how, in many cases, we wasted a bunch of time. Everything written in this article was either a breakthrough or more frequently a great idea on paper that turned into a mistake made entirely by me. From claiming that we had four guys over 23 mph to showing my coach fancy graphs, I have made every mistake with data that you can imagine.
Using these successes—and in many cases, glaring failures—I can share these experiences to provide wisdom as it pertains to using data with more success in the Division 1 football environment. This is a dual-authored article, as my Director of Sports Science, Dr. Chad Herring, contributed to these “do’s and don’ts” of data collection and GPS usage.
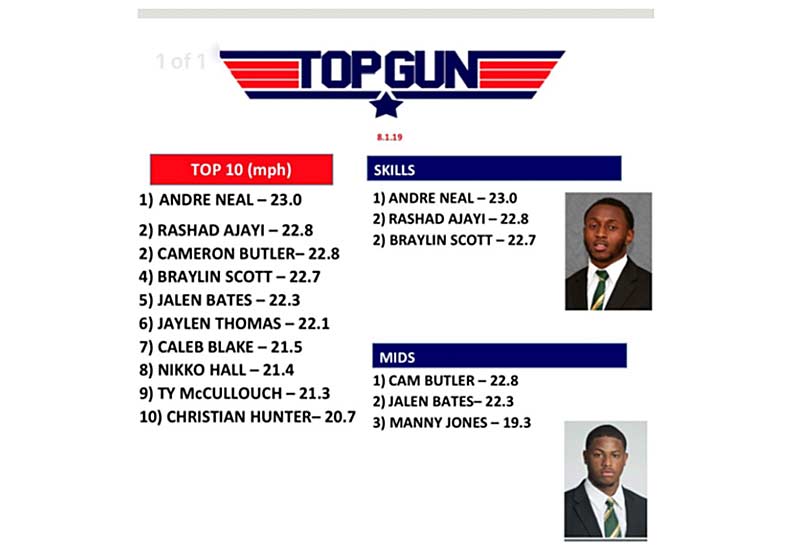
Do Not Claim and Post Football Players Running Over 23 MPH
Every strength and conditioning coach wants to have a player who is elite in some performance metric, whether it is the 600-pound squat, the 400-pound clean, or the player that runs 21+ mph. The problem with this is threefold:
- It only satisfies the coach’s desires.
- Accuracy or technique most often gets thrown out the window.
- A lot of times it does not have much significance for the win/loss column.
Speaking from experience as the coach who has posted, for a lack of a better term, bullshit numbers early in my career without validation or filtering out inaccuracies, it only backfires when your 24-mph guy runs 4.6 at Pro Day.
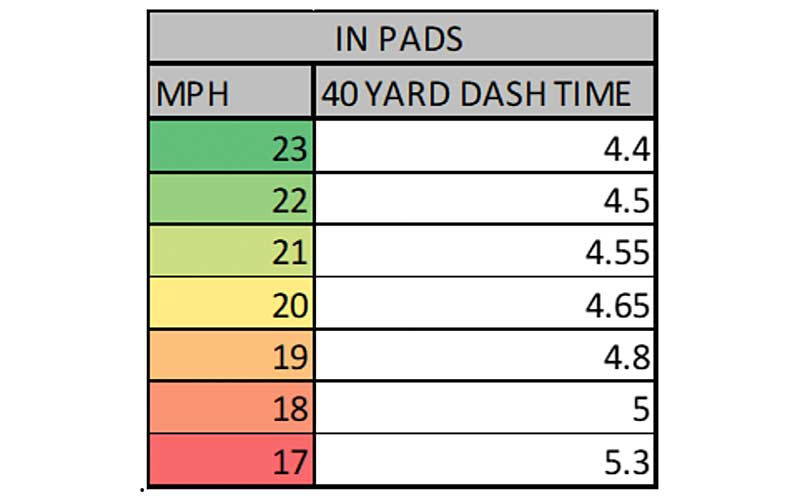
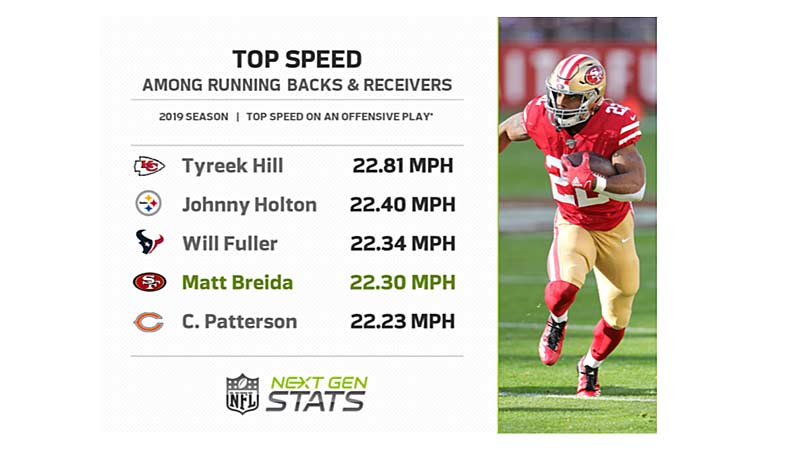
The fastest guys at the highest level of football rarely run over 21 mph. Not to discredit all players out there, but hitting 23 mph in a game with the ball is a “once-in-a-season” event for the entire nation. There is a rise in speed training at the college level, but having 20+ players over the 22-mph mark would be insane.
When all else fails, use common sense…if the movie Terminator taught us anything, it’s not to blindly trust the machines, says @CoachJoeyG. Share on XGPS is not always accurate, as we have seen fluctuations at times due to the earth’s orbit or plane interference. Video overlap and analysis of acceleration graphs should paint a better picture. When all else fails, use common sense: if a player hits 23 in a game and runs a 1.03 fly 10, well, as much as we would love to state that player super-comped in the game, it’s probably just an error. If the movie Terminator taught us anything, it’s not to blindly trust the machines.
Do Use MPH to Drive Effort and Competition
There are few things more effective for motivation and producing higher levels of effort than challenging a group of football players to see who’s the fastest. Coaches relentlessly strive to create motivation and garner better efforts from players—personally, the most effective way I’ve seen to motivate players is with Tony Holler’s Record, Rank, and Publish method.
Being at the bottom of the rankings, no matter what the metric, always produces higher effort out of that bottom group. As a competitor, something about seeing your name last just burns a hole in you. For our skill players, one way to rank and compare them is by listing the top mph of the day and rewarding the top guys with distinction at the next team meeting.
The beauty of having data and technology is that you can give quantitative reinforcement to training enhancements and make sure that the retention of these new abilities is kept. We know when a player breaks an mph record in practice or hits a peak deceleration personal record. The ability to reassure that what we train is improving is one of the best motivators and drastically increases buy-in.
The beauty of having data and technology is that you can give quantitative reinforcement to training enhancements and make sure that the retention of these new abilities is kept, says @CoachJoeyG. Share on XWe use a blowhorn at practice for 20-mph runs, and when the horn goes off, the entire strength staff drops down and does 20 push-ups. This entices the players to give better effort, and they seek that reward of being acknowledged for superior effort on the field; plus, it’s a great way to give your strength staff a pump—especially during kick-off period.
Do Not Claim That You Prevent Injuries
Stop claiming that your data prevents injuries—just stop! No one can prevent an injury. We can build robust and strong athletes who can tolerate stress and load. We can increase the technical proficiency of the position. We can make extremely informed decisions about training that provide safe load prescriptions and yardages. But even with all that, athletes will still get hurt—it’s part of the sport.
Strength and conditioning coaches, alongside sport scientists, have been able to help sport coaches mitigate many potential scenarios where athletes can get hurt, but it is impossible to erase the danger of injury. This is the reason every athlete signs liability waivers: injuries happen. Good training, paired with sound progressions for practice, can make an enormous difference in how long that injury report is. The advantage of modernizing practices and training methods is we have seen a sharp decrease in “self-inflicted” injuries, meaning injuries related to overuse.
The entire high-performance unit, including the S&C, sport science, and sports medicine departments, has a duty to reduce the risk of athlete injuries as best as they can. However, as mentioned above, the only way to truly eliminate the risk of injury is to have athletes stay in bed all day and never train or compete in their sport (still risking bed sores in this scenario).
On top of training, following the basic principles of specificity, overload, and progression, there are various ways in which the S&C coach and sport scientist can reduce the risk of injury. While the list of methods to mitigate injury is extensive, examples include:
- An in-depth needs analysis of the sport, position, competition level, etc. to ensure athletes are training with the proper intensities and volumes.
- Staying on top of the latest literature surrounding various movements and injury mechanisms in the respective sport.
- Performing injury and training program audits.
- Workload monitoring (a term that’s gotten a bad rep but can be effective when utilized properly).
Do Check Your Data and Information for Accuracy
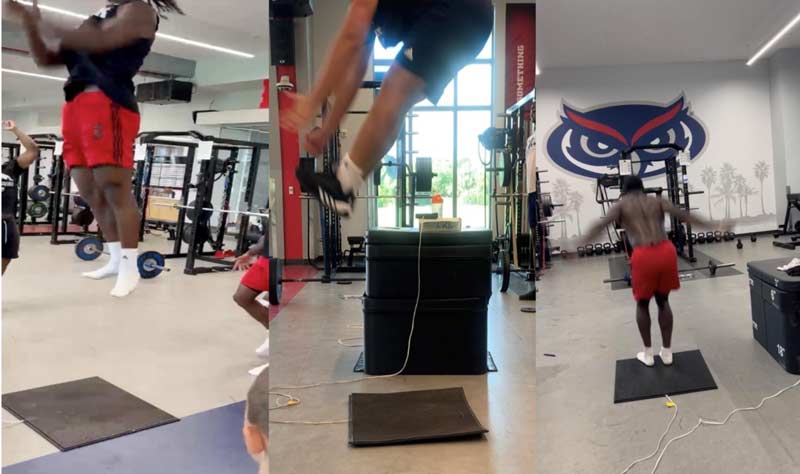
Although we have certain technologies that upload data directly into the cloud, we also have several assessments that we record manually, such as vertical jumps and various sprint/decel/change-of-direction drills.
An easy accuracy check to begin with is sorting the data from high to low. A vertical jump of 28 inches can easily be input as 82 inches. While we obviously try to avoid these errors, this is not uncommon and can be easily corrected by referencing our data collection sheets. We also follow the sorting method using our GPS data. I’ve seen max velocity values over 25, 30, and even 100 mph. Although I’d love to claim how effective our speed training is in improving an athlete to more than 100 mph and call myself Dr. Speed, any max velocity over 24 mph is immediately removed from the report.
Where checking for data accuracy starts to get more difficult is for values that are not outside the realm of possibility. For instance, while I don’t doubt that several practitioners have seen vertical jump improvements of multiple inches when assessments are performed several weeks apart, an improvement of this magnitude in our setting in which we jump multiple times a week is unlikely. An easy accuracy check to combat this issue is to create recording sheets with previous personal bests to immediately compare values. If an athlete’s previous personal best was 31 inches, and he jumped a 37 out of nowhere, a simple “accuracy” check is to ask the athlete to jump again. If he jumps 30 or 31 inches on this re-jump, there’s a high likelihood of inaccuracy for whatever reason, and so we’d simply disregard the 37 inches.
Where checking for data accuracy starts to get more difficult is for values that are not outside the realm of possibility, says @CoachJoeyG. Share on XThis may be due to the technology, or it may be due to an inaccurate jumping technique. For instance, using Just Jump mats, I’ve seen my fair share of athletes pike in the air or bend their knees upon landing to increase flight time, and consequently, jump height. Although there’s a level of subjectivity here, practitioners should do their best to follow strict protocols in order to collect accurate data.
Regarding GPS data, our first check when an athlete hits over 20 mph is to see who that athlete is. As athletic as some of our offensive linemen are, I doubt the accuracy of any of them running more than 20 mph during practice or in a game, and I would consequently flag this data point.
In situations where there is a possibility of the athlete running that fast, we go back and look at prior assessments. Has this athlete run over 20 mph before on multiple occasions using the same GPS technology? If so, I can be fairly confident that this velocity is accurate.
In situations in which an athlete is new to wearing GPS technology, we can go back and look at prior assessments. Did this athlete run a fly 10 of 0.93 seconds this past summer? If so, a max velocity of over 20 mph in pads seems likely. A fly 10 of 1.15 seconds without pads on? That’s not so likely.
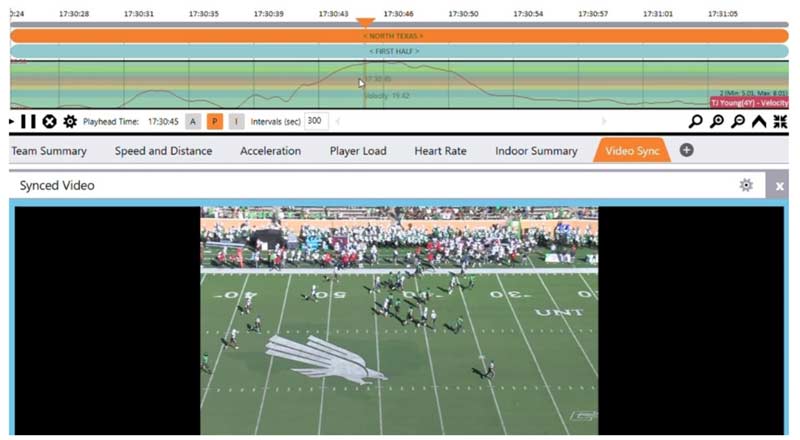
Another accuracy check using GPS is to use video overlap. By accurately tracking periods, quarters, halves, etc., we can check when a spike in max velocity occurred. With the help of our Video Coordinator, we can obtain a clip of this play, overlap this video with the graph of the athlete’s velocity, and determine with a high level of confidence if the athlete hit that max velocity or not. Did the 21 mph occur when the athlete was jogging to the numbers during a media timeout? Likely an inaccuracy. Did the 21 mph occur fractions of a second after an interception as the athlete was trying to outrun the pursuit angle of the quarterback? High level of confidence that this was an accurate max velocity.
Furthermore, an accuracy check I’ve personally begun using this semester has been to measure max velocity alongside max acceleration and max deceleration. Did we see a max velocity of 22 mph at the same instantaneous time we saw a 9.05 m/s max acceleration and a -9.63 m/s max deceleration? If so, there’s a high likelihood of an inaccuracy somewhere along the data-signaling pathway, consequently causing me to flag the data.
Do Not Give Coaches Complicated Material
In 2014, I landed an assistant spot at the University of Mississippi under Paul Jackson. Up until this position, I had only worked at small schools with limited resources. The fanciest piece of equipment I had worked with was Pandora Plus (seriously).
Coach Jackson has an extremely organized outline of each assistant’s specific responsibilities that aid the department, giving autonomy and ownership outside of on-the-floor or on-field coaching. I was in search of my specific responsibility when, one day, I was appointed to the role of Tech Guy. Mind you, I had never in my young career used any tech nor did I have any knowledge of the technology afforded to us.
For young coaches, the lesson in this story is this: Whatever role you are given, dive in headfirst and don’t be timid. Find the leading experts in the field and beg them for time and wisdom. Become an expert after thoroughly experimenting and researching whatever niche is afforded you.
We ended up purchasing Zephyr accelerometers and GPS units. I was so excited the first time we strapped them on, but then came the realization…what now? I was so happy that I could turn the systems on that I didn’t even think of the most important part, which is interpreting the data and recommending interventions.
I figured out how to print out a report, which was about 30 metrics on an Excel sheet in chart form, and I handed it to Coach Jackson. He looked at me and asked what it meant. Immediately, I understood that I had a steep mountain to climb. Thankfully, I found great mentors like Ted Lambrinides and then tracked down the work of Tim Gabbett and Fergus Connelly.
Eight years later, I’m still no expert, but I can use the data for actionable interventions. I can also interpret it for our coaches to aid in athletic performance. Complexity and an impatient world do not mix.
Sport coaches are experts in their sport, not in sport science. They need information that matters. They don’t need how many times the running back turned left or their average acceleration. They need to know how their guys or girls are doing. Not only do they want to know how these athletes are doing, but if they aren’t doing great, what are some recommendations to fix the problem?
The coaches I have worked for have never asked for fancy graphs or predictive Excel sheets; they need actionable information, and they need it ASAP, says @CoachJoeyG. Share on XThe coaches I have worked for have never asked for fancy graphs or predictive Excel sheets; they need actionable information, and they need it ASAP. The reports I have made in the past took many hours to create and had fancy functions but didn’t inform the coaches in a way that affected planning. I felt like I was rewriting Supertraining with how intelligent I would be perceived by the coaches, but they couldn’t understand it and became deaf to the information.
To date, the most effective system we’ve managed to steal is a labeling model using simple green, yellow, and red colors. Pick the five most important metrics that apply to your circumstances. For us here at FAU, when analyzing practice, our five are:
- High-Speed Distance (skill—WR/DB/RB/TE)/Collisions (bigs—OL/DL/LB)
- Total Distance
- High-Intensity Accelerations/Decels
- Body Weight
- RPE (Rate of Perceived Exertion)
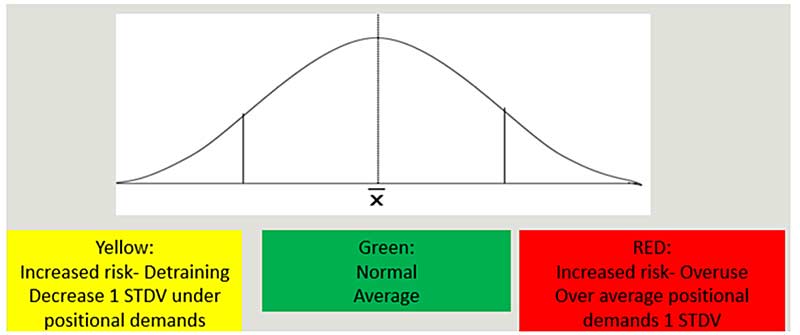
If the athletes are one standard deviation above their average in more than three metrics, they are categorized in the red. This means that the athlete is being chronically or acutely stressed past their average load tolerance to where they run the risk of being injured. If the athlete is close to their average, they are in the green category, meaning we are in the sweet spot for that specific training period. If an athlete is below by one standard deviation, we categorize them as yellow, which means that they are detraining and need an appropriate stimulus once we start to reach the end of the residual period of that capacity.
Coaches get a list of guys that are in each category, with a brief explanation of why and solutions to the existing problems, and that’s it! The main questions to ask are: Is it efficient and Does it work in aiding change?
Do Run Real Statistics on Your Testing Data
Every S&C coach wants their program to work. We want kids bigger, stronger, and faster. For a lot of coaches, this is their driving force and passion. Their self-worth hinges upon positive results. Sometimes, the program written does not yield the results that coaches want, or even causes maladaptation and negative results from training.
The human body is extremely complex. It is made up of many different biological systems that all respond differently, with different recovery rates. Add in the daily stressors of life, and that makes it extremely hard to guarantee an outcome of all positive results. No one wants to be wrong, especially in the ego-driven world of coaching, but it’s not about how you feel—it’s about how to make the athlete better.
Every coach should audit their program systematically throughout the training calendar. Coaches need insight into the rate and significance of positive and negative in the performance metrics. Trends always emerge, and it’s on the coaches to spot these trends to either provide alterations if they are negative or continue on the path provided if they are positive.
Do Not Just Use Player Load and Yardage to Determine Load
While we track both player load and yardage during training, practices, and games, practitioners should understand that these metrics are volume metrics. Because intensity is the driver for adaptations in the body, we place an equal, if not slightly greater, emphasis on intensity metrics, such as:
- High-speed yardage
- Hard acceleration and deceleration efforts
- Inertial movement analysis (IMA)
- Impacts
Since the ultimate goal is to adequately prepare athletes for competition, practitioners should work backward from the game to perform a needs analysis for their athletes. By doing so, the performance staff can adequately track both volume and intensity over time, ensuring there is a balance between the two and flagging athletes who exceed specific thresholds.
While we flag both volume and intensity metrics in our program, the majority of our athletes are affected to a greater degree by intensity metrics as compared to volume metrics, both subjectively using RPEs and objectively using vertical jumps. For instance, we have some skill athletes who can regularly exceed 7,000 yards in a practice without much detriment to their central or peripheral nervous systems, while the same athletes struggle following a day with 300 high-speed yards and/or a player load of greater than 600.
Density is a metric that GPS technology can easily track or calculate, and it should be included in regular athlete monitoring, says @CoachJoeyG. Share on XFurthermore, density is a metric that GPS technology can easily track or calculate, and it should be included in regular athlete monitoring. For instance, a metric like player load/minute is one that we track and report on daily. While the team can have an average player load of 300 on different days, the day that has a player load/minute of 3.5 will be much denser, and therefore more intense, than the day with a player load/minute of 2.5.
While tracking the automatically calculated density metrics from the GPS software is the most straightforward approach, practitioners can also simply divide any of the chosen GPS metrics by the time of the activity to get the density. Additionally, without performing any other calculations (for those who are not math-inclined), practitioners can easily look at density from week to week if practice start and end times are similar enough. For example, last Tuesday’s practice and this Tuesday’s practice had the exact same duration, with last Tuesday’s practice totaling 400 hard acceleration efforts and this Tuesday’s totaling 300; therefore, last Tuesday’s practice was denser.
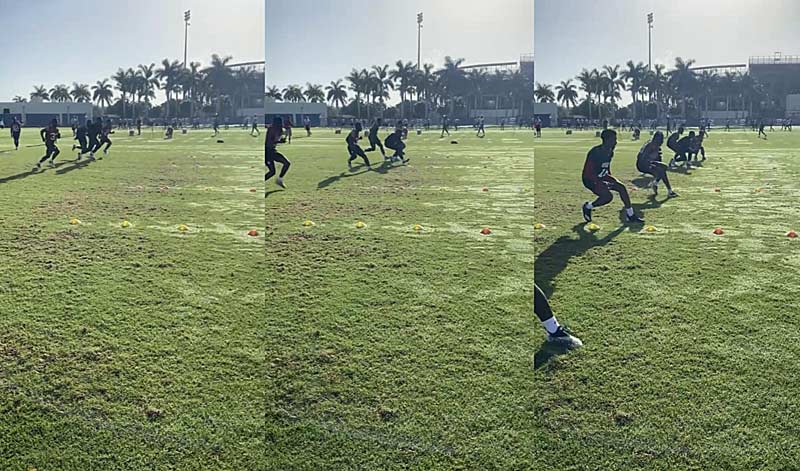
Do Track and Monitor Decelerations
For years, practitioners and researchers alike have noted the importance of horizontal acceleration in multidirectional athletes. Recent research—specifically articles published by Damian Harper—has highlighted the importance of horizontal deceleration. As noted by Harper et al.,3 horizontal deceleration ability underpins rapid change-of-direction maneuvers, with a higher deceleration ability potentially enabling an athlete to create and/or close down space to a higher degree. Furthermore, intense decelerations create greater mechanical load than both intense accelerations and high-speed running and may increase the risk of time-loss injury if not managed appropriately.3 Consequently, we’ve placed a heavy emphasis on deceleration training, both during our fieldwork and in the weight room, and have assessed and monitored various deceleration metrics.
Our primary methods of monitoring and assessing deceleration are a deceleration-specific field test and max deceleration and hard deceleration efforts using our GPS technology. The former consists of the athlete sprinting with maximal intent to a specific marker (cone, yard line, etc.). Immediately upon reaching the marker, the athlete decelerates in as short of a distance as possible (e.g., 3.5 yards). Although we also assess deceleration capabilities subjectively using our coaching eyes, this is an easy and effective way to objectively measure horizontal deceleration capabilities.
We typically use this specific field test during the off-season, and we assess bilateral, left-leg, and right-leg capabilities to ensure there are no glaring asymmetries. While there are various ways to adjust this field test—increasing/decreasing the sprint-in distance, decelerating to a lateral stance position, etc.—coaches should ensure maximal intent is given during the sprint-in to the marker. We’re currently exploring using timing gates during the build-in to ensure the athlete hits a certain threshold of their acceleration capabilities, such as 90% of their 10-yard sprint start.
Using GPS, we track both max deceleration and hard deceleration efforts (quantity of decelerations above 4.0 m/s2threshold) during the off-season and in-season. Monitoring these metrics is vital due to the high mechanical stress that occurs during decelerations. As noted by Harper et al.3, there are almost three times the amount of ground reaction forces (GRFs) that occur during a max horizontal deceleration as during a max horizontal acceleration. Anecdotally, we’ve seen a positive correlation between subjective measures of training using RPEs and hard deceleration efforts.
Furthermore, although we’re still analyzing the data, we’ve seen a reduction in max deceleration capabilities during a training block placing a heavy emphasis on eccentrics, including supramaximal eccentric loading and accentuated eccentric loading. Practitioners can expect to see a dip in max deceleration during an eccentric training block before super-compensation occurs.
Do Not Just Buy Into One Model
Just as practitioners can get stuck in the mindset that one and only one approach is best for enhancing sports performance (e.g., block vs. linear periodization, parallel vs. sequential vs. emphasis training models, etc.), practitioners can also view their model of collecting, organizing, and analyzing data as the only way.
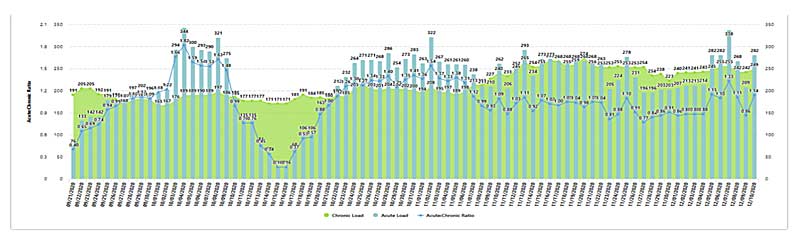
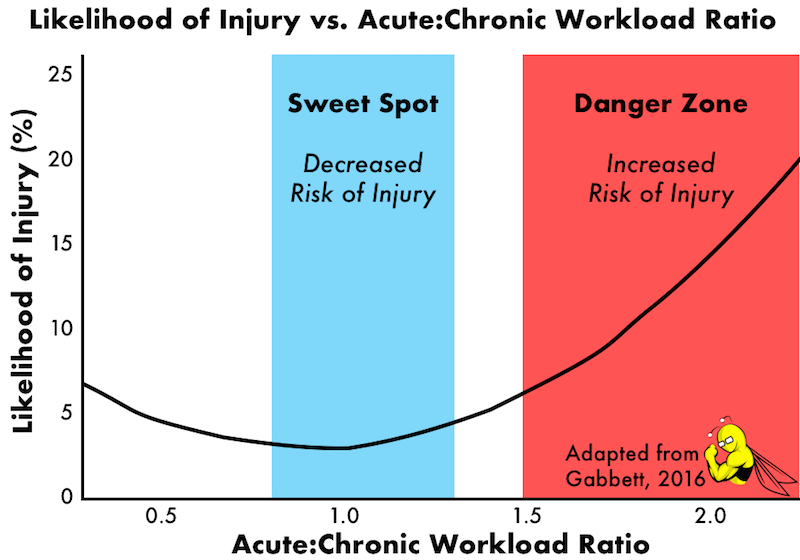
Although there are certain basic principles that should be followed regarding different facets of data integrity, practitioners should choose the methods that best fit their environment. Share on XAlthough there are certain basic principles that should be followed regarding different facets of data integrity—such as the standardization of data collection, choosing assessments/technologies that are both valid and reliable, and the avoidance of p-value hacking—practitioners should choose the methods that best fit their environment. For example, while one performance staff may strongly believe in the use of the acute:chronic workload ratio and Tim Gabbett’s “sweet spots” and “danger zones” for injury risk4, others may view this as an “inaccurate metric” with no evidence to support its alleged ability to reduce injury risk5.
Furthermore, the constantly evolving world of sports performance requires coaches to continue learning, growing, and developing—if an individual buys into only one model or mode of thinking, they risk being left behind.
The constantly evolving world of sports performance requires coaches to continue learning, growing, and developing—if you buy into only one model or mode of thinking, you risk being left behind. Share on XThe same can be said for everything surrounding data in the sports performance world. While some technologies have been around for decades, others explode onto the scene and then just as quickly disappear. For example, if you’re known as the “force plate man/woman,” and your entire performance model is built around this technology, what happens if a newer and better technology comes along? What happens if you move into an environment that doesn’t have a force plate?
While members of the high-performance unit, and specifically the sport scientist, should absolutely know and stand by what they believe in, they should also constantly explore and perform unbiased research on other models and be prepared to make minor adjustments along the way.
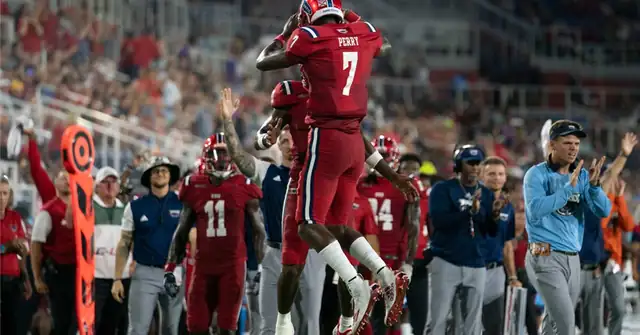
Lead Photo by Jason Mowry/Icon Sportswire
References
1. French D and Torres Ronda L (Eds.). (2021). NSCA’s Essentials of Sport Science. Human Kinetics.
2. Bahr R and Krosshaug T. “Understanding injury mechanisms: a key component of preventing injuries in sport.” British Journal of Sports Medicine. 2005;39:324–329.
3. Harper DJ, McBurnie AJ, Santos, TD, et al. “Biomechanical and neuromuscular performance requirements of horizontal deceleration: a review with implications for random intermittent multi-directional sports.” Sports Medicine. 2022;1–34.
4. Gabbett TJ. “The training-injury prevention paradox: should athletes be training smarter and harder?” British Journal of Sports Medicine. 2016;50(5):273–280.
5. Impellizzeri FM, Tenan MS, Kempton T, Novak A, and Coutts AJ. “Acute: chronic workload ratio: conceptual issues and fundamental pitfalls. International Journal of Sports Physiology and Performance. 2020;15(6):907–913.
 Dr. Chad Herring joined the Florida Atlantic University Football program in May 2022 as the Director of Sports Science. Prior roles include serving as the Director of Performance for DIA Sports Performance (private sector), Head Strength and Conditioning Coach at Angelo State University (NCAA Div. II), and a seasonal Strength and Conditioning Coach for the Tri-City ValleyCats (Houston Astros minor league affiliate). Chad earned his B.S. from Ithaca College, M.Ed. from Angelo State University, and Ph.D. from the University of Central Florida (UCF). While at UCF, he worked on various sport science projects with the Men’s Soccer, Women’s Rowing, and Women’s Volleyball teams. Additionally, his dissertation was completed with the UCF Softball team, titled “Utility of novel rotational load-velocity profiling methods in collegiate softball players.”
