The Collision Zone: Tracking Momentum in Rugby Union with 1080 Sprint Benchmarks


Summary
While speed and size are building blocks of athletic performance, the combination of those qualities as momentum plays an even greater role in collision sports. Focusing on rugby union, coach Jonathan Ward uses 1080 Sprint technology to create momentum benchmarks by position and ensure that gains in speed or body mass benefit their performance on…
Before you dive in further, I want you to envision a collision sport athlete who personifies speed. That athlete who leaves opponents in their rearview mirror. Who came to mind? As my background is rugby, my brain goes directly to Smokin’ Joe Rokocoko.
Next, I want you to envision a bruising ball carrier or defender—someone who more likely than not has sent someone to hospital. Who you got this time? I think of the late, great Jerry Collins.
Now, think of an athlete who has both traits, who if required could easily run around their opposition, or conversely run right over them. Who comes to mind? In rugby there is no going past Jonah Lomu.
As an S&C coach working in a collision sport my goal is to try and create powerful athletes. Athletes who can use their speed, strength, or both to win the collision zone. One way that I do this is with the 1080 Sprint.
I have been working with the 1080 Sprint since 2019, and in that time I have been able to learn from coaches who have shared their experiences with the technology, including Cameron Josse, Chris Korfist, Matt Tometz, Jacob Cohen, and Kyle Davey. I also wrote an article for Simplifaster on how I use the 1080 Sprint to perform resisted sprints and profile athletes using the software tools.
One thing missing in all this, however, is benchmark data relating to sprint times, velocities, and momentum. There is a plethora of data on sprint times and velocity measured using speed gates and GPS, yet there is a lack of data out there from coaches using the 1080 Sprint. Regarding sprint momentum and rugby union, there are two published papers: one conducted on amateur athletes1 and the other on professional junior and senior rugby athletes2. In this article, I will share insights into sprint momentum, velocity, and split times recorded using the 1080 Sprint.
*This article shares general benchmarks and insights into sprint performance using the 1080 Sprint, which are intended to support the broader coaching community and cannot be directly applied in a way that would compromise my team’s competitive advantage.
Athlete Data & Methods
I analysed sprint performance data from 38 of my professional rugby players over a 20m distance, collecting split times, average velocity, and peak velocity data for each 5m split. I then calculated the momentum using the athlete’s body weight (both average and peak momentum).
The athletes completed 20m sprints indoors on a synthetic surface while wearing running shoes. This data was collected during the first testing session of each year over the past two seasons, with the best result from each athlete’s two 20m sprints used for analysis. Although I considered extending the distance by an additional 5m, I kept it at 20m to ensure the athletes had sufficient space to decelerate safely and could focus on giving maximal effort without hesitation.
All analysis was done using JASP3 and finding JASP in 2024 has been a godsend. I am by no means a whiz with stats, but using JASP has been a walk in the park compared to R and Python. Simply upload your data (in CSV format) into JASP, and the user-friendly software will help make the analysis of your data a breeze.
Rugby Union 101
For those of you not familiar with Rugby Union and the playing positions, here is a quick rundown.
Rugby union is a collision sport played over two 40-minute halves (80 minutes total). There are 15 players on the field (100m x 70m) for each team, and eight reserves on the bench. In international rugby, once a player is substituted, they cannot go back onto the field of play unless for an injury. All players play on attack and defence, and play continues until a stoppage is called by the referee due to an error such as a knock on (player dropping the ball forward), a forward pass, a penalty, or the ball goes out of bounds. The aim is to score points via a try (5 points) which is where you ground the ball in the opponent’s goal, or kicking the ball through the posts via a conversion (2 points) after a try is scored, or a penalty (3 points), or drop kick (3 points).
The Forward’s Group
These players are typically larger and stronger than the Back’s group. One of the main differences between the groups is that Forwards perform in the scrum and lineout and try to gain and maintain possession through tackles, rucks, and mauls. They engage in more collisions than the Backs throughout the match2 and work in smaller spaces. Backs, on the other hand, are generally faster, more agile, and more responsible for passing, running, and kicking the ball to create scoring opportunities, often operating in larger open spaces.
- Front Row comprised of #1, #2, and #3. These guys pack down in the front row of a scrum and lift the jumpers in the lineout. We colloquially call them “Piggies” because they are big dudes with no necks and you certainly don’t offer to take them out for lunch.
- #1 and #3 are Props and #2 is called the Hooker, who is responsible for throwing the ball in during the lineout. For my American readers, the Props are the physical equivalent of your Offensive Linemen, and in some teams the Hooker can be like a third Prop, or a smaller and more mobile athlete like a Back Row athlete.
The Second Row
Here you have #4 and #5. Their most important role is jumping in the line out. Diving a little deeper you have different roles for the Second Row depending on teams. #4 is generally lighter and a better jumper as he is quicker in the air. #5 is the bigger of the two and packs down in the scrum behind #3.
The Back Row
#6, #7, and #8—these guys are not as big as #1-5, but offer a blend of size and mobility. They can carry the ball, tackle, and have what we refer to as “hands” in that they are good at passing and can work in with the Backs. Physically, these guys are the equivalent of Linebackers in American football.
In the Backs group you have the Halves, with #9 the Halfback and #10 the Flyhalf. These guys are the like the Quarterbacks, driving the team around the pitch and deciding when to run, pass, or kick. Physically, these guys tend to be the smallest players on the field.
You then have #12 and #13 and together they form the Centres. These guys can have multiple roles depending on the team. They can be big ball carriers and hard hitters on defence or act as a backup Flyhalf in that they can pass and kick. Generally, you would have one of each type on the field at the same time. Physically, these guys are the biggest of the Backs and would be like tackle-breaking running backs in the NFL.
The last Backs group are the Outside Backs (or Back Three), with #11 and #14 (Wingers) and #15 (Fullback). Your Wingers are your fastest players on the field, much like Wide Receivers, and your Fullback is a player who can do it all: run, kick, pass, and tackle, as often he is the last line of defence when the opposing team makes a break.
Sprint Momentum Values by Playing Group and Position
Sprint momentum is an important metric in collision sports, as it is a combination of an athlete’s velocity and mass. An athlete with the higher momentum should have a better chance of winning collisions (not taking into consideration technique).
Sprint momentum is an important metric in collision sports, as it is a combination of an athlete’s velocity and mass. An athlete with the higher momentum should have a better chance of winning collisions, says @jonobward. Share on XMonitoring momentum gives us coaches a better understanding on an athlete’s physical development, as it tells us if the changes in velocity and body mass are beneficial. For example, if my athlete improved his speed from 9.2m/s to 9.3 m/s, yet dropped 3kg in doing so, is this beneficial? Is he still robust enough to win the collision zone and withstand the repeated hits? Conversely, imagine another athlete gained 5kg over the year, but his max velocity dropped from 8.9 m/s to 8.6m/s. Has this increase in body mass made them less explosive and mobile around the field? Whilst they may be more dominant in the collisions, has there been a cost in terms of number of ball carries and tackles? This is what makes monitoring momentum better than just monitoring velocity or body mass—it can add a little more context to the athlete’s development.
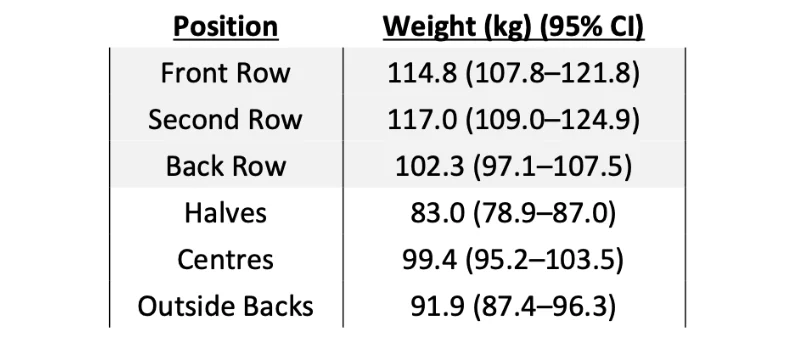
Has an increase in body mass made the athlete less explosive and mobile around the field? While they may be more dominant in the collisions, has there been a cost in terms of number of ball carries and tackles? Share on XRegarding my data below, I calculated momentum using both average and peak velocity over each 5m split to allow comparisons with systems like speed gates, which typically use average velocity over a given split to calculate momentum. You will find the mean weight (95% CI) for each position in Table 1. Table 2 shows the data for the Forwards and Backs, and Table 3 shows the data for each playing positions. When calculating momentum for each playing position I took the peak velocity.
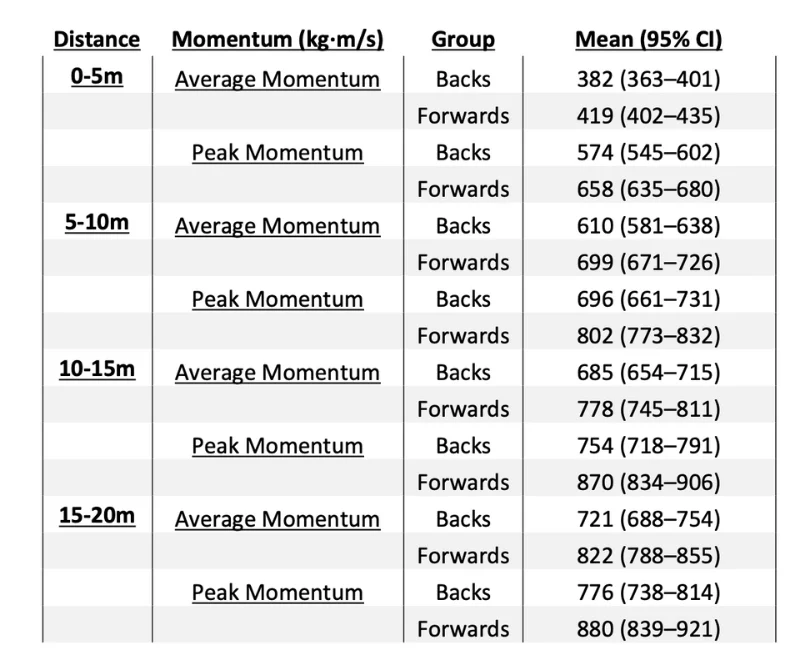
When comparing my data to the research of Barr et al 2, who examined momentum of professional rugby players over 40m, my findings mirrored what they found, with the forwards having significantly higher momentum than the backs (p=<0.001).
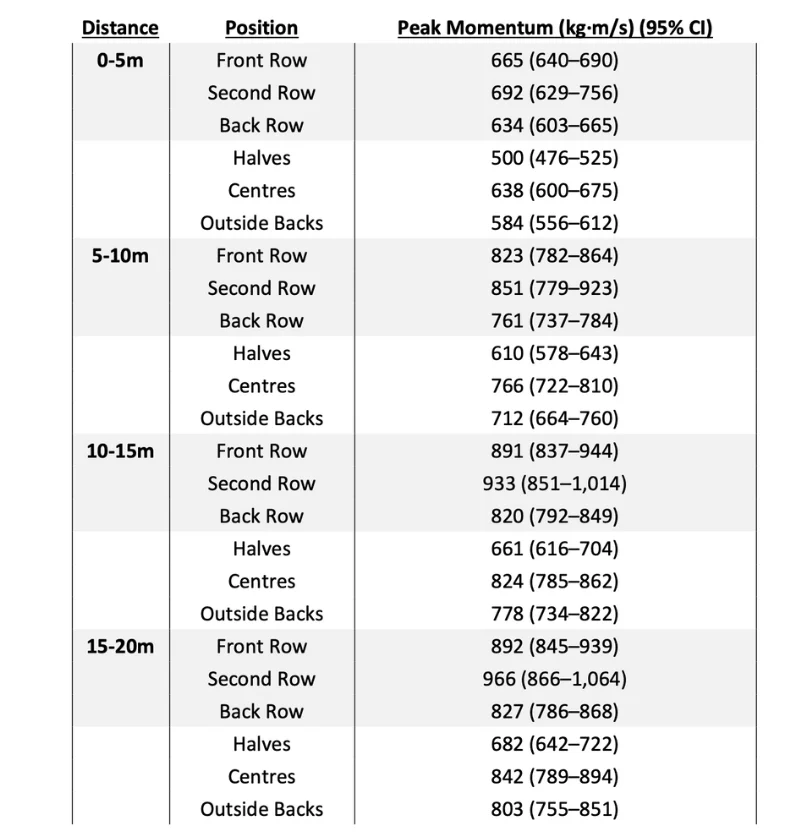
From above you can see that Front Row and Second Row have a higher momentum than other positions. For the Front Row, this is due to their increased body mass, and for the Second Row a mixture of their heavier body mass, and velocity, which you will see later in the article where I provide their velocities. They are followed by the Back Row and Centres, with the Outside Backs and Halves bringing up the rear.
Research by Mann et al 5 in college football athletes stated that momentum is a better metric to track than velocity alone, since velocity improvements are shown to stagnate in college football athletes 6,7 yet body mass consistently increased. However, working in Rugby, and specifically in France, I have found that improvements in velocity can made in senior professional rugby. Speaking on my current situation here in France, one of the biggest reasons I believe this is due to the culture.
The culture of strength and conditioning, and long-term athlete development (LTAD) here in France is different compared to the anglophone countries such as the USA, UK, Australia, and New Zealand. Young athletes don’t have high schools that are kitted-out with state-of-the-art equipment, nor is there inter-collegiate sport like in the USA (NCAA). The majority don’t have access to the same level of coaching when they are younger. Whilst the S&C (and lifting) culture in France is on the up, France is still 10-15 years behind. I believe I am able to make significant improvements when working with my French athletes in part because many were not exposed to a structured speed program when younger.
To that end, below are some examples of the year-on-year change I have seen with my athletes.
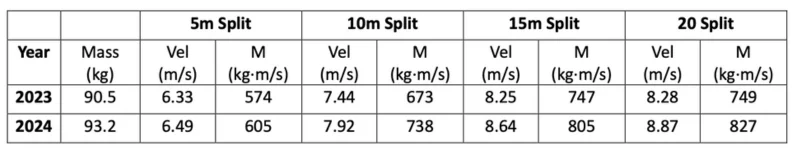
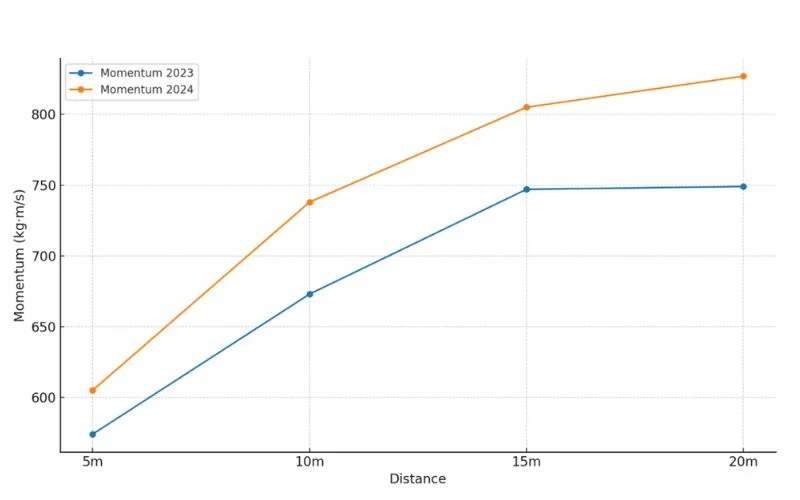
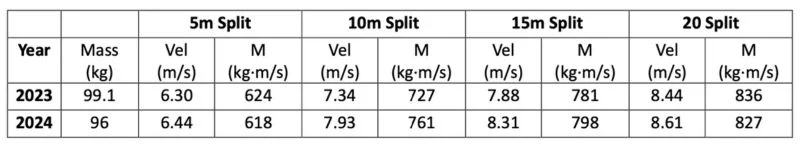
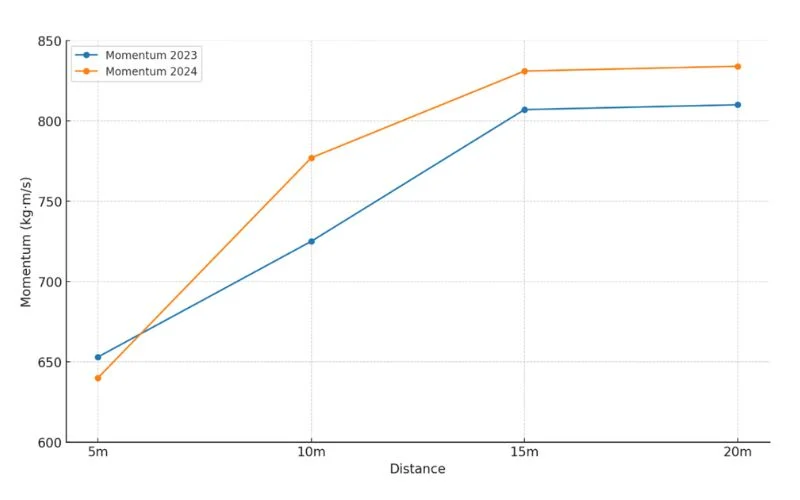
The first example is an Outside Back, who increased his velocity and body mass (+2.7kg). As we can see in Graph 1, there is a nice vertical shift in the line graph between 2023 and 2024—this is what I would call a good responder and a job well done. On the field, we have also seen greater confidence in his ball carrying abilities (leading to a nice highlight reel of him putting opposing players on their ass).
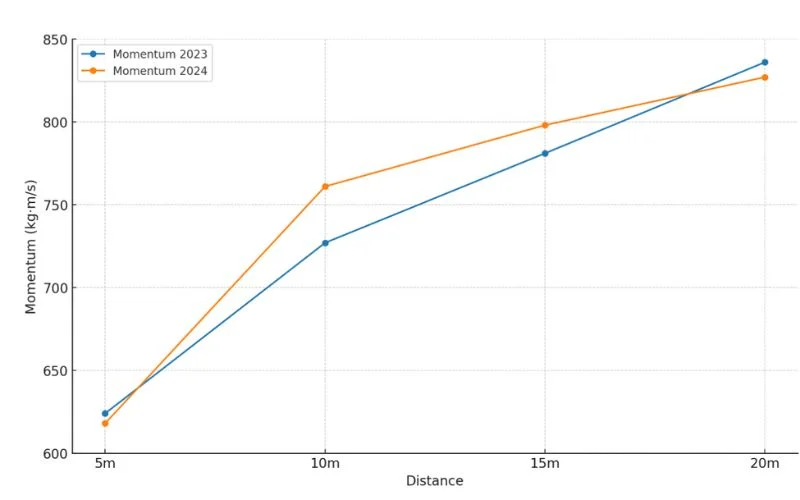
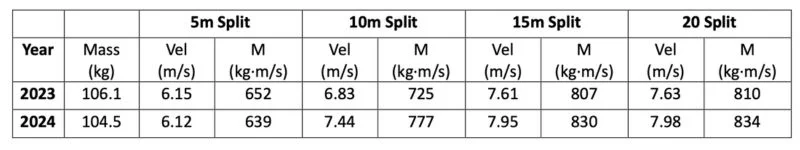
In this second example I have a Centre/Outside Back who lost body mass (-3.1kg), but increased their velocity. Their loss in body mass was mostly due to fat loss, as observed in his lower sum of skin folds. He also increased his total body strength and fitness score (the 1.2km Bronco). So, whilst we saw a decrease in 5m momentum and 20m momentum, as a coach I am happy as physically he became a better athlete and we saw his production and involvement on the field increase too. This is why context is key, and a reason why momentum should not be viewed in isolation.
This last example is a Hooker who plays in the style of a Back Row. He lost weight (-1.6kg) and increased his velocity. Due to this, we saw his 5m momentum decrease, but his momentum in the 5-10m and 10-15m split increase. This athlete was in the similar boat to the athlete above, in that he lost fat mass but kept his strength levels and has seen more involvements in the match. Initially there were concerns about his loss in body mass affecting his ability to win the collision zone, but already this year he has scored four tries in close quarters, two of which he had multiple defenders trying to bring him down.
A final note regarding sprint momentum, I did have a handful of athletes who did not improve their momentum due to a loss in velocity or changes in body mass that were not beneficial. This presents a new challenge for me as I work to address this and help them return to their previous performance levels and ideally surpass them. When training to improve sprint momentum, I want to put in place a program that targets sprint velocity (acceleration and max velocity), in addition to gym programs that focus on strength, power, and lean muscle mass. For some players it can even be switching out gym (or half-a-session of gym) for off-feet conditioning sessions. I’m looking at my Polynesian athletes here, who were born as strong as an ox but take one look at fast food and pile on the kilos.
Average Velocity Values by Position
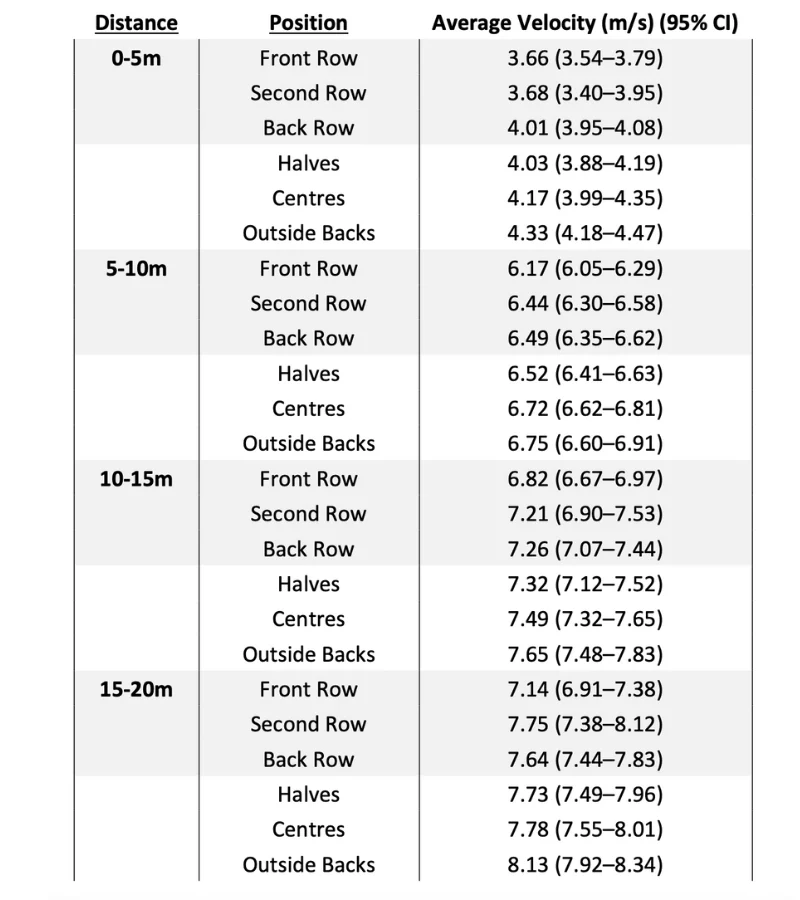
In Table 7 below you will find average velocity values—I know coaches using speed gates may want to make comparisons, as you may not have the capability to extrapolate peak velocity values.
Peak Velocity Values by Position
The peak velocity values are shown below in Table 8, and I conducted a statistical analysis to determine if there was a significant difference between the positions, and if so the effect size (Cohen’s d).
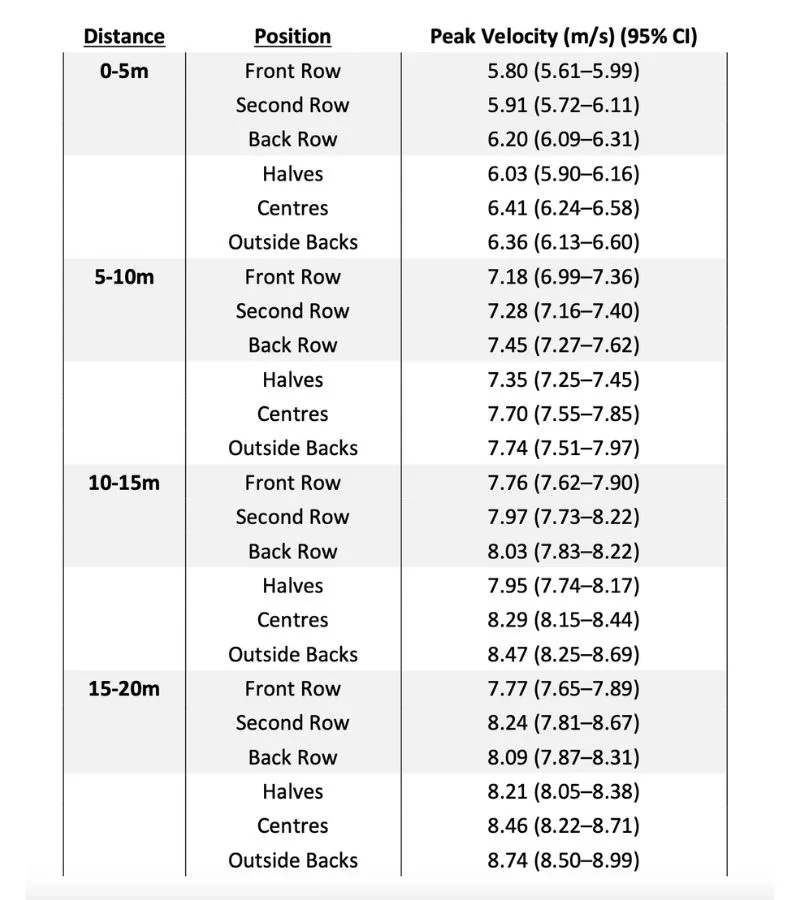
0–5m Peak Velocity Analysis
- Centres were faster than the Second Row (p = 0.045, d = 2.083), the Front Row (p = 0.001, d = 2.548), and the Halves (p = 0.033, d = 1.602).
- Outside Backs were faster than the Front Row (p = 0.003, d = 2.334).
5–10m Peak Velocity Analysis
- Centres were faster than the Front Row (p = 0.004, d = 2.294), and the Halves (p = 0.048, d = 1.521).
- Outside Backs were faster than the Front Row (p = 0.002, d = 2.486) and the Halves (p = 0.019, d = 1.713).
10–15m Peak Velocity Analysis
- Centres were faster than the Front Row (p = 0.014, d = 2.033).
- Outside Backs were faster than the Back Row (p = 0.037, d = 1.705), Front Row (p < 0.001, d = 2.716), and the Halves (p = 0.004, d = 1.998).
15–20m Peak Velocity Analysis
- Centres were faster than the Front Row (p = 0.004, d = 2.300).
- Outside Backs were faster than the Back Row (p = 0.004, d = 2.172), the Front Row (p < 0.001, d = 3.225), and the Halves (p = 0.015, d = 1.759).
The statistics show that the Centres and Outside Backs were significantly faster than other positions, depending on the split being examined. The Centres hit the highest velocity on average over the first 5m, then the Outside Backs took the cake from the from the 5m to the 20m mark. Whilst the Centres were able to stay with the Outside Backs over the first 10m, the Outside Backs accelerate faster over the second 10m split. What impressed me the most is the Second-Row group. These guys range from 195-200cm and are on average 117kg (258lbs), so to see them hit over 8.0 m/s in the last 5 metre split, and run faster than the Halves, was impressive. I would not want to be the one tackling them in full flight.
Split Times by Position
In Table 9 are the split times, and I also conducted a statistical analysis to determine if there was a significant difference between the positions, and if so the effect size (Cohen’s d).
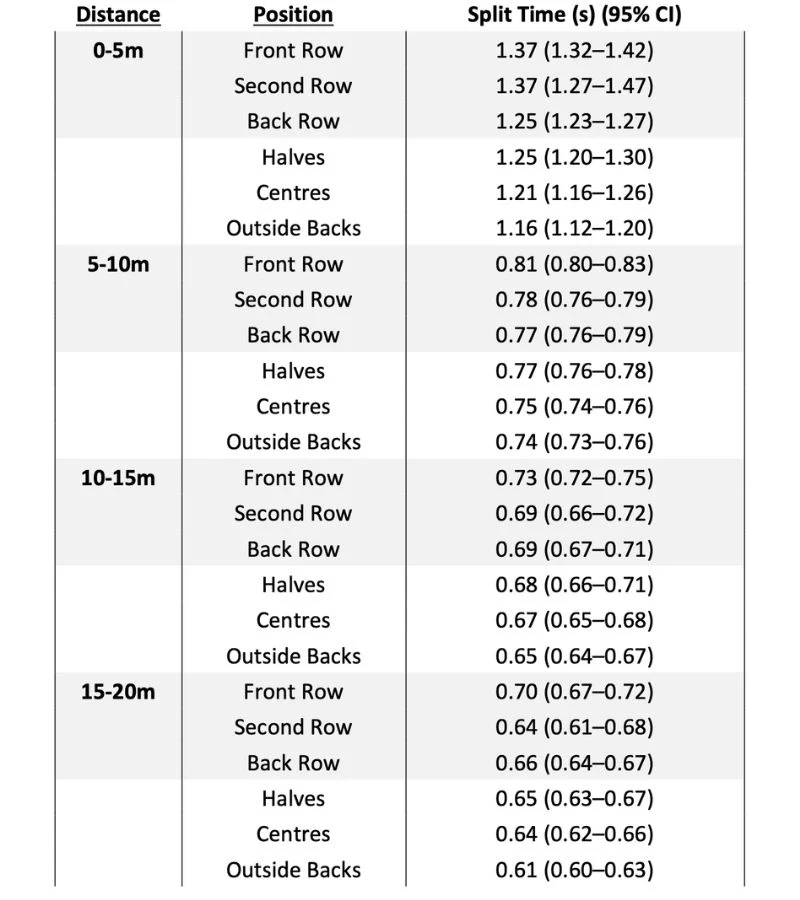
0–5m Split:
- Outside Backs faster than Second Row (p < 0.001, d = 3.239) and Front Row (p < 0.001, d = 3.292).
- Centres faster than Second Row (p = 0.009, d = 2.510) and Front Row (p = 0.001, d = 2.562).
- Halves faster than Front Row (p = 0.019, d = 1.951).
- Back Row faster than Front Row (p = 0.040, d = 1.892).
5–10m Split:
- Outside Backs faster than Front Row (p < 0.001, d = 3.413).
- Centres faster than Front Row (p < 0.001, d = 3.168).
- Halves faster than Front Row (p = 0.009, d = 2.124).
- Back Row faster than Front Row (p = 0.039, d = 1.899).
10–15m Split:
- Outside Backs faster than Front Row (p < 0.001, d = 3.372).
- Centres faster than Front Row (p < 0.001, d = 2.794).
- Halves faster than Front Row (p = 0.010, d = 2.111).
- Back Row faster than Front Row (p = 0.036, d = 1.919).
15–20m Split:
- Outside Backs faster than Front Row (p < 0.001, d = 3.236).
- Centres faster than Front Row (p = 0.006, d = 2.203).
- Halves faster than Front Row (p = 0.023, d = 1.908).
Across all 5m splits, the Backs were significantly faster compared to the Front Row, with the Back Row also significantly faster than the Front Row over the first 15m. The Second Row were significantly slower than the Centres and Outside Backs over the first 5m. However, from the 5 to 20 metres, there was no significant difference, and they even managed to run a faster 15-20m split than the Halves, and the same time as the Centres. Wow!
Additionally, sprint timing comparisons between the speed gates and the 1080 Sprint is ill-advised. In my last article (near the end), I provided a research paper, and my own data, showing that it is not possible. There needs to be consistency in timing methods when tracking performance over time, so pick one and stick to it.
Conclusion
Sprint momentum is beneficial in collision sports like rugby union, where both velocity and mass contribute to an athlete’s effectiveness in the collision zone, and monitoring sprint momentum provides more context than monitoring velocity or mass alone.
In rugby there are significant differences in momentum across positions, with forwards, particularly the Front Row and Second Row, having higher momentum due to their larger body mass. Share on XIn rugby there are significant differences in momentum across positions, with forwards, particularly the Front Row and Second Row, having higher momentum due to their larger body mass. In contrast, the Backs, especially Outside Backs and Centres, hit significantly higher velocities. The individual athlete data (Graph 1-3) shows the nuanced nature of momentum, where changes in body mass and velocity need be contextualised to determine their impact on performance.
References
1. Zabaloy, Santiago & Giráldez, Julián & Gazzo, Federico & Villaseca-Vicuña, Rodrigo & González, Javier. (2021). In-Season Assessment of Sprint Speed and Sprint Momentum in Rugby Players According To the Age Category and Playing Position. Journal of Human Kinetics. 77. 10.2478/hukin-2021-0025.
2. Barr, Matthew & Sheppard, Jeremy & Gabbett, Tim & Newton, Robert. (2014). Long-Term Training-Induced Changes in Sprinting Speed and Sprint Momentum in Elite Rugby Union Players. Journal of strength and conditioning research / National Strength & Conditioning Association. 28. 10.1519/JSC.0000000000000364.
3. JASP Team. (2024). JASP (Version 0.19.2) [Computer software].
4. Paul, Lara & Naughton, Mitchell & Jones, Ben & Davidow, Demi & Patel, Amir & Lambert, Mike & Hendricks, Sharief. (2022). Quantifying Collision Frequency and Intensity in Rugby Union and Rugby Sevens: A Systematic Review. Sports Medicine – Open. 8. 10.1186/s40798-021-00398-4.
5. Mann, Bryan & Mayhew, Jerry & Lopes dos Santos, Marcel & Dawes, Jay & Signorile, Joseph. (2022). Momentum, Rather Than Velocity, Is a More Effective Measure of Improvements in Division IA Football Player Performance. The Journal of Strength and Conditioning Research. Publish Ahead of Print. 10.1519/JSC.0000000000004206.
6. Jacobson, Bert & Conchola, Eric & Glass, Rob & Thompson, Brennan. (2012). Longitudinal Morphological and Performance Profiles for American, NCAA Division I Football Players. Journal of strength and conditioning research / National Strength & Conditioning Association. 27. 10.1519/JSC.0b013e31827fcc7d.
7. Miller, Todd & White, Tony & Kinley, Keith & Congleton, Jerome & Clark, Michael. (2002). The Effects of Training History, Player Position, and Body Composition on Exercise Performance in Collegiate Football Players. Journal of strength and conditioning research / National Strength & Conditioning Association. 16. 44-9. 10.1519/1533-4287(2002)016<0044:TEOTHP>2.0.CO;2.
