Everything You Need to Know About the Countermovement Jump on Force Plates

Summary
Believing that data is only as valid as the consistency of collection, Hunter Eisenhower offers a comprehensive breakdown of how he plans, cues, and assesses the countermovement jump on force plates. From key factors relating to the phases of the jump, Eisenhower explains how he evaluates different types of athletes and leverages that insight to…
I’m not writing this article to introduce a novel assessment—the countermovement jump (CMJ) has been used for longer than I’ve been a coach and numerous practitioners have been applying it as an assessment for much longer than me! I do, however, find it interesting when I speak to other coaches about some of the nuances of measures I take and they are curious about and surprised by things I assumed were common knowledge. This is not to boast—the same thing happens in reverse with almost every coach I speak to—but I wanted to take this opportunity to share how I approach one of the most common assessment measures in all of performance.
Some of the “precautions” I take might seem trivial, but the consistency and reliability of data is of the utmost importance IF we want to assume any actionable insight from the data. On a recent episode of the podcast I co-host with Mike Sullivan, Move The Needle: The Human Performance Podcast, we had a conversation with Adam Virgile of the Los Angeles Clippers that included a fairly long discussion on “clean data.”
This helped to reinforce that I am correct in thinking that the way you collect data is as important as the way you interpret it. You cannot have accurate interpretation without clean collection. This is not to say that we in the performance field can expect to collect data in the same way as in a research setting; however, I think we can appreciate the rigidity of that model and attempt to collect our data in a similar fashion, even while being in a much more chaotic environment.
The way you collect data is as important as the way you interpret it—you cannot have accurate interpretation without clean collection, says @Huntereis_sc . Share on XIf there is not a level of consistency within your testing procedure, you may be better off not even wasting athletes time in performing CMJs on a force plate, because you will be unable to glean any information from the data. Instead of trying to tease out adaptation or fatigue, these outcomes have to compete with variations that could come from jumping at different times of day, participating in different warm-ups, being given different cues on how to jump, or even simply being awarded feedback or not.
Beyond collection protocols, I believe there are some misconceptions about the use of the information. In a recent post I put out on Twitter and Instagram—showing pregame CMJs I do with my athletes—there were a host of questions, some of which centered around the CMJ potentially predicting injury or dictating game availability/playing time. The data we glean from force plate assessments are one ingredient in the elusive mystery of “readiness.” There are a host of other factors that have to be considered, like sleep, nutrition, arousal, etc., and any taken in isolation only illuminate a small portion of the overall picture.
Throughout this article, I will touch on how I try to create as close to ‘research-grade’ testing procedures as possible to generate actionable pieces of information. We’ll dig into interpreting data, from the raw Force Time curves to some of the most important metrics. We’ll also look at certain types of curves and the information you’re able to collect from these. I hope this article does what countless individuals have done for me: expedite the learning process with force plate assessments and allow you to be an even greater asset to the coaches and athletes you work with.
Consistency
As I alluded to already, coaches may not appreciate consistency as much as they should, since it is an imperative piece to this equation. I could just dig right into the fun stuff, dissecting curves and watching metrics change over time; if, however, we miss the execution of testing, those other things don’t even matter.
Some of what I talk about may have you saying “Alright, that seems like overkill”…and some of it may be! However, if you have the opportunity to create consistency within your testing procedure, regardless of how nominal it seems, do it. Consistency needs to begin the minute athletes come under your instruction. There are multiple factors that we need to consider when preparing to administer a test of any sort, but especially on force plates.
The first? Arousal level.
The energy you bring to the room can affect the way your athletes perform on a test.
If you are quiet, speaking in a monotone, and have no energy throughout an entire training session, your athletes will feed off that. If you have the opposite—energy, “juice” as some may call it—that will immediately add to your athletes’ energy levels. As a personal philosophy, I try to be as consistent as possible with my energy, regardless of day, regardless of jumps on the force plate or not.
Consistency needs to begin the minute athletes come under your instruction. There are multiple factors that we need to consider when preparing to administer a test of any sort, but especially on force plates, says @Huntereis_sc. Share on XThe next piece to think about from an arousal perspective is the environment in the room. Is Waka Flocka blasting? Or is Drake playing at a Waiting Room volume? Do you invite and incite teammates to talk crap to each other as they’re jumping, or do you make it more of a 1-on-1 environment, while teammates are distracted doing something else? All of these pieces may not be 100% controllable, but your energy and the environment you create in your weight room on days that you know you are planning to collect jumps, is.
The next consideration is what type of preparation your athletes do before they jump. For example, I’ve found that comparing jumps during a fairly traditional lift—with limited jumping or running beforehand—to jumps after 20-30 minutes of plyometrics and speed development is like comparing apples to oranges. And what if you also jump pre-game? The jumps from these three scenarios will not even be within the same realm. Now, this is not to say DON’T jump in different scenarios; you just have to be mindful that you should compare jumps of like scenarios to one another.
As an example, we perform “Speed Development” sessions year-round (throughout the off-season and in-season). The off-season sessions may end up being slightly higher volume, but they consist of similar components and last anywhere from 30-35 minutes. Therefore, we will perform jumps after those sessions year-round in an attempt to have a measure throughout the entire year that I know is coming after the same scenario. We also will jump pregame during warm-ups.
Do I compare pregame jumps to post-speed jumps?
No. I can confidently say that pre-game jumps will result in improved metrics across the board. Is that to say athletes had magical adaptation overnight? Obviously not—they are in a new environment, with a new preparation scenario, and heightened arousal levels. Therefore, performance is altered.
Anybody reading this who has ever worked with me knows how much of a stickler I am about the next facet of consistency. The way in which we cue our athletes before their jump and the way we report the information from their jumps may be the most important piece to this entire equation. When my athletes step on the plates, I repeat the same exact information every time.
- First, I tell them to hold still until the ‘quiet period’ on the Hawkin Dynamic plates is registered.
- Then I simply say “fast and high.” That is the athlete’s cue to jump.
During an athlete’s initial times jumping with me, they may be confused by the cue fast and high, because up until this point, most vertical jumps they’ve performed in any capacity were for height, without any regard to “fast.” So, a slight explanation may be needed on the “fast” portion.
I believe the consistency of what you say is ultimately more important than what you say, but if you want to make observations from rate-dependent metrics and output-driven metrics, you should cue some element of both. To eliminate the importance of cueing consistency and to show why both elements of rate and output cueing should be used, I ran an experiment on two individuals.
The way in which we cue our athletes before their jump and the way we report the information from their jumps may be the most important piece to this entire equation, says @Huntereis_sc. Share on X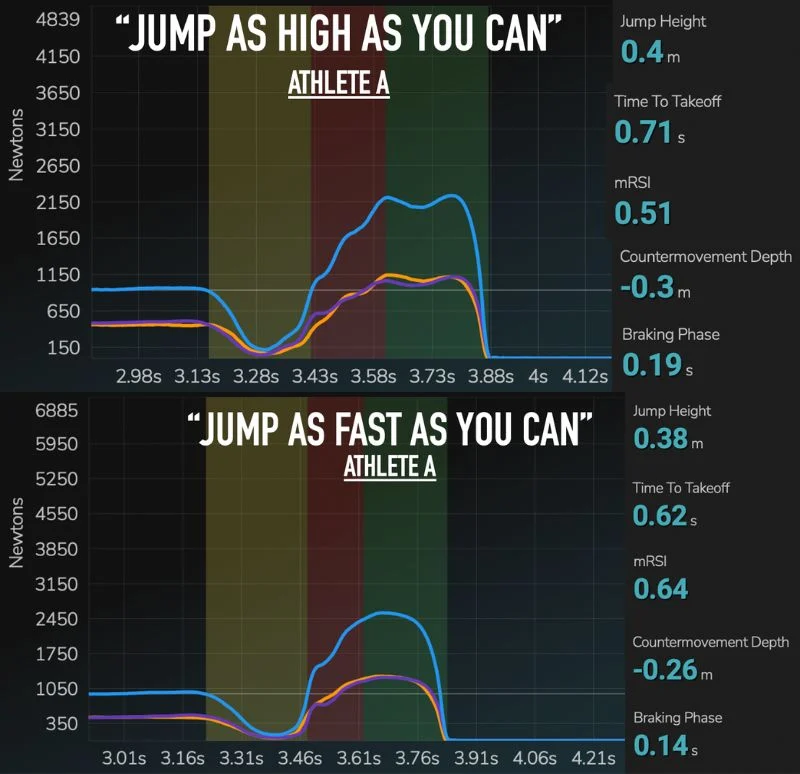
The results from the first experiment are above. I included the Force Time Curve and a metric associated with output (Jump Height), rate-dependent metrics (Time to Takeoff & Braking Phase Duration), a ratio metric (mRSI) and finally a strategy based metric, Countermovement Depth. This experiment is to show the relevance of being intentional with your cueing! The first jump on top the cue was purely focused on jump height, as the athlete was instructed to “Jump as high as you can!” We can see the associated Force Time Curve and metrics with this cue.
The next jump, depicted by the graph below, was performed after the cue “Jump as fast as you can!” We can see the difference in the metrics between the two jumps. Did physical qualities magically change between jumps? Obviously, no. However, the focus, intent—and therefore the strategy that was chosen—were drastically different.
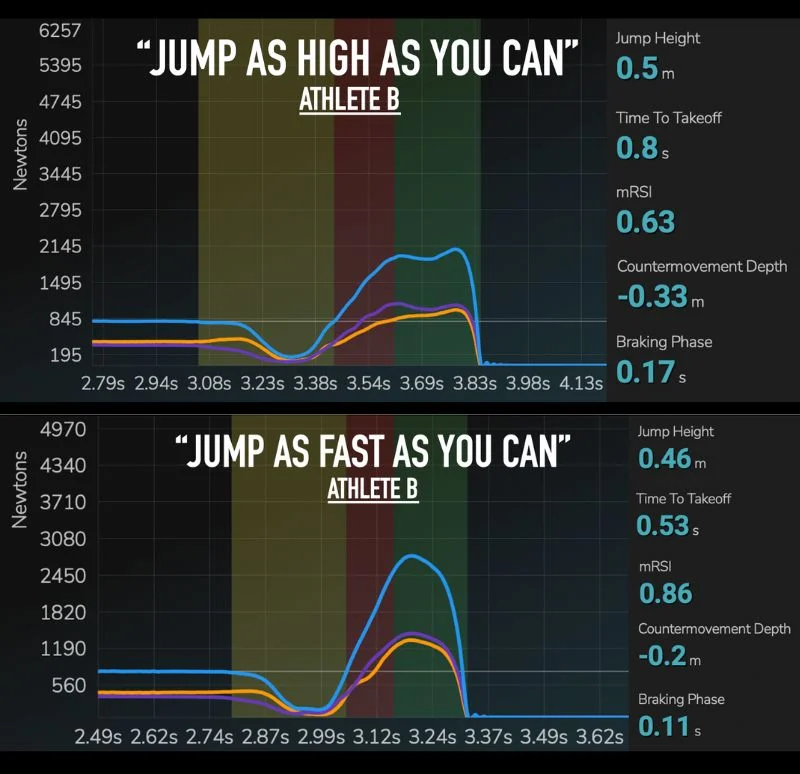
The results from my second experiment are above. For the first jump I gave the cue “Jump as high as you can.” The associated results are seen on top. Before the second jump, the athlete was told “Jump as fast as you can.” The results from this are shown on the bottom graph—as you can see, we are able to manipulate athletes’ strategies by the words we choose.
From this portion of the assessment, I’ve wrestled with what to report to the athletes. Again, the consistency probably provides more value than the specific report, but there is obvious significance in both. After each jump (typically we perform two), I report jump height. Now, you may say, well if you just report jump height, won’t that skew athletes to the “High” portion of the jump and draw them away from “Fast”? I wouldn’t disagree. But I’ve found that reporting, for example, both Jump Height and Time to Takeoff, creates an information overload with too much for athletes to comprehend, leading to over analysis.
I feel comfortable that hearing their jump height will help drive intent with the athlete and the cue of “fast and high” will continually remind them to get off the plates fast. After years of collection, I am even more comfortable with this method because I continuously see my athletes’ Time to Takeoff decrease over time with a gradual increase in Jump Height.
I understand this was an extensive explanation on the considerations that I believe create the most consistent and reliable data, and I hope it drives home the point that the way we collect data is as important as the way we interpret it, if not more. Interpretation is fuzzy if collection is inconsistent.
Interpreting Data
Most of you probably got to this section and thought “I wonder what metrics he is going to discuss?” If you thought about the metrics when I mentioned “data,” you may be disappointed in what the next portion of this article is going to entail. As opposed to digging directly into metrics, first we are going to start with looking at Force Time Curves. There was recently a question posted by @mtn_perform on social media asking “If you only could use one aspect of information from a CMJ on Force Plates, the metrics or the Force Time Curve, what would you choose?”
While I believe it would be tough to only rely on one or the other, I believe so much information would be lost in only focusing on the metrics. Before we begin to dig into how to interpret Force Time Curves, I would be remiss to not thank Jesse Green for introducing me to the power of looking at the curves. I would probably be like most, clicking past the weird, curved line that shows up after a jump and immediately start looking for the numbers. Before we talk about aspects of Force Time Curves, let’s break down each portion of a Force Time curve from a CMJ.
If you use Hawkin plates, they make it very easy to understand what the Force Time Curve is telling you. As you can see below, there are colors to depict the unweighting, braking, and propulsive phase of the jump. We’ll use their help so you can understand what is happening.
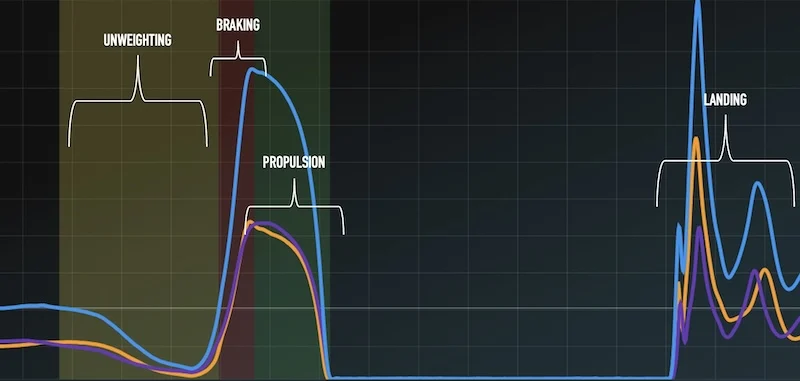
The video below also does a great job of showing the formation of a Force Time Curve in real time. I’ll allow these two examples to demonstrate the aspects of Force Time Curves before we take a deeper dive into the components.
Video 1. This video shows in real-time the formation of a Force Time Curve with an actual jump.
Before we start talking about each phase of the CMJ in isolation, it’s important to note that I’m a firm believer that each portion of a CMJ may not predict, but feeds, the next. A good ability to unweight feeds the ability to produce high amounts of force in the braking portion of the jump, and that force, if repurposed appropriately, adds to the propulsive phase.
Unweighting
If we look at the two pictures below, showing the unweighting phase of two different athletes, what do we notice?
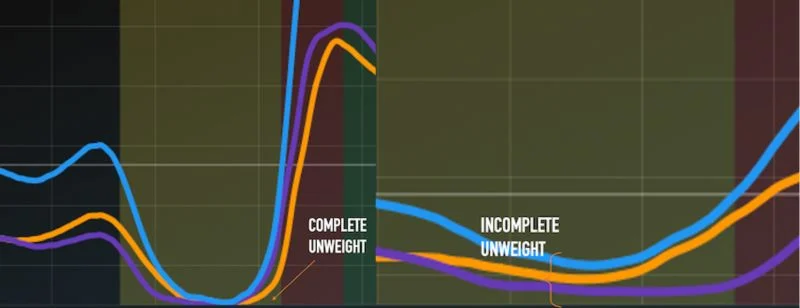
On the right, the unweighting portion is what I’d consider incomplete. This is shown as the athlete is unable to unweight 100% of their bodyweight, with the curve not completely to the bottom of the graph. The picture on the left shows what I consider complete unweighting, where the athlete is able to almost completely reduce their bodyweight, seen by the lines being at the bottom portion of the graph.
If we think about why an incomplete unweighting phase is detrimental to the performance of a CMJ, my first consideration is that the athlete is missing out on potential energy. By completely unweighting, we have the ability to produce more force in the braking portion of the movement. One important note here is to determine if your athlete is unfamiliar with the intent of the movement or if they don’t have the capacity to completely unweight. This can be determined through simple instruction. I only recommend doing this during an athlete’s initial test (or two), if you notice an incomplete unweight.
This question of intent vs. capacity can be answered by simply explaining to the athlete what a complete unweight feels like: the rapid “pull” toward the ground, a free fall where the athlete has no “braking” tension until later in the downward portion of the movement. After a brief explanation and potential demonstration, allow the athlete to perform another CMJ with this new model to focus on. If the athlete now has an improved unweighting phase and the rate- and output-dependent metrics are the same as before, or even a little improved, we know that this was an intent and/or strategy issue. If the new strategy is utilized and the athlete’s other metrics are severely reduced, we know that they must not have the capacity to perform this dramatic of an unweight and physical development, specifically in the braking phase, must be addressed.
This braking phase improvement needs to happen from a physical and psychological perspective. If the athlete’s brain knows it does not have the capacity to slam on the brakes at the bottom of a complete unweight—and therefore handle the associated force associated—the unweight will be limited.
When dealing with an individual that has incomplete unweighting, exercises within the High Force portion of The Force System can be used (you can find more complete information about the Force System here). These are the same exercises that can and should be used to develop braking capacity; the emphasis behind the movements, however, can slightly change. When working to develop their physical ability and psychological confidence to completely unweight, the use of Drop Catches can have significant relevance. However, the focus here should not necessarily be on the intensity or Ground Reaction Forces (GRF’s), but on the intent with the movement.
This fits well in the progression of High Force movements as well—I’ve mentioned in previous articles that an athlete must first understand the importance of this rapid free fall, or pull toward the ground, to later have the ability to be exposed to higher GRFs. This initial emphasis contributes perfectly to the goal of unweighting improvement. Early on, you can use an exercise like a Trap Bar Drop Catch, with minimal additional load, with the sole focus of a complete unweight. This will not only contribute to an improved unweight in a CMJ, but set you up well to better develop the braking and GRF emphasis of the movement with Drop Catches later on as we increase intensity of the movement (and therefore expose athletes to higher GRFs).
Braking Phase
As we begin to look at the next portion of the Force Time Curve, we notice the braking phase. What I typically will assess first is the slope of the curve in this section—as you can see below, the two curves show athletes with two drastically different braking abilities.
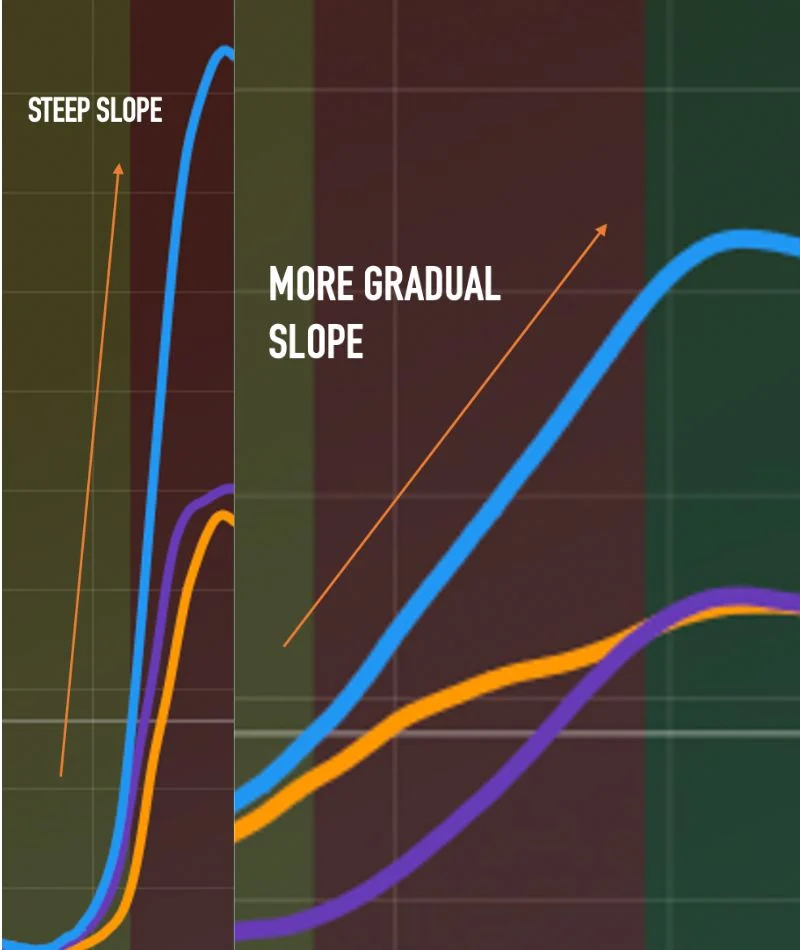
The steep slope on the left depicts the ability of an athlete to be driving full speed and slam on the brakes—or even pull the “e-brake.” The gradual slope on the right shows an athlete that is driving full speed, slowly reducing speed by gradually taking their foot of the gas pedal, and slowly applying pressure to the brake.
The next portion of the braking phase that I assess is the magnitude, or absolute peak, of the braking/propulsive curve. This peak represents the force that the athlete is able to generate during the braking portion of the movement. I believe this magnitude offers the potential of high propulsive forces, leading to high outputs and impressive rate metrics (depending on the athlete’s ability to store and reproduce these braking forces effectively and efficiently). While it may not be completely necessary for athletes to produce the highest of braking forces in order for impressive outputs, I do believe it often contributes.
To build off of our training prescription for an athlete’s ability to unweight, the training prescription for improved braking follows a similar pattern. Allow the intent developed during the early implementation of Drop Catches to expose athletes to higher GRFs when the goal shifts to braking development. As we maintain the acceleration portion of the force equation, we can add mass to our drop catches to elicit higher GRFs—this will help to expedite the development of braking ability. As we follow the natural High Force progression, we can move into Depth Drops, where athletes can experience more than 10x bodyweight forces and deliver the most potent dose of braking or deceleration stimulus possible.
As we maintain the acceleration portion of the force equation, we can add mass to our drop catches to elicit higher GRFs—this will help to expedite the development of braking ability, says @Huntereis_sc. Share on XAt this point, we still haven’t even gotten close to leaving the ground! As I’ve said, each portion of a CMJ is built from the previous and right now we are at the bottom of the countermovement. The development that has occurred to this point will assuredly amplify the part of the movement that often gets the most attention: propulsion.
Propulsion
An important point to make with propulsion: if there are no constraints placed on the movement, then don’t worry about anything to this point. If you’re in a vertical jump competition, with no time constraints, load at whatever rate and depth produces the highest output. But sport is not a vertical jump competition and athletes almost always have a time constraint, therefore making our previous two sections vital.
As we begin to look at propulsion, I tend to examine the slope of this downward portion of the graph, depicted below.
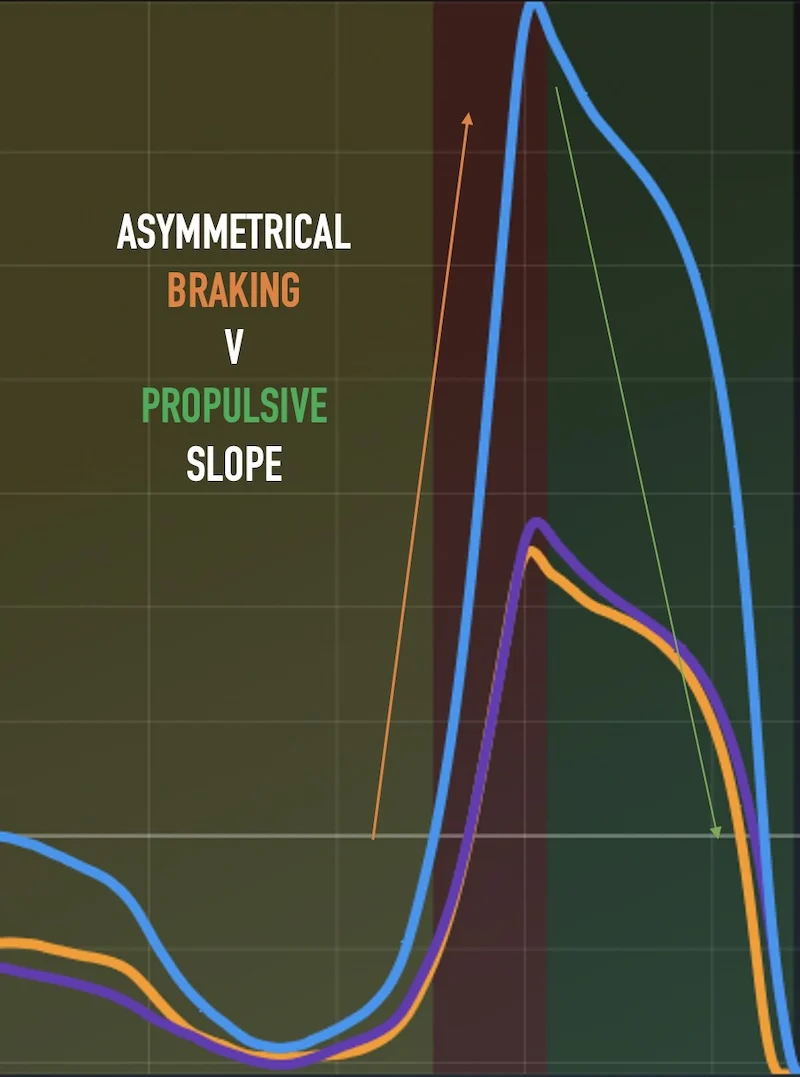
As you can see from the graph above, this individual does a good job of unweighting, plus adds an impressive braking phase…but does not have a propulsive phase that matches, which is shown by the difference in slope of line from braking to propulsion (braking being almost completely vertical, with propulsion being much more rounded). This may be the case after training an individual with Drop Catches and Depth Drops, and now we can focus on training more concentric-based movements, like a Trap Bar Pull, or Overcoming Isometric, shown below.
Video 2. Both a Trap Bar Pull and Overcoming Isometric are more concentrically-oriented movements, compared to movements discussed earlier such as Drop Catches and Depth Drops. Once the foundation has been laid, with a focus on unweighting and braking, a shift to more concentric-type exercises can begin to orient the slope of the propulsive portion of the curve more vertically.
Types of Curves
Before we begin discussing specifics surrounding metrics, I wanted to take some time to discuss different archetypes of curves that you’ll typically see and what they mean. In most situations, you’ll see curves that resemble three shapes, which I classify as:
- Unimodal
- Bimodal Primary
- Bimodal Secondary
An important note: while Unimodal and Bimodal Secondary curves are the two ends of a spectrum, it is not an all-or-nothing situation. For example, I will talk about Bimodal Secondary jumpers’ inability to fully leverage connective tissue to contribute to movement. That is not to say they don’t receive any contribution to their jump from connective tissue, I just believe it to be much less than a Unimodal Jumper. In the same regard, Unimodal jumpers are still going to utilize musculature to jump, but the percentage will be much lower than their Bimodal counterparts.
Let’s dig into each archetype of curve and what they mean.
Unimodal
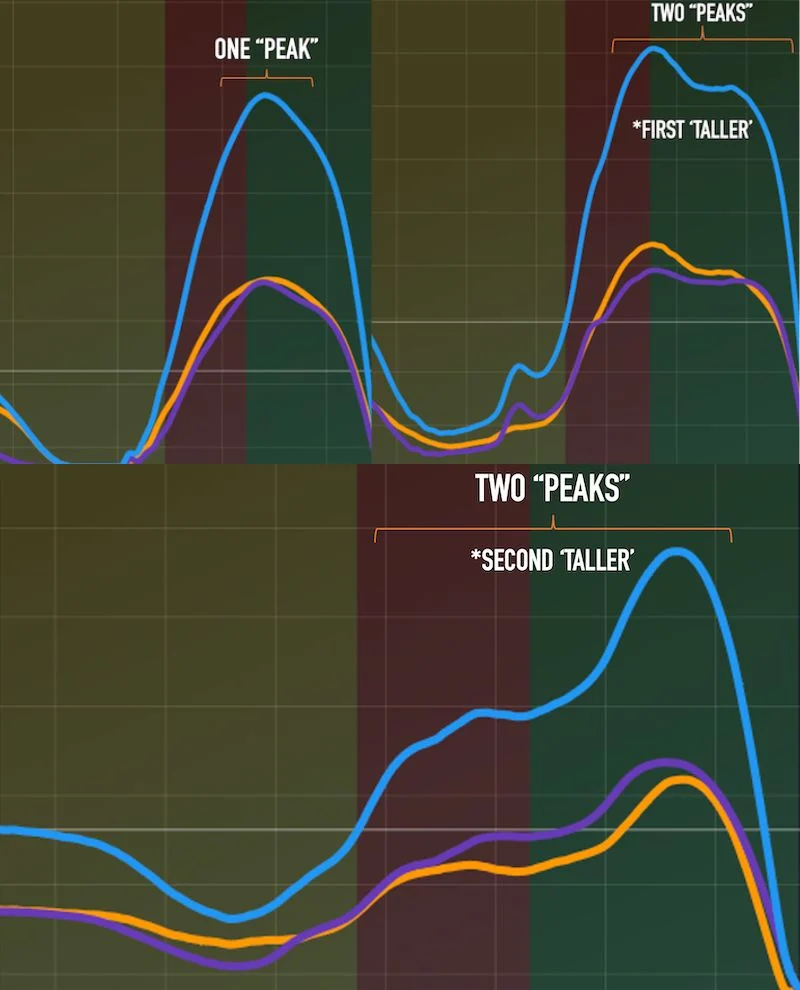
This curve is best represented by one peak during the braking and subsequent propulsive phase. Elastic-driven athletes typically produce this Force Time Curve—these athletes typically utilize short countermovement depths to elicit a rapid stretch of connective tissue (i.e., tendons). Their connective tissue not only stretches rapidly, but has the capacity to store and repurpose all of that energy throughout the propulsive portion of the movement.
This movement strategy allows these athletes to not only leverage their elastic structures more effectively, but also removes the need to rely on bigger musculature to produce the majority of movement (like somebody that may demonstrate a deeper countermovement). P3, a performance group with facilities in Santa Barbara and Atlanta (and, in my opinion, one of the best—if not the best—performance facility in the world) released a research paper a few years ago relating to the three categories of jumpers that they have seen from their CMJ Force Plate assessments. From a kinematic standpoint, what they saw were three categories:
- “Stiff Flexors”
- “Hyper Flexors”
- “Hip Flexors”
From my subjective evaluation, I’ve determined that most unimodal jumpers resemble the Stiff Flexor strategy (as seen below).
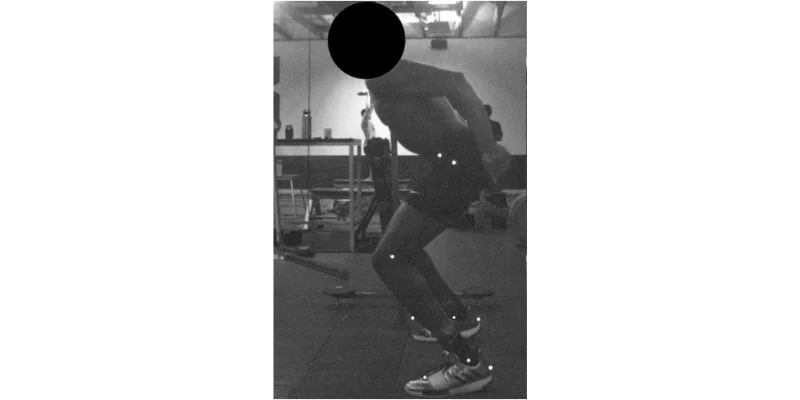
Figure 8. Picture of Stiff Flexor from P3’s “Different Movement Strategies in the Countermovement Jump Amongst a Large Cohort of NBA Players.” Open Access, Creative Commons License here.
So, what are the pros to this movement strategy?
Typically, these athletes’ rate-dependent metrics are good. They will get off the ground fast due to their shallow countermovement and reflexive nature of relying on connective tissue to be more of a driver of movement than musculature. I also believe this to be the most efficient way to produce movement. As we see from the Stiff Flexor picture, joints are stacked and loaded almost symmetrically, whereas the Hip Flexor is utilizing extreme hip flexion and minimal knee or ankle flexion.
As with anything, there are cons to this movement strategy (not a lot, though). Unimodal jumpers typically do not have as impressive of output-based metrics in a CMJ when specifically focused on Jump Height. I believe this is because a standstill CMJ, when height is the goal and time is not a constraint, will be best accomplished with a more muscular-driven strategy. Throw the time constraint back into play, however, and this ‘con’ goes out the window. When you see elastically-driven athletes, typically with narrow ISA, limited muscle mass, short muscle bellies, and long tendons, you likely have a Unimodal jumper.
When you see elastically-driven athletes, typically with narrow ISA, limited muscle mass, short muscle bellies and long tendons, you likely have a Unimodal jumper, says @Huntereis_sc. Share on X
Bimodal Primary
This curve occurs when there are two peaks during the braking and propulsive phase, with the first peak being higher. I believe this curve is representative of what I would consider a more ‘hybrid’ athlete. They are able to access and utilize connective tissue to help contribute to movement—seen by the first peak—but there is a ‘leak’ of energy present to where they then harness some of the force-generation capacity of larger musculature at deeper ranges of motion, which then provides a portion of propulsion as seen with the second peak.
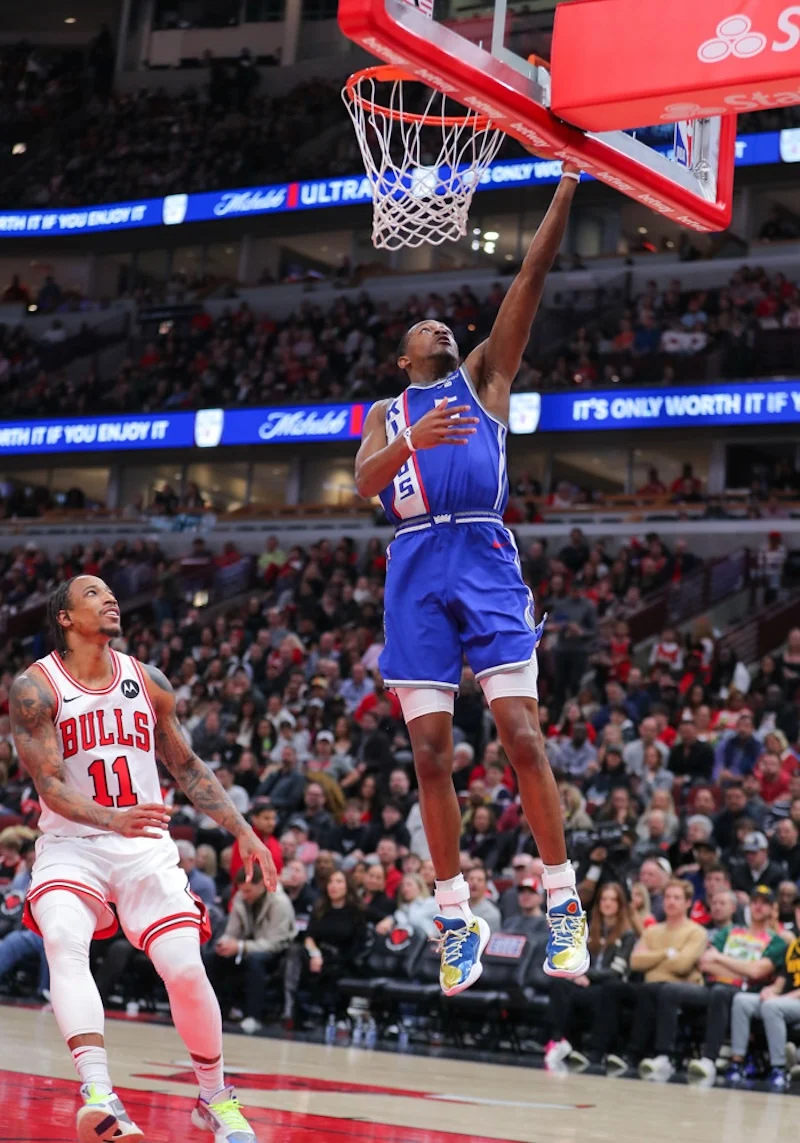
Looking at P3’s model of CMJ jump strategy, I would say that most Bimodal Primary jumpers would resemble the Hyper Flexor strategy. I do, however, believe that a select few Hyper Flexors could potentially be Unimodal jumpers, if they possess elite braking and propulsive ability.
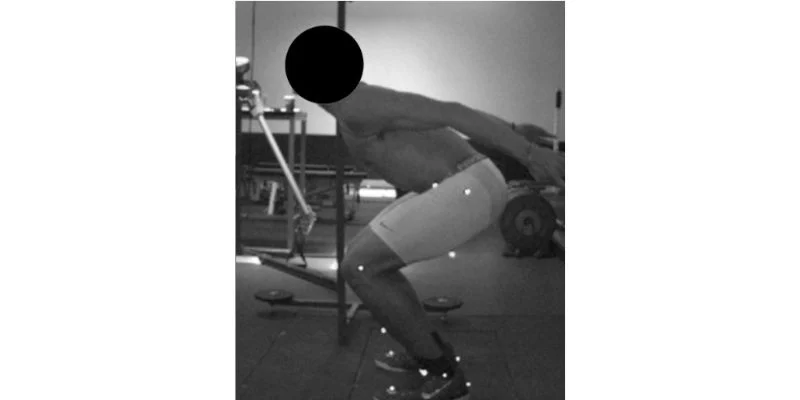
Figure 9. Picture of Hyper Flexor from P3’s “Different Movement Strategies in the Countermovement Jump Amongst a Large Cohort of NBA Players.” Open Access, Creative Commons License here.
The pros for a Bimodal Primary jumper are that they can take the best of both worlds from a movement strategy perspective. They are able to utilize connective tissue more than their Bimodal Secondary counterparts and also access and rely on the big musculature that Unimodal jumpers shy away from. Now this is not to say it is an ideal strategy, but it allows for access to various tissues which could help to accomplish a range of tasks within sport more effectively than other athletes.
The cons? Athletes using this strategy will often struggle with the rate-dependent nature that is often present in sport, especially compared with their Unimodal counterparts. This may be most evident in highly explosive situations in sports, such as a one-on-one between a wide receiver and a defensive back or a guard staying in front of another guard defensively on the perimeter in basketball. I believe the hybrid, Bimodal Primary jumpers are the hardest to distinguish by the ‘naked eye.’ Some may look slightly more elastically-driven, whereas some may have the ability to develop musculature more easily. Jayson Tatum, Jimmy Butler, Lebron James are all examples of what I’d consider Hybrid athletes.

Bimodal Secondary
This curve looks similar to Bimodal Primary with two peaks; a Secondary, however, will have a higher second peak. I believe this shows an extreme inability to unweight (and therefore brake) effectively, leverage almost any energy within connective tissue, and therefore repurpose it propulsively. These athletes want to ‘deal with,’ not utilize, the forces that are created during unweight and braking—and then in almost a separate movement, create propulsion.
If we look at something like an Eccentric Utilization Ratio (Ratio between CMJ and Non-CMJ), these individuals may be at or below 1.0—meaning their Non-Countermovement Jump is as good and in rare cases actually better than their Countermovement Jump (whereas a Unimodal jumper may be 1.2 or even 1.3). In relation to P3’s study, these could be the poor Hyper Flexors and oftentimes your Hip Flexors.
Figure 10. Picture of Hip Flexor from P3’s “Different Movement Strategies in the Countermovement Jump Amongst a Large Cohort of NBA Players.” Open Access, Creative Commons License here.
To be honest, for most sports, I don’t believe there to be many pros to this movement strategy. However, in select situations, like a lineman in American football, you may benefit with this more muscular-driven strategy because of the nature of the position and because of the movement occurring, typically, without a countermovement.
The cons to this movement strategy are probably pretty obvious—the athlete’s rate-dependent metrics are down and typically output metrics are also lower than other strategies. To distinguish your Bimodal Secondary and most muscular-driven movers in a sport like American football, just take a look at the offensive and defensive lines. It is much harder to find them in a sport like basketball, but they do exist!

Metrics
5000 words in and I’m finally getting to what a lot of you probably clicked on the link to read about. I hope that you have taken the time to read everything beforehand and didn’t just skip to this section, because I think there is crucial information in the first sections.
With metrics, coaches need to understand that you can’t just focus on one or even two metrics in order to paint the clearest picture of an athlete’s strategies, strengths, and weaknesses. This is because so many metrics have important relationships to other metrics—and if we don’t explore those other metrics, we can be clouded by the meaning of the metric of choice.
Let’s take at a couple examples:
1. Your athlete’s Modified Reactive Strength (mRSI) is improving!
- In this situation, be sure to look at the two metrics that are within a ratio to summate to mRSI, Jump Height, and Time to Takeoff (in Hawkin terms). Now, what if this increase is because the athlete is getting off the ground much faster but sacrificing jump height to do so? That may not always be a favorable adaptation or manipulation of strategy, but if we just look at mRSI and don’t understand how it can be broken down, we could be misled.
2. What if Time to Takeoff is not changing at all?
- We may be disappointed because we want our athletes to get off the ground faster. Well, by assessing countermovement depth, you may see that your athlete is actually moving through a greater ROM and achieving that new ROM at the same rate in which they previously achieved a shorter ROM. This therefore probably shows an increase in braking ability, with a more rapid unweight. To me, all of this equates as favorable adaptation—but if just looking at TTT, we could be disappointed.
Understand the relationship amongst metrics to better tease out adaptation, readiness, and fatigue amongst your athletes.
1st Layer
I approach examining metrics in two layers. The first I believe to be the most relevant and easily digestible. My first layer of metrics include:
- Jump Height – This will always be a staple metric. It is easy for everybody to understand and shows overall output. As mentioned, this is the one number I report to my athletes after each jump. (Small note: I do report everything in centimeters. Thank you to Cory Kennedy, a former boss of mine, for telling me real sport scientists speak in centimeters not inches!)
- Time to Takeoff + Countermovement Depth – As stated above, the importance of looking at not just TTT but ‘qualifying’ it with Countermovement Depth.
- mRSI – Once we know the components, we can assess mRSI to know if the changes in both of the above metrics equate to move mRSI in the right direction. Hopefully, Jump Height always goes up and TTT always goes down, but oftentimes you may see a subtle drop in one and a small improvement in the other and mRSI ‘qualifies’ that as a productive change or detrimental change.
- Bodyweight – This is important to track for many reasons, but from a force plate perspective, it can be used for a qualifier for all change in metrics that occur. An individual could look like they’ve improved in every single metric, but if they’re 5 pounds lighter today, that may not be ideal and mean favorable adaptation has occurred. (With the one small caveat, that if we are attempting to improve body composition by losing fat mass and then we see an improvement in metrics, then this is a win-win!)
2nd Layer
My second layer of metrics include:
- Peak Relative Propulsive Power – This is a metric talked about in a lot of sports and the correlation to sporting action. Therefore, I believe there to be relevance across multiple domains and within the 2nd layer of metrics.
- Peak Relative Braking Force – I like assessing this metric for overall braking ability. I have also often ranked teams that I work with in terms of highest to lowest in this specific metric and compared to subjective evaluation of on-court athleticism—there seems to be a fairly reliable correlation.
- Peak Relative Propulsive Force – This allows me to see the whole picture, as it is the ‘other side of the curve’ from Peak Relative Braking Force.
- Braking Phase – This really could be included in the first layer with TTT & CM Depth but for simplicity’s sake, I decided to add it by itself in the 2nd layer. I believe this can help to tease out fatigue better than most, because now we are examining the time spent in just the eccentric portion of the movement, where we know that fatigue is typically more easily depicted when compared to the propulsive or concentric portion of the movement.
Conclusion
There you have it. If you would have told me 5 years ago that I’d be able to write a 6000+ word article on just the CMJ on force plates, I would have called you crazy. I say this not to point to my own knowledge, but to the fact that I truly am standing on the shoulders of giants. I am forever indebted to the individuals who have invested in me and continue to invest in me…even when I send them CMJ questions at 2am. They could easily ignore me, or not take the time to have discussions with me, but they do and I truly cannot thank them enough. Because of these people I am where I am today and am lucky that most of them have gone from “boss” or “coworker” to friend. So, thank you Jesse Green, Cory Kennedy, Kyle Sammons, Drake Berberet, and many more.
Force plate assessments may not determine who’s going to be the best at sport, or who’s going to get injured at your next practice, but allow this tool to help paint the picture you are trying to curate with the use of other pieces of technology, conversations you have, and evaluations you run.
As you can tell, I am very passionate about this topic and it feeds directly into my system, The Force System. If you have interest in hearing more about it and/or joining the waitlist for the next Force System Mentorship you can do so HERE. Also be on the lookout for a Force Plate course coming out in 2025 that will put a microscope on the things I spoke about here, training interventions based on force plate assessments, other meaningful tests to run on force plates and much more!
