
During the first 17 years of my teaching and coaching career, I had little interest in privately training athletes. I related this to my experience as a math teacher: while I love teaching math, I didn’t tutor students privately because I prefer to have other mental stimulation after teaching similar content for five hours. The same could be said for training athletes—especially when I was in-season. I just didn’t think I would have the energy for it.
Then COVID-19 hit, and during my daily walks, I continued to run into the same neighbor. He recognized that I was a track coach (possibly because all I wear is Homewood-Flossmoor track and field attire)…and after a few conversations, he convinced me to train his child.
This was a blessing for me, as I needed the mental stimulation and coaching challenge to help fill the void that a canceled season created. Fast forward a couple of years, and I am still in the business of training athletes privately.
This article will not serve as a how-to but, rather, a reflection on takeaways from working through the process. Some thoughts may encourage you to start or continue training athletes privately; others may do the opposite.
Coaching Smaller Groups Has Helped Me Assess My Efficiency with Larger Ones
I coach a track team that typically has around 90–120 athletes, and my group on that team (jumpers) usually includes 20–25 athletes. I am used to working with large groups and managing multiple tasks within the same session. If you talk to most track and field coaches, they will say that they love the entire season, but championship season is extra special. One of the reasons why coaches enjoy championship season (besides the higher stakes) is because the athlete-to-coach ratio is lower.
Due to the design of my business—training 1–6 athletes at a time—I always feel as if I am in championship season during a session. Instead of feeling like I’m juggling 10 flaming bowling pins, I’m juggling three scarves, and it truly makes each session enjoyable.
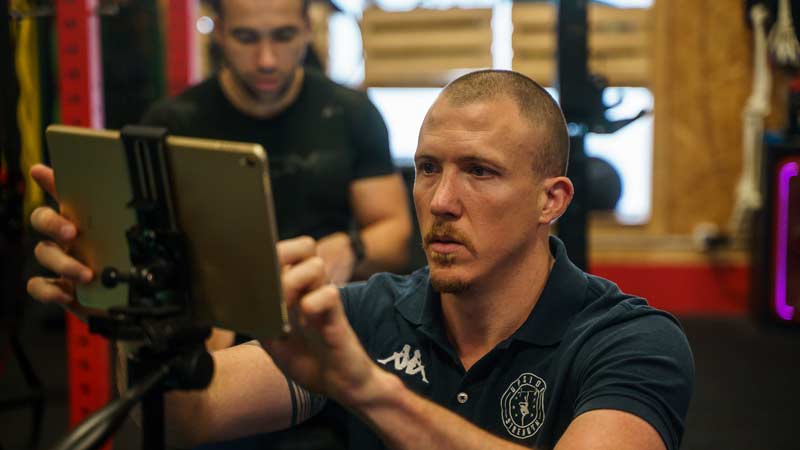
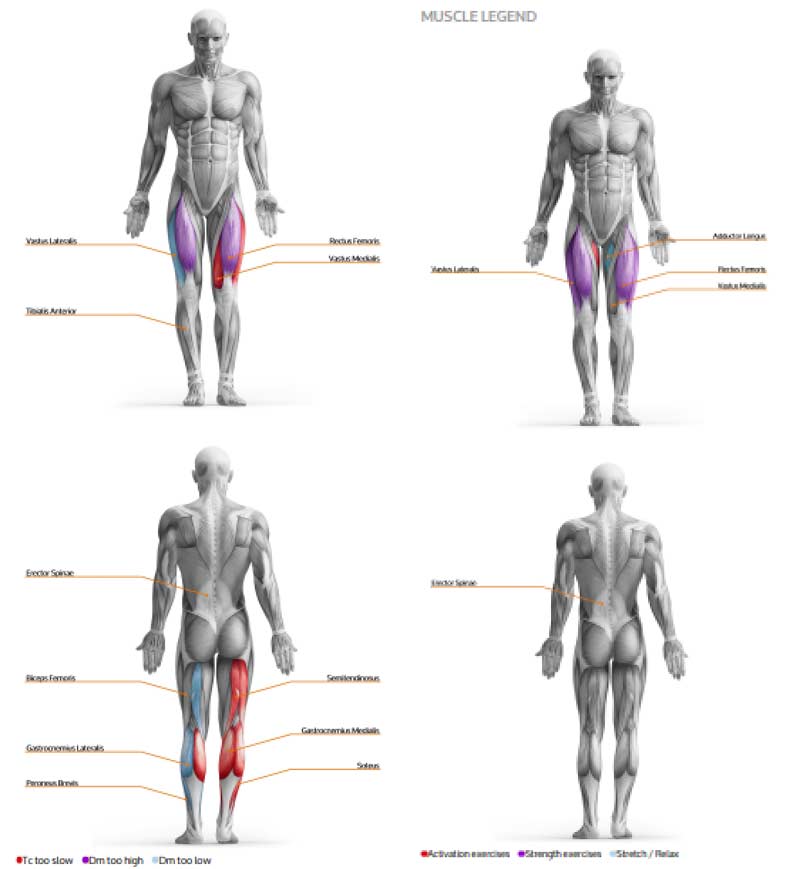
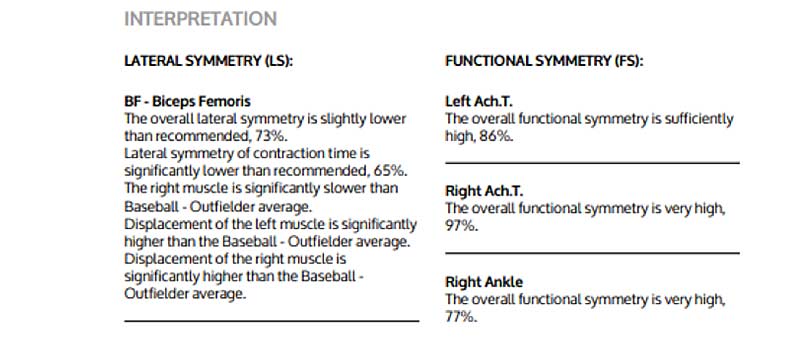
I really feel like the additional practice has caused me to become more efficient in general and, more importantly, allowed me to identify the most critical issues to address for progress to occur. Share on XOne of the difficulties in coaching large groups is giving athletes timely feedback. The large number of athletes I have at track practice means that some of the video analysis and corresponding feedback must be done outside practice time and addressed during a later practice. Due to the smaller numbers I have in the private sector, this is easy to do within the session. While I have been giving feedback based on video during track practice most of my career, I really feel like the additional practice has caused me to become more efficient in general and, more importantly, allowed me to identify the most critical issues to address for progress to occur.
Improved Ability to Manage Training Loads for Track Athletes with Private Coaches
Another reason why I had some apprehension about training athletes privately was because of my experience as a high school coach. There is little more frustrating than an athlete having a fantastic track practice with a maximum velocity focus and then coming back absolutely fried the next day because of the 400 repeat session that was held after track practice with their private trainer.
Communicating with the athlete’s coach helps combat all-too-common issues like this. The coach can provide invaluable information in regard to what they see as strengths and weaknesses and what they feel the athlete needs to be able to do to receive more playing time or a more prominent role within the game plan. Another important question I ask is if the athlete wants me to communicate with their coach—sometimes they don’t, and it is my job to honor their wishes.
Even more important than communication with the athlete’s coach is communication with the athlete. The first four questions I ask each athlete in an individual/small-group session are:
- How are you?
- What have you done lately?
- How do you feel today?
- What’s coming up?
Based on these answers, we then end up doing 0%–100% of what I had in mind for the session. I have a hierarchy of activities based on intensity for common training themes/activities (acceleration, maximum velocity, curvilinear work, change of direction, etc.). Sometimes I have to switch to a different theme than planned; other times, I just work off the hierarchy of the theme that was planned.
To parents and athletes reading this, if your private trainer is not asking similar questions or is working off a prescribed program, that is a huge red flag. These questions are especially important if the athlete is in-season, but honestly, they carry close to the same weight when the athlete is in the off-season. What the athlete may be doing with the team in the off-season or in their physical education class must be considered for maximum gains to occur. While I firmly believe physical gains can happen during the competitive season, the off-season should be where the most occur. Do not let a lack of communication jeopardize gains at any point during the year!
At the end of the day, private trainers do not determine playing time, so potentially causing a conflict between the athlete and coach is doing the athlete a disservice, says @HFJumps. Share on XThe answers to the second and fourth questions can be activities that I deem questionable, but that’s irrelevant. My job is to take what I am presented with and create a plan of action to elicit the best possible outcome. While it may be difficult at times, involving myself in the process of questioning what the athlete is doing in their sports practice or off-season training will not help the situation. I would wave another huge red flag for any private trainer who actively initiates this conversation. At the end of the day, private trainers do not determine playing time, so potentially causing a conflict between the athlete and coach is doing the athlete a disservice.
Having a large toolbox to draw from is the best way of serving a client within the 0%–100% of what you may have planned for the session. It’s helpful to have a range of intensities for activities that focus on a specific issue. Most of my clients come to me to improve their speed. I am a firm believer that sprinting with maximum intent and intensity is the best way to do this; however, sometimes that is simply not an option based on the following:
- The weather (soon to not be an issue for me as my gym will have a Shredmill).
- How the athlete is feeling.
- What’s on the near horizon for the athlete.
Having a large toolbox allows for the session to be productive, even if it cannot be ideal.
-
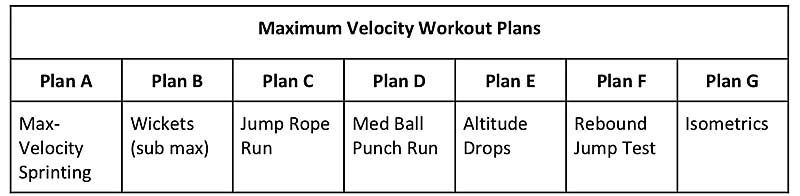
- Max-Velocity Sprinting: The Masters is said to be a tradition unlike any other, and in terms of training, sprinting at maximum velocity is a stimulus unlike any other.
-
- Wickets: Most novice athletes operate at a submaximal velocity when sprinting through wickets. So, wickets can be a great option to rehearse the technical components of top-end speed while ensuring that the nervous system is ready to rock the following day.
-
- Jump Rope Run and Med Ball Punch Run: Maybe the first two items are too intense because the athlete is in a return-to-play scenario. Both of these drills offer the opportunity to utilize foot strike mechanics and postures found during maximum velocity.
- Altitude Drops and Rebound Jump Test: Athletes may be in a situation where the cyclic nature of sprinting causes irritation. These two exercises allow for them to still be challenged with large forces.
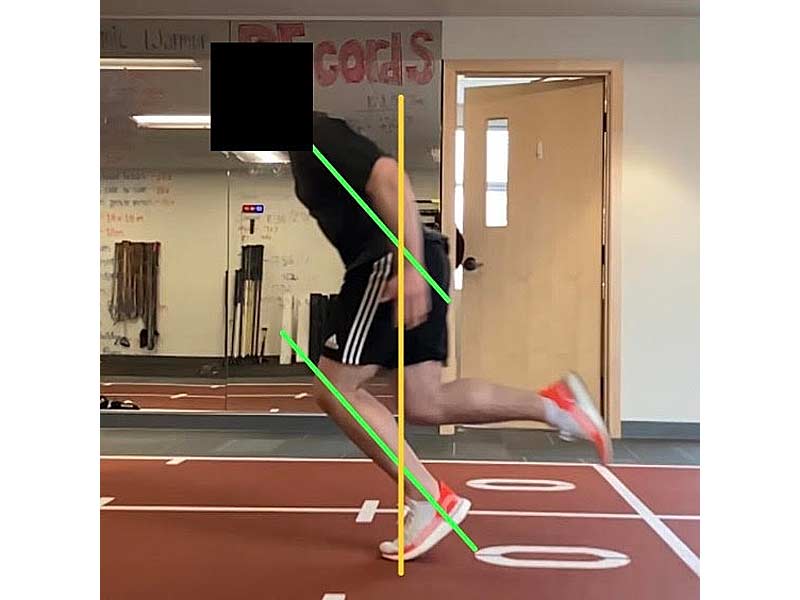
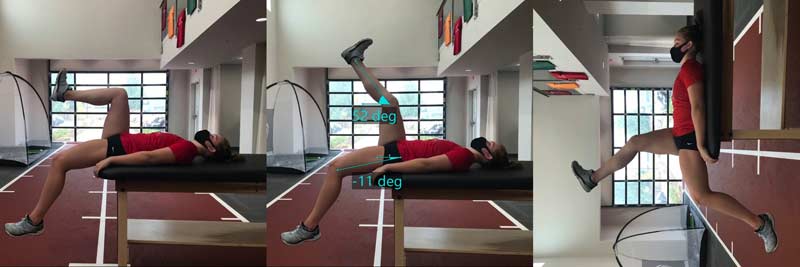
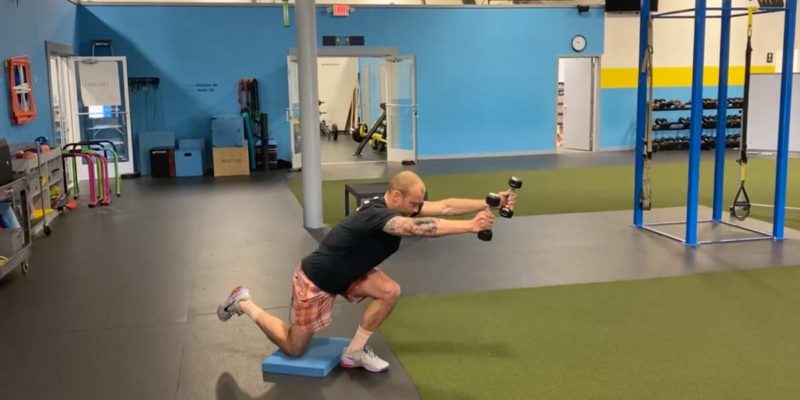
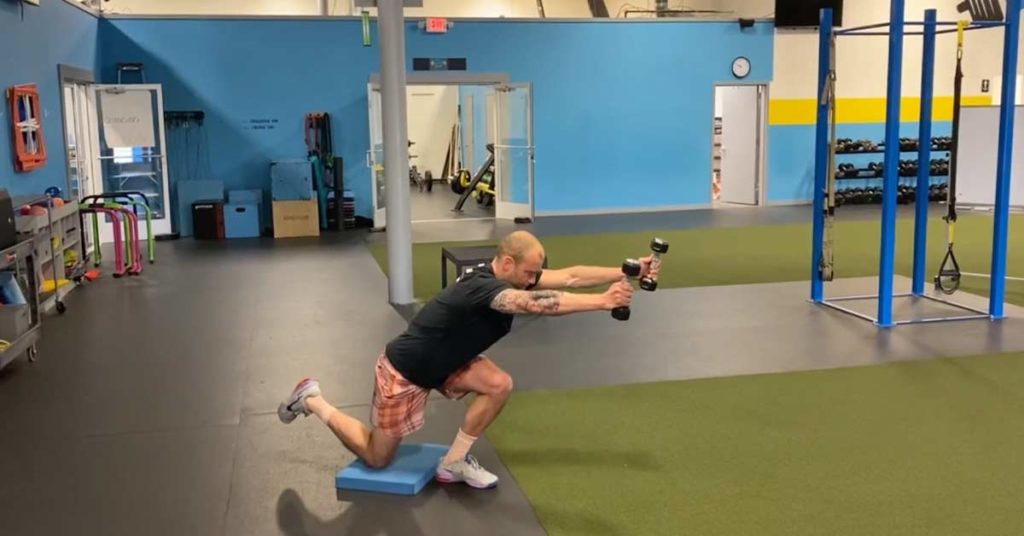
Video 1. An example of an athlete performing an altitude drop, which is a fantastic way to allow an athlete to express force eccentrically. Coaches can match the angles found in the landing position with the training target. If it were maximum velocity, I would look for less bend in the knee and hip.
- Isometrics: My preferred method of isometrics is of the “extreme” variety, which involves an active action by antagonist muscle(s). It can be argued that even though the amount of movement is often minuscule, it is still considered high-velocity exercise.
The clients who have made the most progress are the ones I have seen at least twice per week. I understand this is not feasible for some athletes for a variety of reasons, so I do my best to devise an individualized plan for them to follow based on their entire workload. “Homework” can increase the rate of progress, but it does not replace in-person sessions. I know trainers who will not take on clients who cannot commit to meeting at least twice a week. While I don’t do that, I understand their position, and it may make sense for you!
4 Logistical Considerations for H.S. Track Coaches Pondering Private Training
There are other concerns you should be aware of if you’re considering starting to privately train athletes. These are less development-focused and more business-oriented.
If you’re starting to privately train athletes, you should open a separate bank account, start an LLC, obtain insurance, and have them sign a waiver, says HFJumps. Share on X-
- Open a bank account. Do your best to run all of your financial transactions out of it. This makes it easier when tax time rolls around. Also, take advantage of the tax write-offs owning a business affords you! It is never a bad idea to talk to an accountant about this.
-
- If you are going to train people out of your home, start an LLC (or something similar). I used Legal Zoom. The LLC offers protection in case you get sued. Put simply, it separates your personal assets from your business assets.
-
- Obtain separate insurance. My uncle is a vice president of an insurance company. Instead of obtaining insurance through the company he works for, he advised me to use K&K Insurance. They offer $1 million in coverage for under $250. You can obviously go in whichever direction you want with an insurance provider, but this at least gives you a point of reference.
- Consider having clients fill out a waiver. My wife is a lawyer—she tells me waivers are essentially useless. However, you may still want to use one for a small level of protection. A simple internet search on “personal training waivers” is a good place to start.
Whether you’ve been in the private game for a while, are new to it, or are considering getting into it, I hope some of the items mentioned here have sparked some thought. Since I am new to it myself, I would love for the comments to be filled with additional pieces of advice!
Since you’re here…
…we have a small favor to ask. More people are reading SimpliFaster than ever, and each week we bring you compelling content from coaches, sport scientists, and physiotherapists who are devoted to building better athletes. Please take a moment to share the articles on social media, engage the authors with questions and comments below, and link to articles when appropriate if you have a blog or participate on forums of related topics. — SF