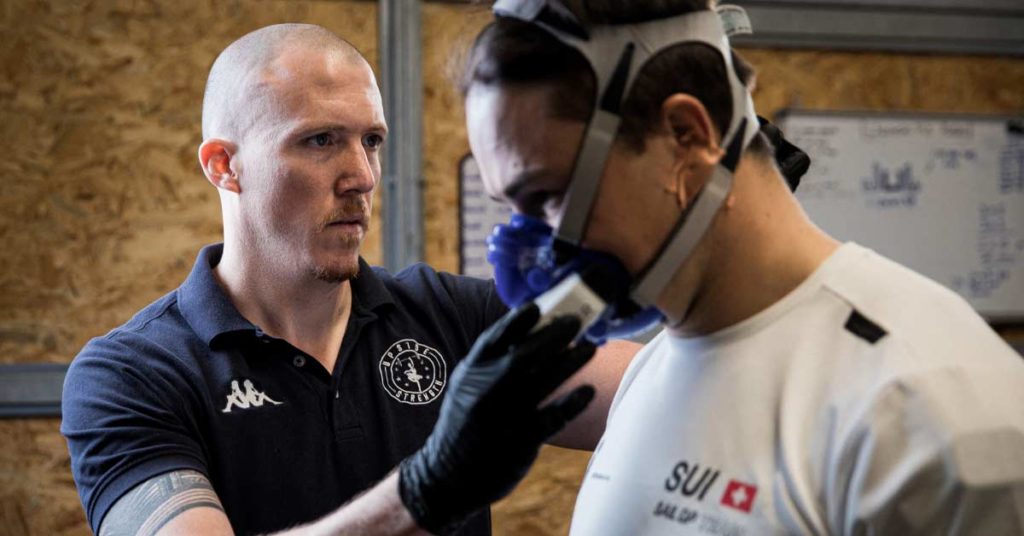
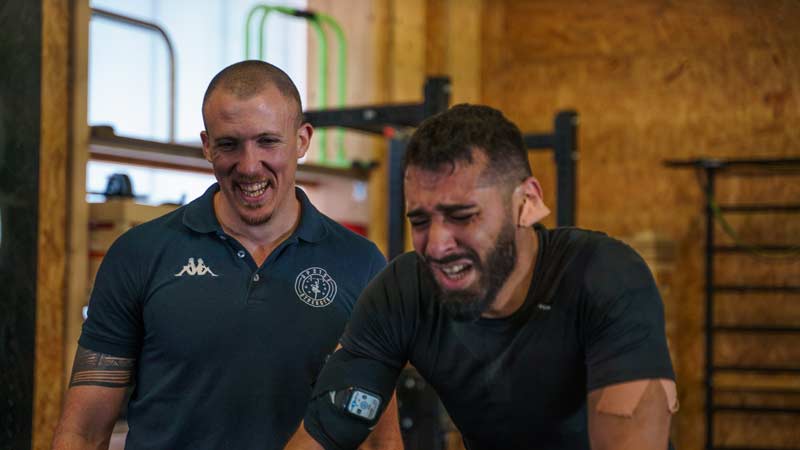
As I like to tell the athletes who undergo physiological testing with me, “this test is like a really long warm-up with 10 minutes of pain at the end.” On the last couple of steps, you can expect burning legs and lungs while your heart beats close to its maximal frequency.
When you go to the lab to get testing done, that’s usually what you remember: the pain and discomfort you experienced as you neared the end of your ramp or step test.
But behind this veil of sensory overload, there is a tremendous amount of information that we, as coaches, can collect through physiological testing.
There is a tremendous amount of information that we, as coaches, can collect through physiological testing, says @SeanSeale. Share on XThe purpose of this article is to share how I use a physiological profile test to individualize, optimize, and orient the conditioning training of the athletes I have the opportunity to work with.
The first section briefly introduces the intensity spectrum—the different physiological thresholds, intensity domains, and training zones—which will make the rest of the article easier to understand and follow. Even if you don’t have extensive exercise physiology or conditioning knowledge, this first part will provide a strong foundation to understand these concepts.
The second section explains what a physiological profile is, why it is useful to track our athletes’ fitness, and how that data can help us coaches make better decisions regarding training interventions and program design.
In the third section, I describe in full detail which test protocols I use and why I chose them over other available options. This section also covers which measurement tools I use to complete the physiological profile as well as their respective strengths and weaknesses. (In the interests of transparency, I’d like to mention that I collaborate with and am affiliated with Moxy Monitor, VO2 Master, and Breathe Way Better.)
This article wouldn’t be complete without including my process for interpreting the data collected during the test and how I organize it into a report for both the coach and the athlete. This will be covered in the fourth section.
To finish, I will provide some practical examples around training recommendations and planning for different types of athletes I’ve worked with and what results they achieved.
Section 1: Defining Thresholds, Intensity Domains, and Training Zones
Before we delve into the physiological profile and what it entails, we must establish some common ground and make sure we speak the same language. Let’s kick things off with a few definitions.
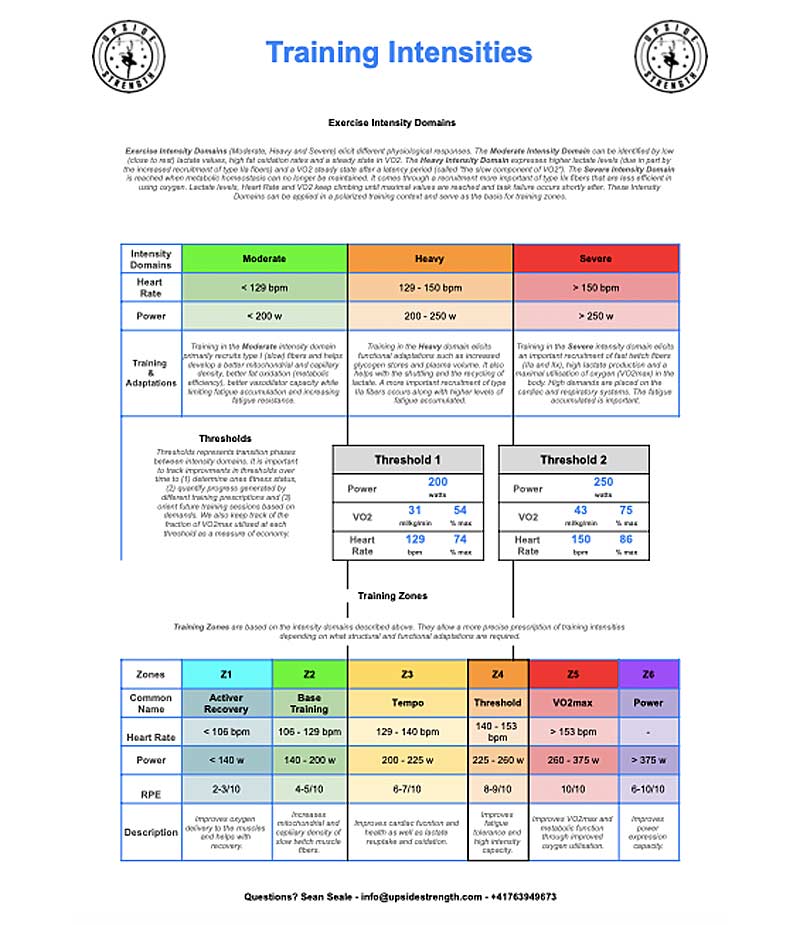
The term “threshold” gets thrown around a lot in conditioning and endurance circles, but it is seldom defined. Although it’s important to acknowledge the dynamic nature of thresholds, for simplicity’s sake, we will define a physiological threshold as representing the point of transition between two different intensity domains.
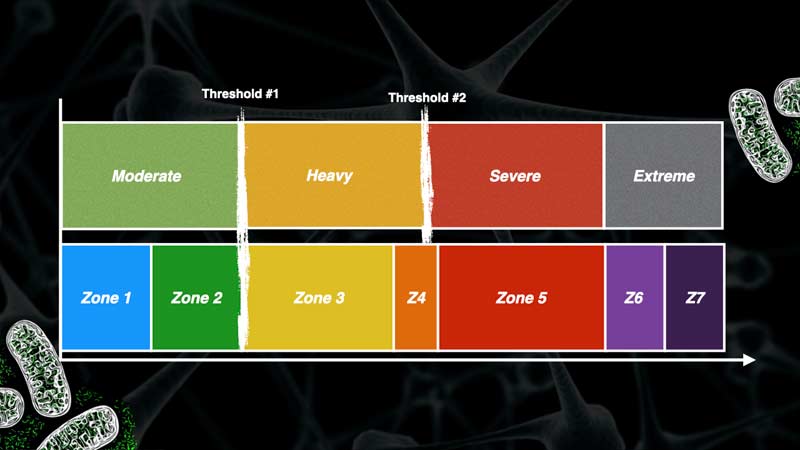
There are two primary thresholds (threshold 1 and threshold 2) that can each be measured at different levels of the organism, resulting in many other (and often confusing) names used to qualify them. The illustration below summarizes the most common terms used to define those two thresholds.
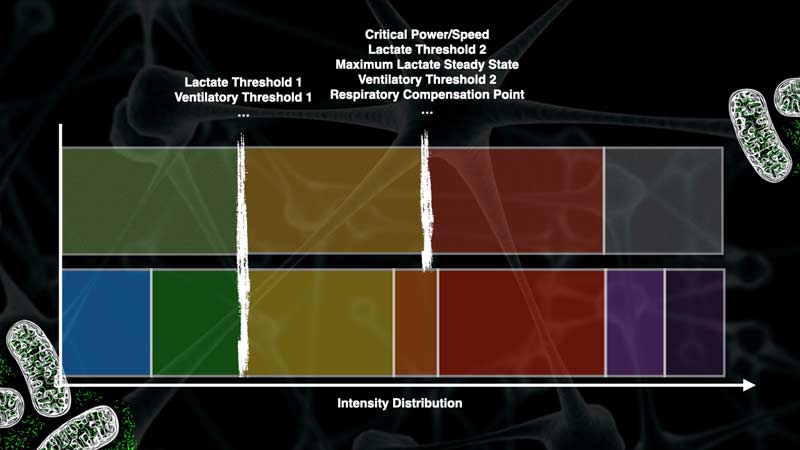
There are four exercise intensity domains. An intensity domain is an intensity range that elicits a distinct physiological response, commonly centered around the VO2 kinetics, or simply put, the way that the trend of oxygen uptake behaves in the body.
In the moderate domain (below threshold 1), oxygen uptake reaches a plateau shortly after exercise onset. In the heavy domain (between thresholds 1 and 2), we can observe a “slow component” or delayed steady state in VO2.
In the severe domain (above threshold 2), the slow component never settles, and if the activity is carried out for long enough, the athlete reaches their VO2peak and task failure shortly after. The extreme domain is characterized by intensities so high that the subject reaches task failure before manifesting their VO2peak (peak oxygen uptake).
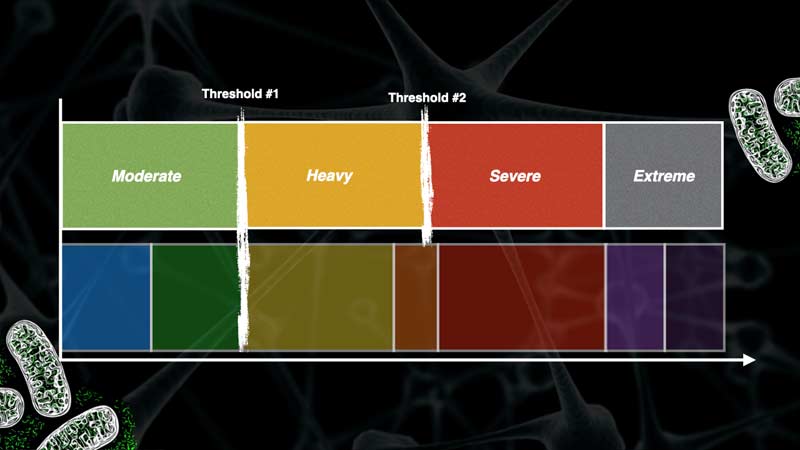
Together with thresholds, these concepts form a practical model to individualize the training intensity distribution of our athletes accurately. Since training in different domains triggers different physiological responses, we can use this model to target the specific intensity that will, in turn, elicit the training adaptations we’re looking for.
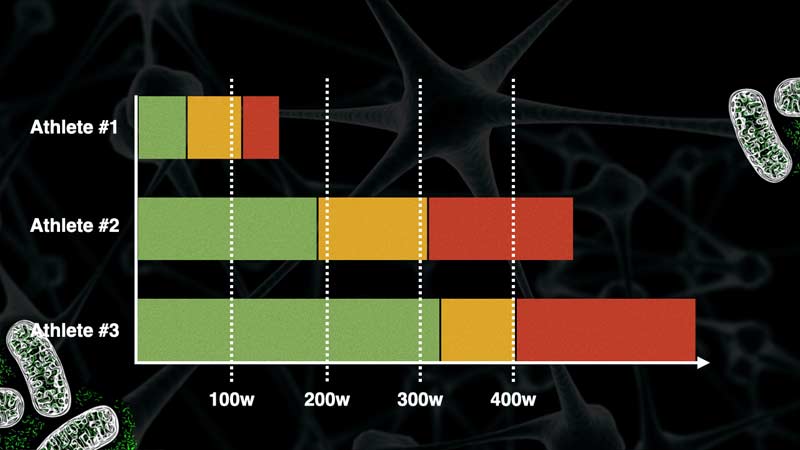
Once we have defined thresholds and domains, we can cut these up into training zones to simplify training prescription and application. As Jem Arnold stated, “intensity domains are descriptive while training zones are prescriptive.” Different coaches use different numbers of zones; I will be talking about seven distinct training zones.
You can also learn more about thresholds and training zones here.
Section 2: Defining the Physiological Profile
Now that we have a common understanding of what those terms mean, let’s talk about the physiological profile, what it is, why it’s important, and what it’s composed of.
What Is a Physiological Profile?
A physiological profile is a test (or series of tests) that allows us to measure and analyze an athlete’s unique conditioning profile within a given modality. If we want to plan training intelligently, we can gain a significant advantage by knowing what is going on “under the hood.” Referring to section 1, we want first to define the athlete’s thresholds, intensity domains, and training zones.
We also want to know the athlete’s respiratory capacity, how they use it (respiratory coordination), how much oxygen they consume at different intensities, and how metabolically efficient they are.
Using the data collected during a physiological profile and knowing the athlete’s needs, we can make informed decisions on how to orient their training relative to the adaptations we seek to elicit. Share on XBy using the data collected during a physiological profile and knowing the athlete’s needs (sport, competition calendar, strengths/weaknesses, etc.), we can make informed decisions on how to orient their training relative to what adaptations we seek to elicit.
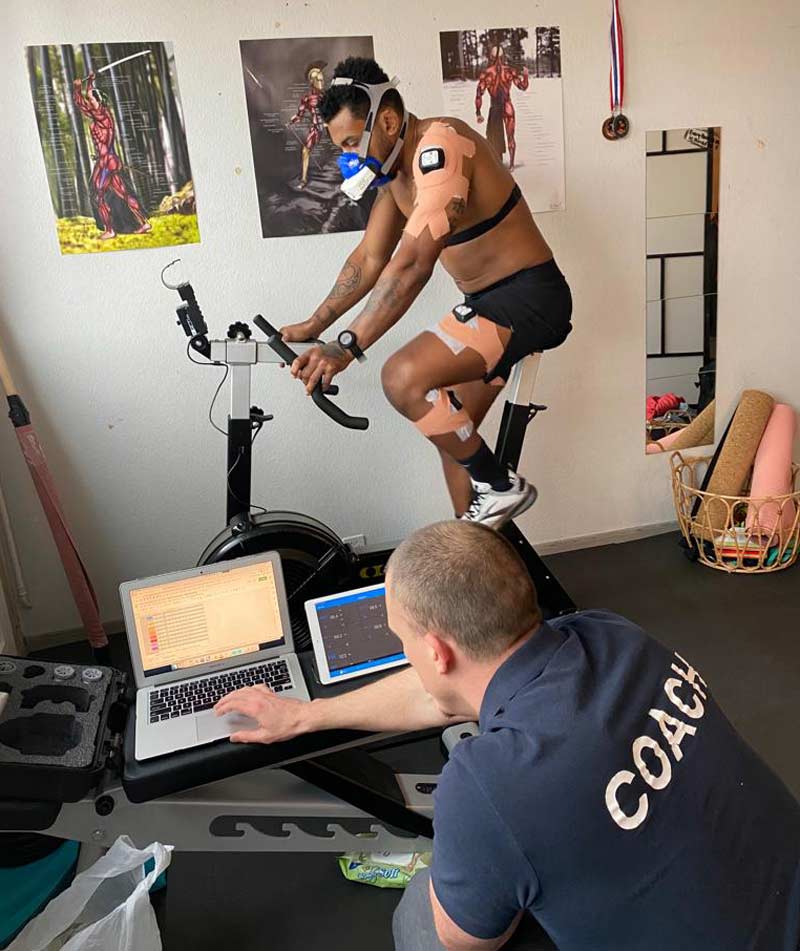
For this article, I’ll refer to testing being done on a bike. I like using the Concept 2 BikeErg for its versatility, simplicity of use, and availability in local gyms. Since I’m working primarily with CrossFit and combat sports athletes at the moment, this modality works quite well.
Why Is the Physiological Profile Important/Useful?
Conditioning training is often prescribed on the basis of heart rate zones given as percentages of the athlete’s maximal heart rate. To draw a parallel to strength development, this is the equivalent of prescribing squat weights as percentages of the athlete’s body weight. For some, it will be right on the money, but for the vast majority of people, it will either be too high or too low.
To give a concrete example of this, the percentage of max heart rate equivalent to threshold 1 (or the transition from zone 2 to zone 3) in the athletes I’ve tested so far ranges from 65% to 85%.
This is why it’s imperative to establish an athlete’s individual intensity profile. We want to be sure that the training we program is the stimulus needed on an individual basis to drive specific athletic and physiologic adaptations.
Fixed percentages of max heart rate are not only an oversimplification, but they also don’t reflect the adaptive nature of human physiology.
As you train consistently over time, your physiology (hopefully) changes. This has to be reflected in your individual intensity profile for your training to stay “true” to your abilities.
As you train consistently over time, your physiology (hopefully) changes. This has to be reflected in your individual intensity profile for your training to stay ‘true’ to your abilities. Share on XSo first and foremost, a physiological profile provides us with the athlete’s unique intensity distribution profile. This is then organized into training zones for practical reasons. The zones will usually be defined through power/speed AND heart rate values to help with programming, progress tracking, and autoregulation when necessary.
In addition to providing individualized training zones for the athlete, the physiological profile will also help our decision-making process when deciding what qualities need to be developed in that athlete. Knowing “what to do next” has to be contextualized relative to the competition calendar and time of the season, but if we can SEE where our athlete is strong and where he needs work, this does help us program in a more coherent way overall.
Another benefit of the physiological profile is that it provides us coaches with a substantial amount of data that can be tracked and compared over time.
It’s also a great way to know if your training interventions are ACTUALLY making your athletes better. And more specifically, what aspects of their physiology you’re able to change/improve through specific training means.
Now that we understand how a physiological profile can benefit you and your athletes, let’s look at the testing protocols and why we’re using them.
The Testing Protocol
The physiological profile I’ve been performing with endurance athletes, CrossFit athletes, and combat athletes alike consists of three main parts that each serve a specific purpose.
-
- The critical power test provides us with performance metrics and helps calibrate the step test. It also informs us on the athlete’s athletic profile (endurant vs. powerful).
-
- The spirometry test gives us the athlete’s respiratory capacity.
- And finally, the 4-1 step test is where most of the physiological data is collected to create the athlete’s full physiological profile.
Now let’s look at each of these in more detail.
Critical Power, or the Power-Duration Relationship
The athlete does this first part autonomously before meeting with me. This helps us establish some performance metrics, informs us of the athlete’s athletic profile, and calibrates the longer step test where most physiological measurements will take place.
In case you’re unfamiliar with the notion of critical power, it’s the intensity above which you can no longer maintain your metabolic homeostasis (or internal balance). That is not to say that no fatigue is experienced below critical power, but once you cross that “threshold,” the effort simply elicits a different kind of fatigue.
To learn more about critical power, I recommend this fantastic video by Mark Burnley.
Critical power will usually be close to your best 30-minute to 60-minute power on a bike or 10k pace on a run (in which case we call it critical speed).
To find that critical power, I use a 3-minute and a 12-minute test performed on separate days, as described in this research paper. (The equivalent test for running is a 1200-meter and a 3600-meter effort done for time, as described here.)
The reason I’ve decided to use this method is simple: It’s easy to apply, and everyone can do it with virtually no equipment. If we want to increase the accuracy of the method, we can get the athlete to perform those same tests a few days later, which will help them express their full potential through better pacing. But since the primary role of this stage is to ESTIMATE critical power and calibrate the step test, I usually stick with one trial on each effort the first time around.
Once the athlete has completed their 3-minute and 12-minute efforts (or 1200-meter and 3600-meter efforts for a running test), we can calculate their critical power and W’ using their average watts at each effort.
W’ is a fixed amount of work (expressed in Joules or kJ) that one can perform above critical power. Think of it as a savings account. Below critical power, internal homeostasis is maintained (the checking account is doing its job), and the savings account isn’t needed. But once we exceed the capacity of the checking account, we have to dip into our savings. That’s W’ in a nutshell.
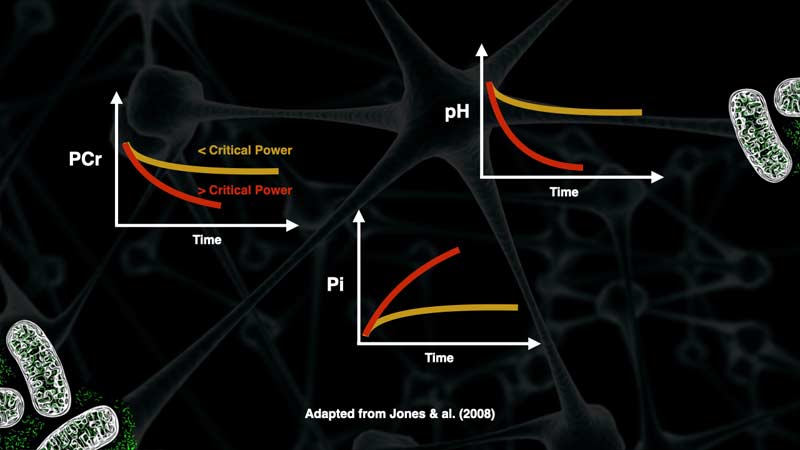
Image 7. Metabolic reactions above and below critical power. Adapted from Jones et al. (2008).
Knowing an athlete’s W’ can be a precious piece of information to help us plan HIIT and orient training, especially if we have such data for multiple athletes in a given sport. Given that two athletes with similar critical powers can have very different W’ values, this should be reflected in our programming and what we can expect to see in training and competition from each athlete.
So, we’ve now determined the athlete’s critical power and W’ via the 3-minute and 12-minute tests. We have gained some insights into their athletic profile (endurant vs. powerful) and can use the data collected to help us calibrate the step test.
Before we talk about the step test, how it’s built, and how to calibrate it, let’s look at why I also include a spirometry test in my protocol and what this data can add to the global picture.
Spirometry Test
Spirometry is the most common type of pulmonary function test. This test measures how much air the athlete can breathe in and out of their lungs as well as how fast they accomplish this movement.
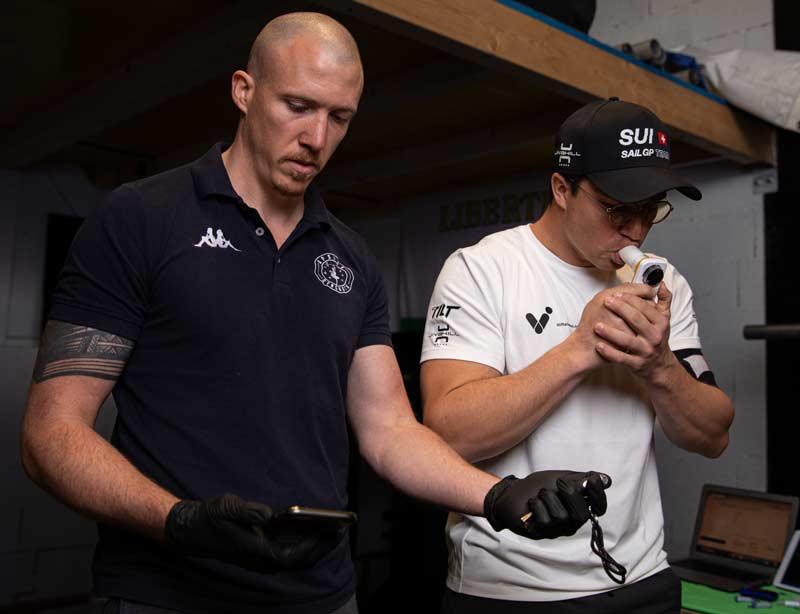
Since we will be measuring ventilation (or how the athlete breathes) during the step test, we need to have a reference point to interpret this data. Without knowing how much lung capacity the subject possesses, it’s impossible to say whether the way they breathe is optimal or not, let alone determine what should be done about it.
In addition to helping us interpret ventilation data, the spirometry results inform us about the athlete’s lung capacity relative to their size and weight. The app comes with a database built in that enables us to compare the athlete’s data to their corresponding demographic. That way, we know if they are presenting with a respiratory capacity limitation or not.
The 4-1 Step Test
The protocol I use is an intermittent step test composed of four-minute constant load intervals interspersed with one minute of passive rest. The ideal test goes on for 9 to 11 intervals where the athlete reaches task failure at the end of the last step and is unable to start again. Note that I only care about completed intervals for reasons I’ll come back to when discussing data collection.
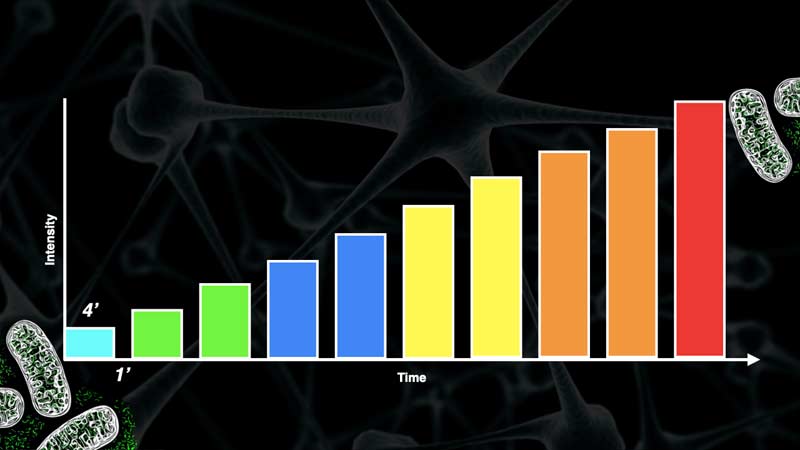
I settled on four-minute intervals because it’s long enough to allow for all physiological systems to reach a balance while keeping the total test time under one hour.
When we start a constant load effort, it takes between 90 and 120 seconds for the oxygen delivery (respiratory and cardiac) and utilization (metabolic) systems to find their equilibrium. By using four-minute intervals, I’m able to observe what happens to the different metrics collected in the last two minutes of each step in a balanced state.
The minute of rest allows me to take a clean lactate measurement on the athlete while also observing their heart rate and muscle oximetry recovery kinetics.
Back to calibrating the steps.
Calibrating the step test is one of the most critical parts of the system I’m presenting in this article, says @SeanSeale. Share on XIn my opinion, calibrating the step test is one of the most critical parts of the system I’m presenting in this article. Through trial and error, I’ve figured out that setting the eighth step to be equal to the CP value calculated for the athlete at hand usually works quite well. Athletes often complete two steps above their critical power, which lands us right around that “ideal” 10-step mark.
If the test is much shorter than the 10-step target, the gaps between each step might be too big, and the data collected might not give as precise a picture as we hoped. On the flip side, if the test runs for much more than 10 steps, we’re looking at a test that exceeds one hour in length. This would be suboptimal from a logistical standpoint but also in terms of accumulated fatigue for the athlete, who might not be used to these types of efforts.
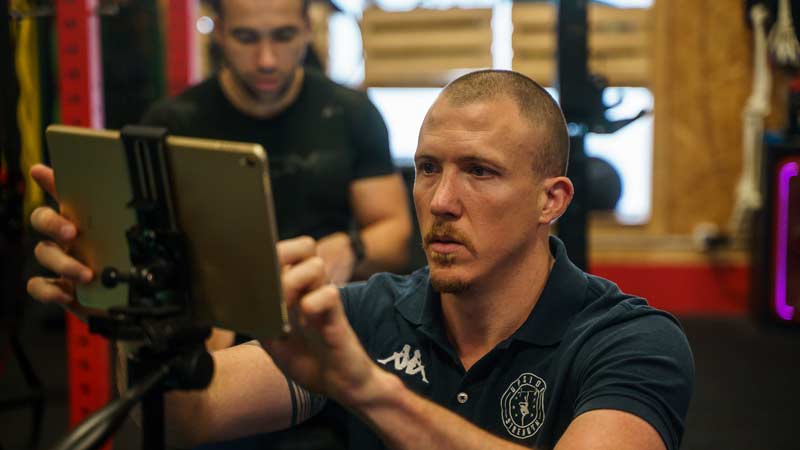
The starting power of the step test will usually fall around 35% of the athlete’s calculated critical power. When testing on the bike, I also look at relative power (watts per kilogram) to pinpoint the appropriate starting power for each athlete. The spectrum of power on the first step of the test ranges from 0.5 w/kg to 1.5 w/kg, depending on the conditioning level of the athlete I’m testing. Someone completely out of shape will start at 0.5 w/kg, while an elite cyclist would use 1.5 w/kg as their first step power.
When in doubt, I get the athlete to spin on the bike at a low power until their heart rate settles at 100 beats per minute. I then use this power value at the start of the step test.
When performing a running test, I start all non-elite runners at 6–7 km/h.
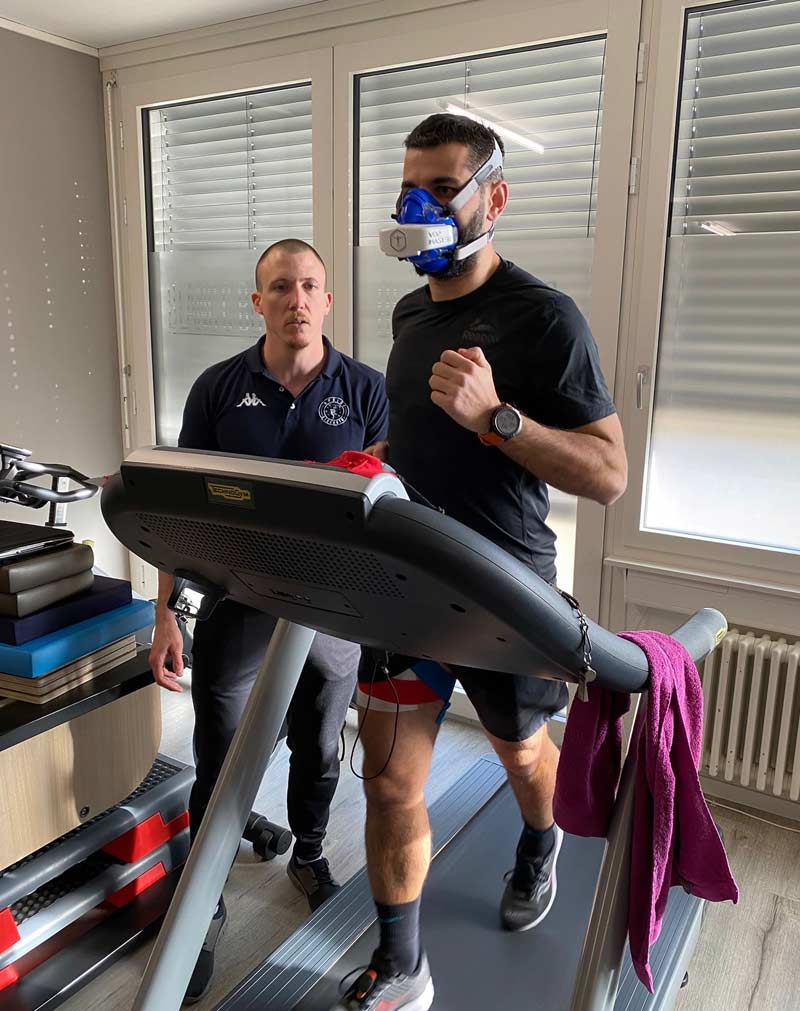
As you can see, calibration isn’t an exact science, but the general rule of thumb is that the starting power should be on the low end. If we start too high, we will miss some important information about the athlete’s physiology that is pivotal in individualizing and optimizing their training.
I think it’s important to highlight that this is ONE testing protocol available among many others. Each coach needs to find the protocol that makes sense for the data they wish to collect while respecting the constraints within which they operate. Know your protocol’s strengths and weaknesses, and you will always collect better data than if you try just to grab “the best protocol” off the shelf.
Now we know HOW the test will take place. Let’s look at WHAT tools I use to collect physiological data during the 4-1 step test.
Section 3: The Measurement Tools
Over time, I’ve added different tools to my assessment arsenal.
Here, I’ll give an overview of the gear I use, what I like about it, and what kind of limitations I need to be aware of when using it.
Polar H10 Chest Strap
Heart rate data is the most accessible physiological measurement out there, and you should collect it whenever possible. In the context of building the athlete’s complete physiological profile, heart rate is a central metric to assess cardiac function and prescribe training intensities that will correspond to specific internal states.
I’ve been using the Polar H10 with great success for some time now. It’s currently the best HR belt out there relative to its price, and it has a hidden (or seldom-mentioned) feature that enables you to sync it to more than one app at a time. This can be a handy feature.
MIR Spirobank Smart
As I described earlier in the article, using a spirometer is a simple and fast way to assess an athlete’s respiratory capacity. After a couple of trials with other devices, I’ve settled on the MIR Spirobank Smart. This compact tool comes with single-use turbines for better hygiene and safety.
The dedicated mobile app requires you to input your personal information (weight, size, height, origin, etc.) so that it can compare spirometry results to its database.
VO2 Master
The VO2 Master is a fantastic piece of equipment that opens the door to measuring and analyzing ventilation and VO2 in real time without the constraints of bulky lab equipment. The VO2 Master Pro connects directly to its dedicated mobile app via Bluetooth and is calibrated through regular breathing in under two minutes. After that, you can see breath-by-breath data of oxygen consumption, respiratory frequency, and tidal volume (volume of air per breath) streamed through the app.
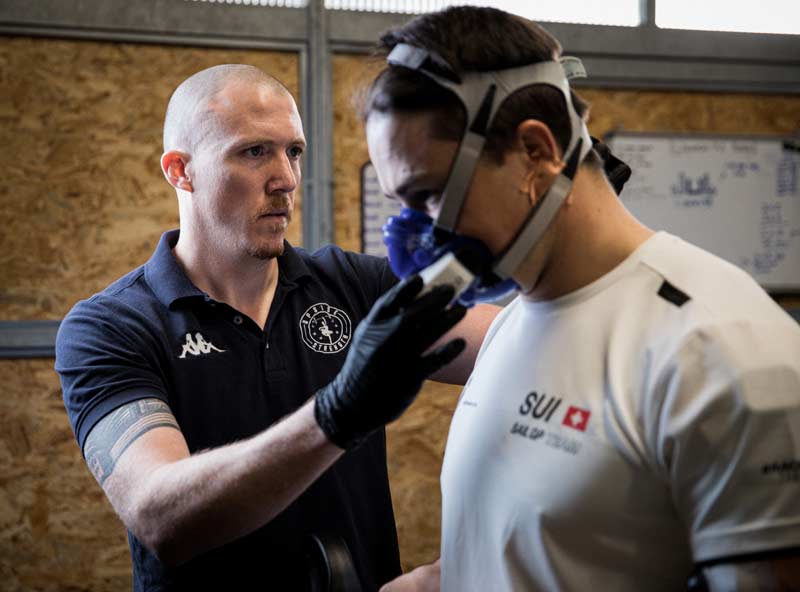
As mentioned in the spirometry section, knowing how someone breathes at different intensities and relative to their lung capacity helps us give specific recommendations where appropriate.
VO2 is a measure of how much oxygen the body absorbs, transports, and utilizes per unit of time. This allows us to calculate an athlete’s economy (“cost of effort”) and also determine the percentage of VO2 that is being utilized at each threshold (called fractional utilization).
VO2 measurements can also be combined with ventilation data to help pinpoint ventilatory thresholds, which we will discuss in the following section.
One weakness of the current VO2 Master unit is that it does not (yet) possess a CO2 sensor. Expired CO2 provides important information regarding substrate utilization (fats vs. carbs) as well as additional information regarding respiratory thresholds. This feature is being worked on as I write this blog post, and it is much anticipated for future testing.
Moxy Monitor
The Moxy Monitor is a NIRS device. NIRS stands for near-infrared spectroscopy, which measures the balance between oxygen delivery and oxygen utilization at the level of the muscle capillaries. This tool can be used to measure muscle oxygen saturation locally (when placed on a locomotor muscle) as well as systemically (when placed on a non-involved muscle).
When testing athletes on a bike, I often place a Moxy on each vastus lateralis (locomotor muscle group) and a Moxy on each shoulder (non-involved muscle group). For runners, the rectus femoris and the forearms are usually a great choice.
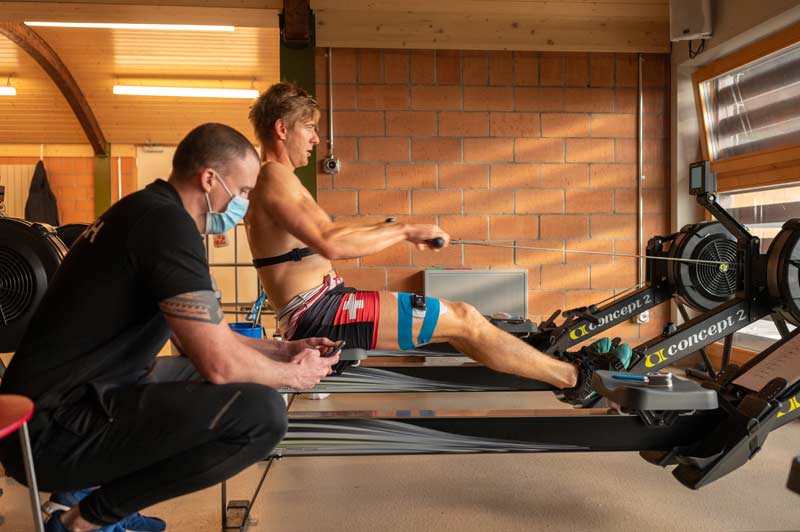
Moxy data trends show some interesting correlations with lactate and ventilation/VO2 data regarding threshold determination. More on that in the next section of the article.
A current weakness of the Moxy Monitor (along with other NIRS devices in the context of exercise physiology) is the lack of consensus surrounding the interpretation of the data collected. Although there are some exciting papers and projects in the works, more collaboration between the protagonists in this field needs to take place for a more practical application of the data to emerge.
Lactate Scout 4
The Lactate Scout 4 is a lactate analyzer. This tool measures blood lactate concentration (BLa) via a small droplet of blood taken from the athlete’s earlobe or finger, in this case, at the end of each work interval.
Contrary to common belief, lactate is not a harmful by-product of metabolism but an important fuel source and signaling molecule for the human body. An excellent summary of our current understanding of lactate can be found in this paper.
Blood lactate is the difference between the lactate produced by the body through glycolysis and the lactate recycled by our mitochondria. BLa does not give us any information on lactate production or clearance rates.
The weaknesses of lactate measurements reside primarily in the measurement procedure itself, as each blood droplet can be contaminated by sweat or skin tissue. This usually results in a BLa value much higher than expected. Another drawback of this method is the numerous interpretation methods that exist to analyze a lactate curve. This will become rather clear in the next section of this article.
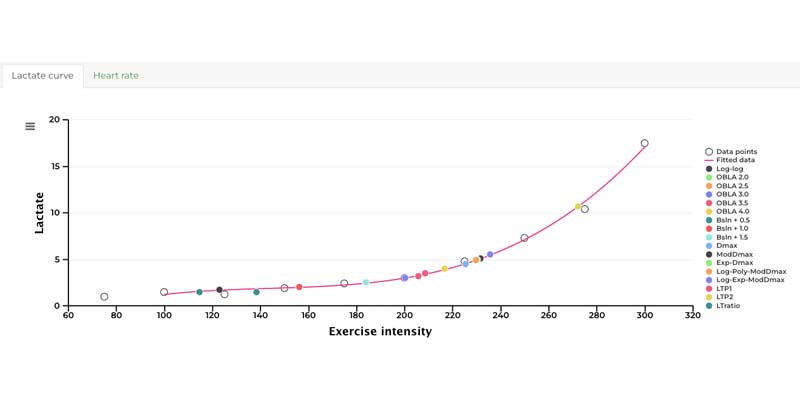
Image 14. Lactate curve with possible interpretations from ExPhysLab.com.
Rating of Perceived Exertion
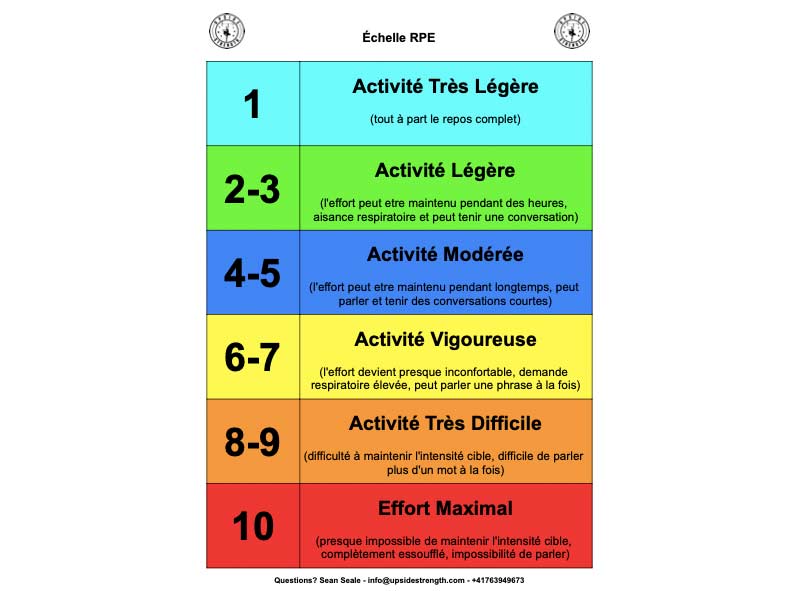
Despite the subjective nature of RPE, I believe it to be one of the most important metrics that a coach can collect during a training session test. As exemplified by Alex Hutchinson in his fantastic book Endure, effort perception might well be one of the most essential factors in sports performance, especially in events and disciplines practiced over longer time domains.
Despite the subjective nature of RPE, I believe it to be one of the most important metrics that a coach can collect during a training session test, says @SeanSeale. Share on XI use a simple 1 through 10 RPE scale that includes descriptions of effort perception and respiratory status (inspired by Daniel Crumback’s work) to guide the athlete in choosing the rating that matches their sensations. It’s also a good add-on since some athletes have difficulty “listening to themselves.”
Now let’s look at what I do with the data we collect using the above tools.
Section 4: Interpreting Test Results
Once the athlete has completed the tests, it’s time to look at the collected data and, more importantly, interpret it.
From experience, I can tell you that the last thing athletes and coaches want following a physiological test is a bunch of raw data thrown at them. Instead, what they want (and what they should get) is actionable information to help them individualize, optimize, and orient training in the best way possible.
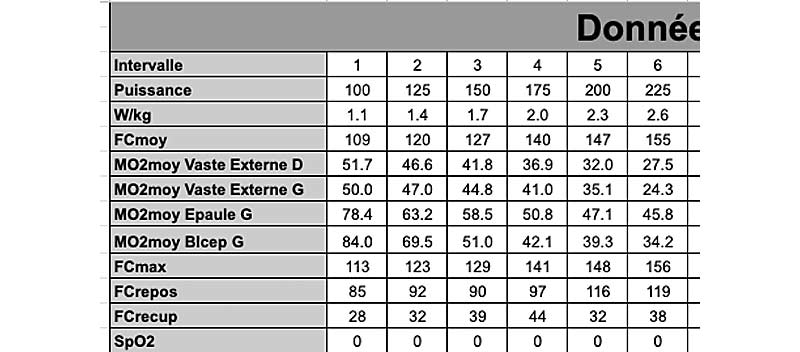
The data interpretation process is pivotal to bridging the gap between the “lab” and the “field.” Here’s how I proceed through it.
Thresholds and Intensity Distribution Interpretation
As we’ve seen in section 1, it’s important to determine an athlete’s individual intensity profile if we want the training to be practical and match the athlete’s current abilities. To do so, we have multiple data sets and methods of analysis at our disposal to define thresholds and break up the intensity spectrum into distinct domains.
What I do first is look at each data set independently from the others and figure out where the inflection points (or thresholds) are.
For lactate, I’ll use the Bsn+0.5 method for threshold 1 and the Modified DMax method for threshold 2. A great tool for this is ExPhysLab.com.
For VO2 and ventilation, I look for inflection points in their relationship, as shown below, and match them up with the correct intensities.
For the Moxy Monitor data, I look for distinct changes in trends from step to step. I also look at the non-involved muscles and how the oxygen trend behaves, which can often inform me about intensities taking place above threshold 2.
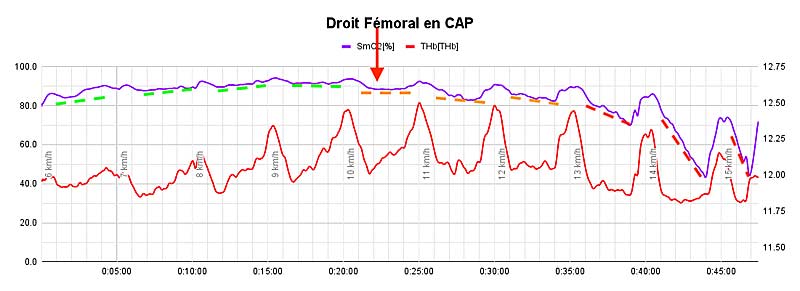
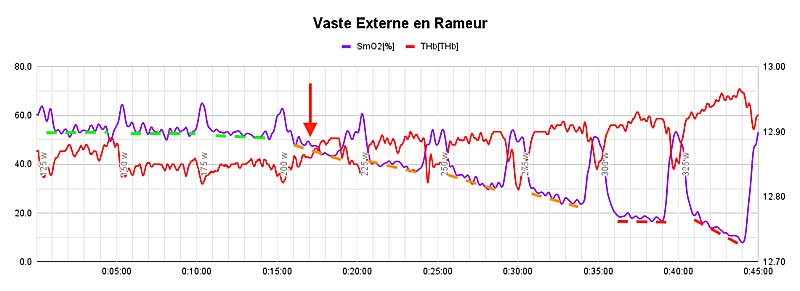
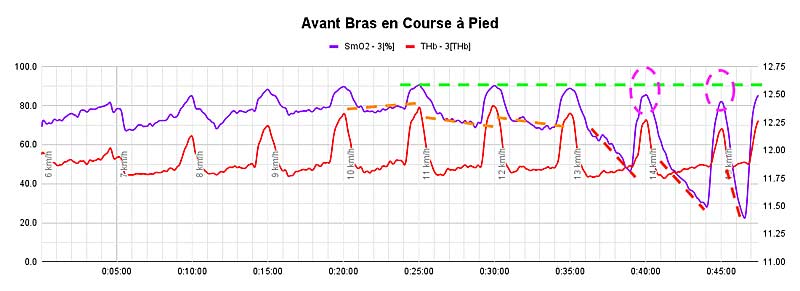
I also consider the critical power calculation as a reference for the second threshold.
Once I’ve looked at the different data points cited above, I draw my interpretation of threshold 1 and threshold 2 relative to power, heart rate, and percentage of VO2max for that athlete.
This intensity distribution profile is then cut up further into training zones to render the information as practical as possible for both the coach and the athlete.
Some might say I should stick to one metric—for example, blood lactate—and base all my interpretations on this metric alone. I think it’s a valid criticism of my approach. But at this stage, I wish not to “pick a side” or a method and simply try and make the best interpretation possible from a holistic point of view.
Physiological thresholds are NOT fixed points on the intensity spectrum; they are transition zones (not linked to training zones) where the body shifts from one internal state to another. Share on XI’ll state it again: physiological thresholds are NOT fixed points on the intensity spectrum. Instead, they are transition zones (not linked to training zones) where the body shifts from one internal state to another. All thresholds (lactate, ventilation, etc.) do not always line up with each other, and there can even be significant differences between two methods that are supposed to illustrate the same thing (MLSS vs. critical power, for example).
This is why it’s essential to keep the big picture in mind. We also don’t want to get lost in the details—we want actionable information for the coaches and athletes we work with.
Regardless of the method(s) I choose, what remains important is to record all the interpretations I make on each system or metric available so that I can compare those interpretations at a later date after a retest. That way, even though my global interpretation might not be based on a single data point, I still know what each method “tells me” and can accurately compare it when future tests are performed.
Interpreting Heart Rate Data
As I stated earlier, heart rate is a very accessible physiological metric that should be used to inform conditioning training whenever possible.
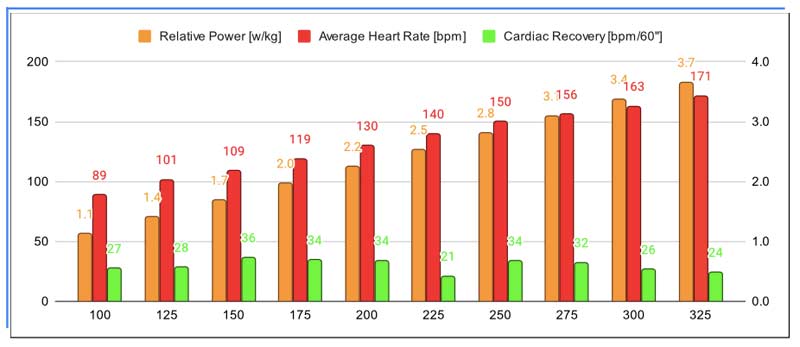
In the case of this 4-1 step test, I average the last minute of each stage and use this value as a reference for the corresponding power output.
I also look at how fast the heart recovered during the fixed one-minute rest intervals. This can be compared in future tests.
Interpreting VO2 Data
The advantage of the VO2 Master is that it provides you with the breath-by-breath raw data that was collected. The disadvantage of the VO2 Master is that it provides you with the breath-by-breath raw data that was collected.
Let me explain…
In the world of sports technology, different companies operate in different ways when it comes to the data that their devices collect. Sometimes, you get some very actionable information but have no idea what was done to the data. Was it smoothed? How was it interpreted? What algorithms were applied? How did they deal with noise/artifacts/missing data? Who knows…
Other times, you get the raw data and have to figure out what to do with it yourself.
There obviously exists a spectrum between those two “extremes,” but it’s essential to understand what you’re dealing with to make informed decisions about the data you collect.
Personally, I like the raw data. It’s more work to process, but at least you know exactly what went into your model, what analytics you applied, and what you got out on the other side. You have complete control through and through. If you want to change the way you analyze a data stream, you can do so and re-run all your prior data through that new filter. You can’t do that when all you have is the final output.
So back to the VO2 Master data.
Before I look at the numbers, I apply a 30-second rolling average to the data set. This helps offset any significant second-to-second variations because of the breath-by-breath measurement.
As with other metrics, I then take the average value on the last 60 seconds of each work interval as my reference value for the corresponding power.
The highest VO2 value expressed during the test is called VO2peak.
Going back to understanding the strengths and weaknesses of your approach, it’s important to point out that this longer test with four-minute stages will tend to underestimate an athlete’s VO2max relative to what could be measured on a short, 9- to 12-minute step test with no breaks.
To make it easier to grasp, we can say that VO2peak is specific to the protocol that was used to achieve it. Researchers have shown that different maximal VO2 values can be elicited in the same individual by changing the test’s duration, structure, and intensity. So as long as we only compare values coming from the same testing protocol, in the same conditions, and using the same measurement devices, we can have a high degree of confidence in our analysis.
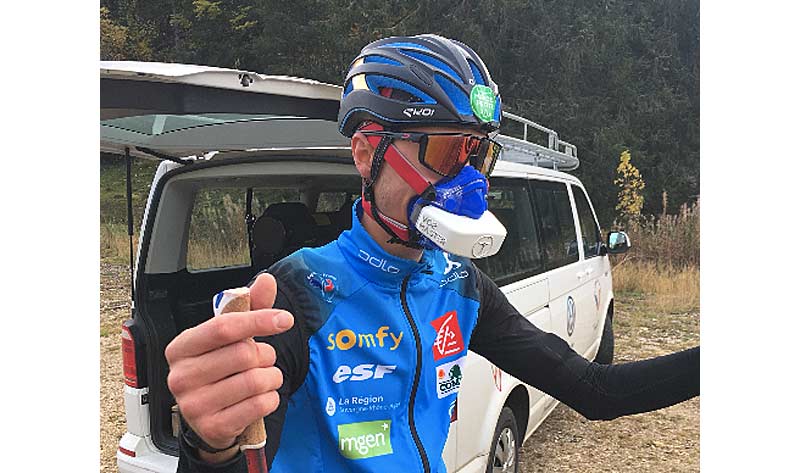
Since I work with different athletic profiles (CrossFitters, combat sports athletes, endurance athletes, etc.) across many levels, I see a wide range of VO2peak values on those tests. I’m starting to see trends and know what to expect for each category of athlete, but it wouldn’t be wise, in my opinion, to compare the VO2peak of a fighter to that of a cyclist, even if they both performed their tests on a bike.
In the case of a cyclist, I would like to see a high VO2 value in the last stage, which would be a good indicator of performance potential. But for a fighter, since there isn’t a strong correlation between VO2peak on a bike and sports performance, I might instead want to see a large enough value to allow for sufficient work capacity overall.
That said, VO2peak is not necessarily the most interesting metric related to oxygen uptake.
Some might argue that it’s even more interesting to look at the percentage of VO2peak that is manifested at each threshold. Relative VO2 at thresholds 1 and 2 are important fitness metrics that can help guide and individualize the training process for each athlete relative to their needs.
These values should be tracked and will help us assess an athlete’s progress over time. Think of this as a “how many reps can I do at 80% of my 1RM squat” equivalent for endurance sports. In the endurance world, the higher the percentage of VO2peak you express at each threshold, the better.
Now that we’ve looked at VO2peak and fractional VO2, let’s look at spirometry and ventilation data.
Spirometry Results
There are three main metrics of interest provided by any standard spirometer: FVC6, FEV1, and FEV1/FVC6.
FVC6 stands for Forced Vital Capacity in six seconds. It is expressed in liters (L) and tells us “how much space” the athlete has available in their lungs. In short, their respiratory capacity.
FEV1 stands for Forced Expiratory Volume in the first second of the exhale. It is also expressed in liters, giving us a measure of expiratory power (thanks to Daniel Crumback for that term).
FEV1/FVC6 is the ratio between those two values (expressed in %) and gives us an idea of how one compares to the other. Is your capacity low relative to your expiratory power? Or vice versa?
The results are then compared to the standard tables. For athletes, I like to see FVC and FEV above 110% of the predicted norm. For non-athletic clients, 100% works well as a separator between “good” and “not good enough.”
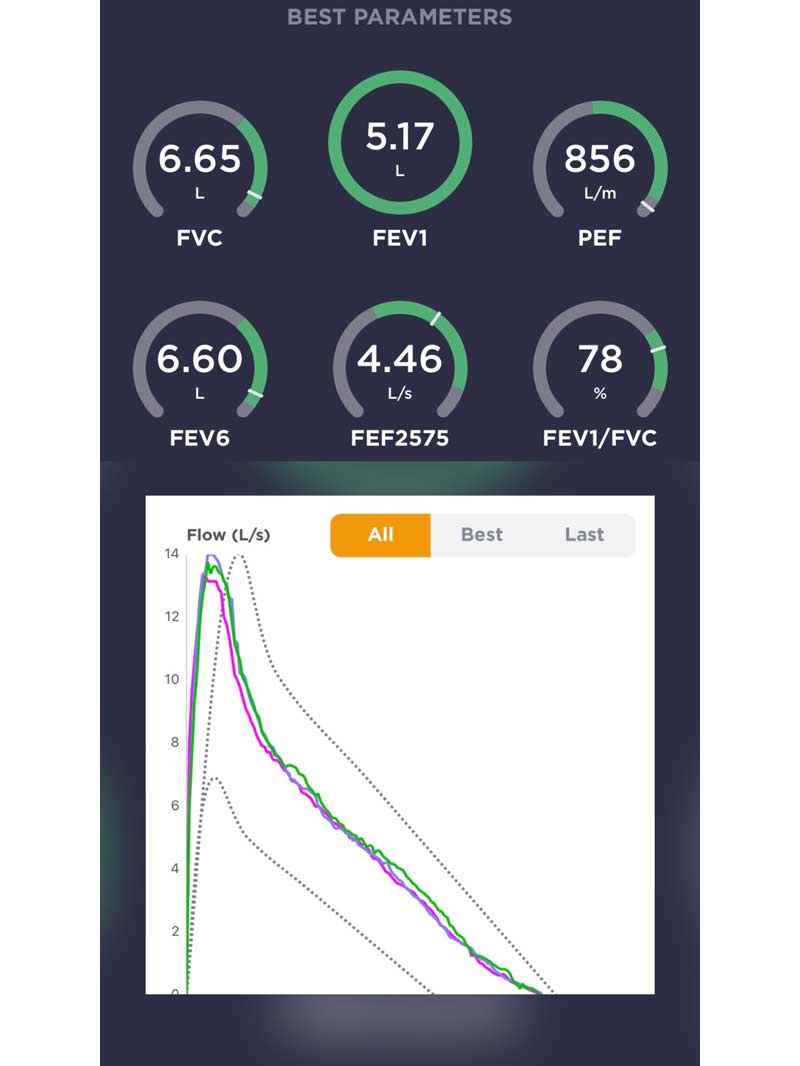
While respiratory training falls outside the scope of this article, there are definitely some interesting interventions and tools that can be used to address respiratory capacity limitations.
Next, let’s link respiratory capacity to respiratory coordination. Here, we want to assess whether the athlete is actually using their capacity effectively. To do so, I calculate 80% of the athlete’s measured FEV1 score. This is the volume that they should theoretically be able to “move” with each breath during a dynamic effort.
For example, if my FEV1 is 5L, I should manage to get 4 liters of air in and out of my lungs with each breath during the step test. With this, I can now look at the ventilation data collected and assess whether the breathing performed was optimal or not.
Ventilation Data
Ventilation from the VO2 Master provides us with two direct measurements and one calculated value: respiratory frequency (RF) expressed in breaths per minute, tidal volume (VT) expressed in liters, and ventilatory exchange (VE) expressed in liters per minute, respectively.
Since we don’t often speak of those values, we can draw a simple parallel with the heart.
Respiratory frequency is the equivalent of heart rate, tidal volume is the equivalent of stroke volume, and ventilatory exchange is the equivalent of cardiac output.
Throughout the step test, we should see a progressive increase in respiratory frequency (to match the intensity) while VT stays relatively high and constant, close to that 80% FEV1 mark I mentioned earlier.
There are multiple reasons I like to see this pattern of breathing.
Breathing Deep and Slow
First, breathing high tidal volumes allows the lungs to be completely filled with fresh air through each breath cycle. Compared to shallow breathing, this means that we can increase the exchange surface between the alveoli and the capillaries, where the oxygen passes into the bloodstream.
Second, high tidal volume breathing requires optimal diaphragmatic excursion (or range of motion). In almost all cases, this should be prioritized over “thoracic breathing,” which mainly recruits accessory breathing muscles. These are nowhere near as powerful or enduring as the diaphragm.
And lastly, breathing deeply and slowly will tend to increase CO2 retention. So, each minute, less CO2 is expelled, and the CO2 levels inside the body increase slightly.
The effect this has is very interesting.
In short, more CO2 retention means that your hemoglobin becomes less “sticky” to oxygen. In that way, the unloading of oxygen at the muscle (in the capillaries) is facilitated, and a higher fraction of the oxygen entering the body is actually utilized.
We know that O2 availability in the muscle directly influences substrate utilization. It has been recently discovered that oxymyoglobin (or myoglobin bound to oxygen) facilitates the transport and oxidation of fatty acids. Maybe something to explore regarding breathing efficiency?
Lastly, it’s important to realize that respiratory frequency is tightly linked to our rating of perceived exertion. By controlling one’s breathing and slowing it down, not only will you experience the benefits listed above, but you will also make your efforts FEEL easier.
It’s important to realize that respiratory frequency is tightly linked to our RPE. By controlling and slowing down our breathing, we will make our efforts FEEL easier, says @SeanSeale. Share on XAs we know, our perception IS our reality. So why not make our reality during exercise just a little bit less painful than it actually is by breathing slower and deeper?
Respiratory Coordination
Sometimes, the athlete can maintain tidal volume at lower intensities but loses coordination at higher intensities.
When an athlete presents with a respiratory pattern that deviates significantly from the expected standards I outlined above, I take it as an opportunity to open up a conversation with them about how they breathe, how they feel relative to their breath during exercise, and what can potentially be done to improve their awareness, control, and/or coordination.
I often recommend that athletes work with a respiratory training tool such as the Breathe Way Better to improve their movement (or “breathing technique,” if you will), their coordination (maintaining VT at all intensities), and their endurance.
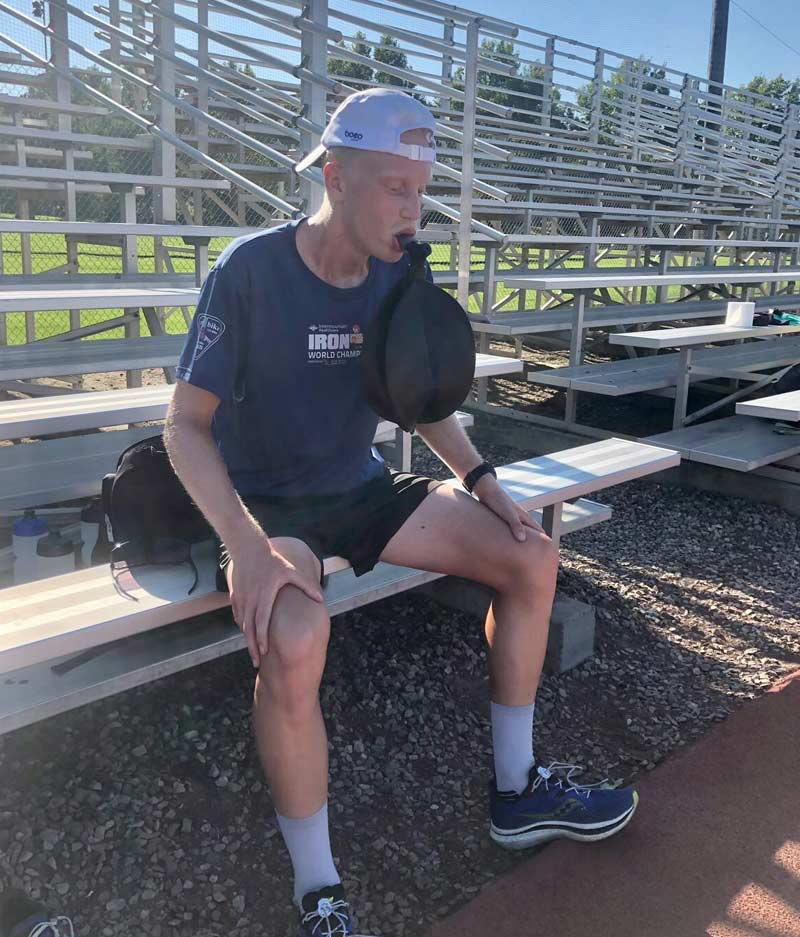
Image 24. Ironman U24 2022 World Champion Jameson Plewes training with the Breathe Way Better.
Now that we’ve looked at both spirometry and ventilation, let’s do a quick overview of what we can expect from muscle oximetry data provided by the Moxy Monitor (or any other NIRS device).
Muscle Oximetry Data
The Moxy Monitor provides us with two metrics: SmO2 and THb. We will focus on SmO2 today, which stands for muscle oxygen saturation.
SmO2 is expressed on a 0 to 100% scale and indicates the balance between oxygen delivery and utilization. The absolute numbers are influenced by adipose tissue thickness, so it’s best to focus on trends rather than the numbers themselves. In short, is the trend going up, staying stable, or going down? And how is that changing over the course of the test?
As I mentioned above, I use the Moxy data mainly to pinpoint my threshold 1 and threshold 2. When I test sports other than cycling or running, it’s also a good opportunity to analyze specific task demands and see what muscle groups are involved and to what degree.

Now that we’ve looked at how I interpret the data collected, here’s an example of the test report I provide to both coaches and athletes.
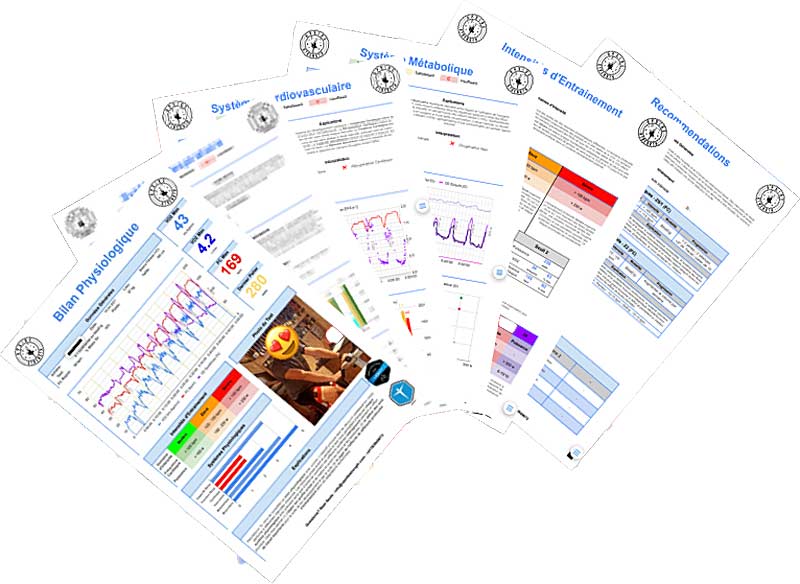
We’ve seen the results and how I communicate them to athletes and coaches, so let’s look at how I orient the programming for different athletes and needs.
Building the Training Plan
This is where the rubber meets the road. Test results are great, but if you don’t know what to do with them, they won’t be much use to you or the athletes you’re working with.
How to Set Training Priorities
“What should we do next” is always the big question following a test of any kind.
To answer, we need more information than what the test alone can provide.
To determine what we should do next, we need more information than what the test can provide. That’s why I always send athletes a questionnaire to fill out before our testing session, says @SeanSeale. Share on XThat’s why I always send athletes a questionnaire to fill out before our testing session. The information that will help me strengthen my decision-making process regarding the planification of training includes:
- What are the athlete’s perceived strengths?
- What are the athlete’s perceived weaknesses?
- What sport do they compete in?
- When is their next competitive event taking place?
- How much time do they dedicate to training each week?
- How do they distribute their training intensity across sessions?
- What type of conditioning training have they been doing recently?
- What type of conditioning training have they not done in a while (>3 months)?
With these questions answered, I already have a good idea of what the athlete will NEED next, regardless of their test results (that might be less true for elite athletes who have already been following a well-thought-out and balanced training plan for years).
Just as I did when interpreting the thresholds earlier, I’ll look first at what their questionnaire says and second at what their physiological profile indicates. Then, I can cross-reference the two to decide what training intervention they should go through next.
Programming Conditioning Training for CrossFit Athletes
Since this is the primary demographic I currently work with, I’ll focus on CrossFit athletes for a moment as an example.
The sport itself (or at least the way in which most competitive CrossFit events are currently built) centers around a time domain between about 3 minutes and 20 minutes of intense effort. This usually involves different movement patterns and exercises organized in varying ways from event to event.
If we leave aside max strength/weightlifting lifts and pure gymnastic events, this means that, from a cardiovascular and metabolic standpoint, CrossFit LIVES in the upper Heavy and Severe domains (or in zones 4 and 5).
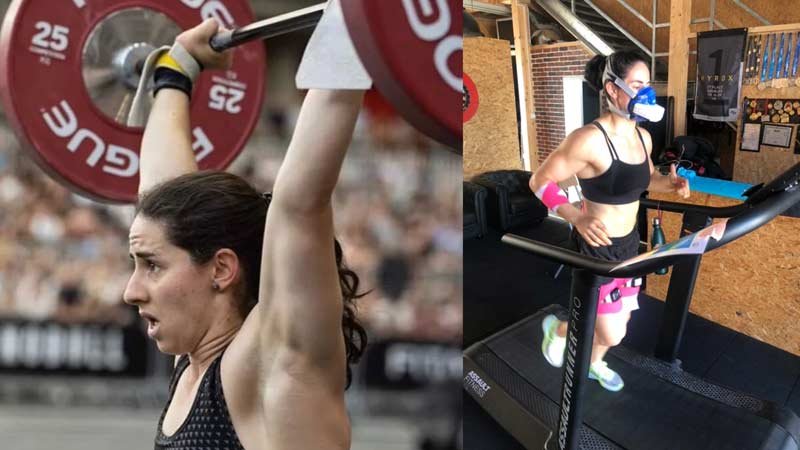
And it turns out that the conditioning training performed by most CrossFit competitors also falls in that time domain and intensity range.
So naturally, those athletes will greatly benefit from exploring training intensities and durations that they don’t use much (if at all).
As Alex Hutchinson said in a podcast I recorded with him, “the best stimulus is the one you never had.” I would add “and/or the one you haven’t had in a while.”
Video 1. Upside Strength podcast with Alex Hutchinson.
Put simply, if there are gaps in your conditioning that need to be filled, you will do well to work on those first. A training intensity you haven’t worked on in a long time (or ever) is bound to yield significant returns in the early stages of training without requiring too much volume to achieve it.
In line with that thinking, I often program some longer efforts for CrossFitters who are deficient in this area (tempo + threshold training). For those who display a real lack of power or intensity tolerance, sprint interval training (both short and long sprints) can be a potent and beneficial intervention.
The intensities are obviously individualized based on the test results and feedback on the first few sessions via heart rate and RPE monitoring, allowing us to make sure they are training at the intensities that we wanted to target in the first place.
Another staple absent from most CrossFitters’ training plans is low-intensity continuous training, also called “Zone 2” training. As a brief reminder, zone 2 is located below the first threshold and is characterized by low blood lactate levels (usually close or equal to resting levels), very easy breathing, and a parasympathetic-dominant state. This low-intensity training serves as the BASE for all the higher intensities expressed in training and competition.
Some common feedback I get from athletes who start including this type of training in their weekly training:
- Better sleep.
- Better recovery between sessions.
- Better recovery between work sets.
- Better tolerance of overall training volume/intensity.
- Better intensity performance.
Those adaptations usually take 8–12 weeks to manifest themselves with as little as one to two hours of Zone 2 training per week.
Tracking Progress over Time
After the training block is completed (usually between 8 and 16 weeks later), it’s time to assess the athlete’s progress.
Some might come back from a complete profile immediately, although there are ways to quantify their evolution without needing all the measurement tools.
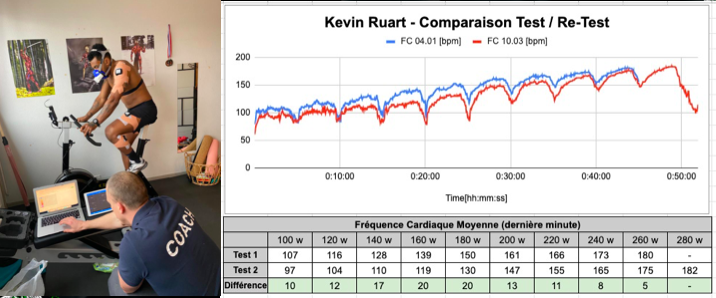
I’ll then have the athlete redo their 3-minute and 12-minute efforts and recalculate their critical power. From there, they can also do the step test again while just measuring heart rate and RPE. I can then compare their HR and RPE data to what I had initially collected to detect meaningful changes in their intensity profile and adjust the following training sessions accordingly.
Case Studies
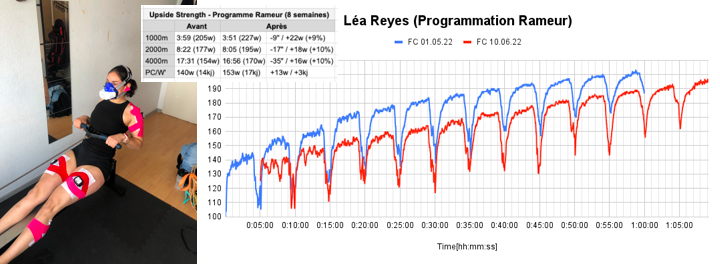
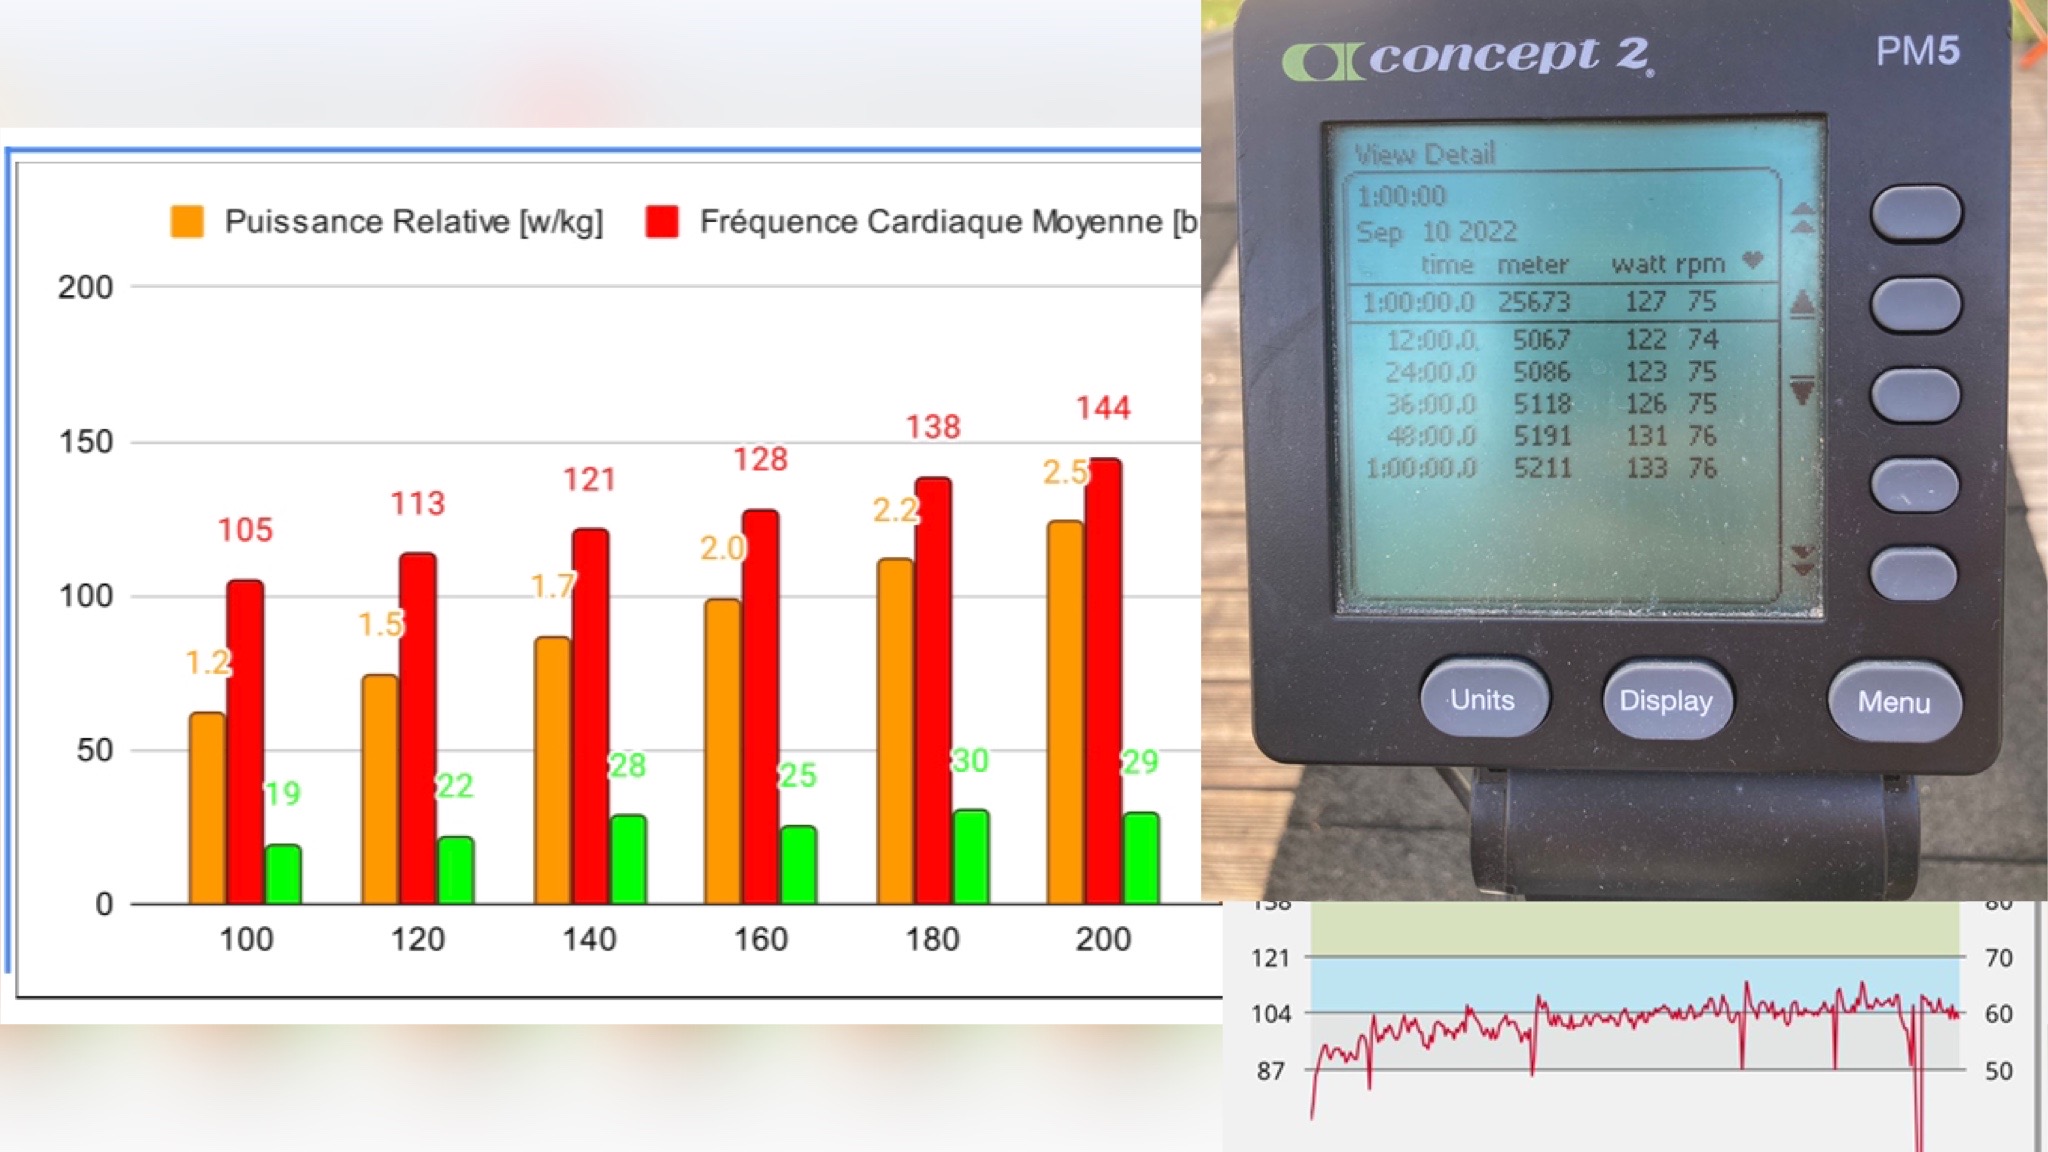
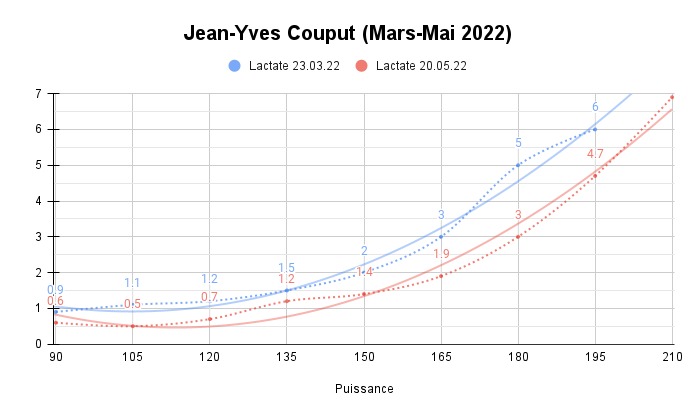
Here are a few examples of the progress different athletes have achieved following these ideas and training interventions.
Since you’re here…
…we have a small favor to ask. More people are reading SimpliFaster than ever, and each week we bring you compelling content from coaches, sport scientists, and physiotherapists who are devoted to building better athletes. Please take a moment to share the articles on social media, engage the authors with questions and comments below, and link to articles when appropriate if you have a blog or participate on forums of related topics. — SF

