Every ambitious trainer seeks to maximize athlete adaptation within a given training period. There is no crystal ball that reveals exactly which stimuli an athlete needs to reach their true potential, but the pursuit of such understanding is our great endeavor, and coaches will never stop trying to determine which interventions to implement to get the most from training.
Several athlete-profiling techniques have emerged in response to this quest, such as force-velocity profiling, load-velocity profiling, and more. These assessments are valuable, but the trouble is that most practitioners rely solely on one or two of these profiles to guide training.
Indeed, a profile is just that: a profile. Police create a criminal profile with facts about the perp—like height, weight, crime committed, etc.—but that doesn’t tell them where to search or how to capture the target.
Profiles are not inherently descriptive of what to do next: they are simply a snapshot of the current state of existence of a specific performance factor, like jumping, sprinting, or even basic biometrics. To truly have a sense of what an athlete needs to develop maximally in the coming training cycle, we must analyze and understand several layers via broad and encompassing data collection. Such an audit consists of several performance factors, including—but standing distinct from—siloed profiles.
The beauty of data is that it tells a story. The challenge is deciphering what that story is and how we interpret it to benefit the individual for whom it is told.
Athlete auditing captures this story and allows strength coaches to write the next pages.
Those who adapt and use auditing will ride the wave of athlete improvement and rise to the top of the field. The rest will be left “testing” to determine progress. They will miss out on the insights to be gleaned and the practical applications to be realized from assembling a holistic athlete audit.
Athlete Auditing: The Next Wave of Assessment
Knowing an athlete has poor initial acceleration is a great start. But coupling that knowledge with the understanding that they have insufficient ankle stiffness, adequate hip strength, subpar plantarflexion power, and a poor broad jump arms you with a more complete picture of why their initial acceleration is below standard and what to do about it.
Strength and performance coaches have been testing athletes for ages. Testing provides a snapshot of performance and isn’t without value, but beyond simply showing changes from the previous test period, there is not much to be gleaned from a vertical jump or fly run score in isolation. That data doesn’t reveal what the athlete’s training needs are from there.
Testing provides a snapshot of performance and isn’t without value, but the data doesn’t reveal what the athlete’s training needs are from there. Auditing bridges that gap, says @KD_KyleDavey. Share on XAuditing bridges that gap. It demonstrates strengths, weaknesses, and connections between physical qualities and performance outcomes like sprint speeds, kinematics, and jump height. More importantly, auditing generates insights into how and why an athlete does or does not perform well, highlighting low-hanging fruit and weak links that can be addressed in training.
Indeed, understanding the factors that produce the major KPIs, like sprint speed and jump height, is critical for improving these KPIs.
Advanced practitioners have evolved and are asking advanced questions: Why do these athletes perform (or not perform) well in these areas? What stimuli do they need to improve most? What training methods can I employ to deliver such stimuli?
Athlete auditing enables coaches to answer these questions confidently, directing training and maximizing results. Particularly for those working in the team setting, not compiling complete, holistic athlete audits is a lost opportunity.
Auditing is here to stay, and it will only grow in depth, application, and efficacy. In this article, I propose a framework for constructing a working athlete audit.
Audit Considerations: What Contributes to Performance?
When considering how to construct an audit, the guiding question should be, “what qualities contribute to athletic performance?” This will vary from sport to sport and position to position, as an offensive lineman has different KPIs than a wideout, but there are certain commonalities among sports.
When considering how to construct an audit, the guiding question should be ‘what qualities contribute to athletic performance?’, says @KD_KyleDavey. Share on XIt is worth noting that assessments do not need to look like or resemble the sport itself to be relevant. Rather, an assessment aims to quantify a quality that transfers to sports performance. Where many test options exist to quantify a single quality, it is wise to choose those that resemble the sport the closest (a running versus swimming repeat sprint test for soccer players, for example). The age-old argument of “my athletes never do X, Y, or Z on the field, so why test it?” is not a valid position.
The goal of an audit is to build a holistic composition of the critical factors that influence sport performance. Matt Van Dyke proposed six qualities that encapsulate the energy and force production systems, providing a solid framework for physical performance. From a big-picture perspective, we can classify physical contributors as follows:
- Strength
- Power
- Speed
- Endurance
Each quality is composed of subcategories that together constitute the overarching theme. For instance, endurance can be separated into aerobic and anaerobic components, and those can be further broken down into subcategories of their own.
The goal of an audit is to build a holistic composition of the critical factors that influence sport performance, says @KD_KyleDavey. Share on XEach subcategory is fair game to be assessed. When deciding whether to assess the quality, you must weigh the time involved, its relevance to sports performance, and the potential payoff from improving the quality if it is lacking. Certainly, not everything that can be included should be.
Nonetheless, practitioners should seek to quantify these outputs directly, as well as their relevant constituents, to tell the story of how performance in the major KPIs is achieved in the first place.
Further, we must recognize that physical qualities underpin technical components of sports actions. This becomes immediately recognizable when working with youth athletes who don’t yet have much strength at their disposal. They simply can’t hit the archetypal sprint kinematic postures because they don’t have the strength and power to do so. Maintaining a relatively neutral pelvis at max speed and achieving an elegant negative step are perhaps two of the more challenging sprint tasks—at least two of those which require a great deal of strength to achieve.
Assessment Considerations
Below is a basic list of “non-negotiables” that should be assessed in field and court sports athletes. Special considerations are included later in this article as well.
- Sprint performance and kinematic outcomes
- Sprint-specific range of motion
- Power
- Jump performance
- Elasticity
- Aerobic fitness
Examples of how each quality may be assessed are provided below.
Sprint Performance Determinants and Outcomes
Beyond simple split times, what do you consider valuable descriptors of sprint performance? More importantly, what do you believe are the determinants of sprint outcomes? These are the variables to capture and report.

Many are inclined to report data regarding sprint force-velocity profiling (FVP), such as F0, V0, and the slope of the curve. Perhaps rightfully so. A growing body of research supports the use of this method to individualize training for greater speed improvements.
Gathering and reporting such metrics is fine and not time-consuming—but I would be remiss if I didn’t mention that sprint FVP is not without contention.
Dr. Peter Weyand, a renowned sprint and speed researcher, discussed his beliefs on why force-velocity profiling is a flawed method on the Pacey Performance Podcast. His biomechanical rationale is sound, and he presents a different perspective on why the method may not be the best way to characterize sprint performance.
Carl Valle has also presented perspectives on why the method may fail to deliver.
Regardless of your beliefs about sprint force-velocity profiling, many practitioners implement the method and claim to have success, so reporting those metrics may be of value if the strength coaches and sports scientists of the team you’re working with value those outputs.
Sport-Specific Speed Outcomes
Understanding general physical outputs like speed and power is valuable, but sport- and play-specific metrics are game-changing for sports coaches.
Readers of this article are likely well aware that acceleration and maximum velocity are related but distinct qualities. The best accelerator does not always boast the fastest top speed and vice versa. A 4.4-second 40-yard dash is impressive but not descriptive of how the athlete achieves such a time.
Using American football as an example, certain plays rely more on initial acceleration while others rely more on maximum speed. A three-step slant, for instance, has little to no relationship with top speed, but a deep dig or drag, a post, and a fade certainly do.
There is immense value in knowing which players have the best physical skill set to execute each route. Savvy offensive coordinators match particular plays with particular players, understanding which play types are best suited for which players. This understanding has traditionally been based on the coach’s intuition, eyes during practice, and film review, but the modern coach also utilizes data to support decision-making.
Hence, knowing which receiver has the fastest velocity at one, three, and five seconds post-snap is information that can alter game plans, personnel packages, and play calling.
Further, momentum at 3 yards and 5 yards is highly applicable for linemen, as it essentially quantifies how much force they deliver—in other words, how hard they hit—to that which they run into, be it a linebacker or defensive lineman. This is valuable information when considering who to pull to kick out the monstrous defensive end.
Other sporting examples include time from ball contact to first base, maximum dribbling speed in soccer, and track-specific metrics like time to and distance at the onset of maximum velocity and deceleration in a 100-meter sprint.
When determining what to assess, we are limited only by the imagination and depth of intimacy with each sport.
Sprint Kinematics
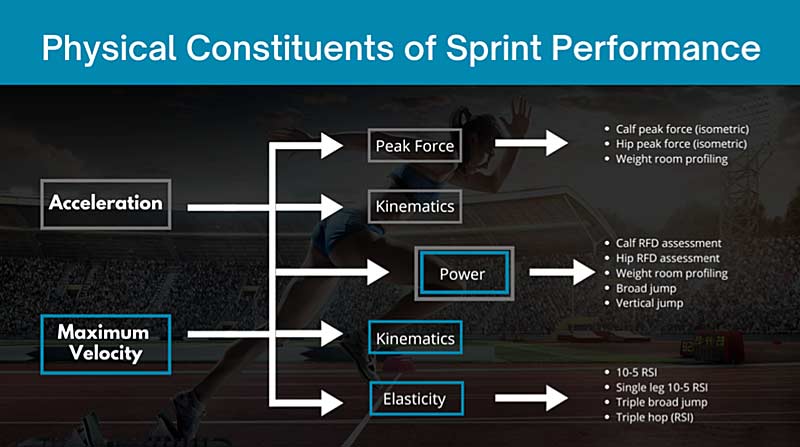
As sprint performance is, at simplest, determined by the relationship between kinetics and kinematics, assessing kinematics is critical.
There are several resources available on sprint kinematics, from Ralph Mann’s seminal work to the Tom Tellez and Carl Lewis book to online courses now readily available. Regarding the mechanics of capturing and analyzing video, I’ve previously written about performing an effective analysis, and Derek Hansen dedicates a complete section of his level one “Running Mechanics Professional” online course to Carl Valle, in which he discusses video capture and analysis in great detail.
While I can generate a whole report solely on kinematics, it is appropriate primarily for competitive sprinters fighting for milliseconds. That level of granularity is overkill for team sport athletes, who benefit most from ensuring the “big rocks” are in place. The time spent shaving a blink off a sprint via kinematic changes is best spent elsewhere for these athletes—whether in the weight room, practicing the sport itself, or otherwise.
Once the most critical kinematic components are in place, there’s no need to hyperfocus on minutia as one would with a spiked-up sprinter.
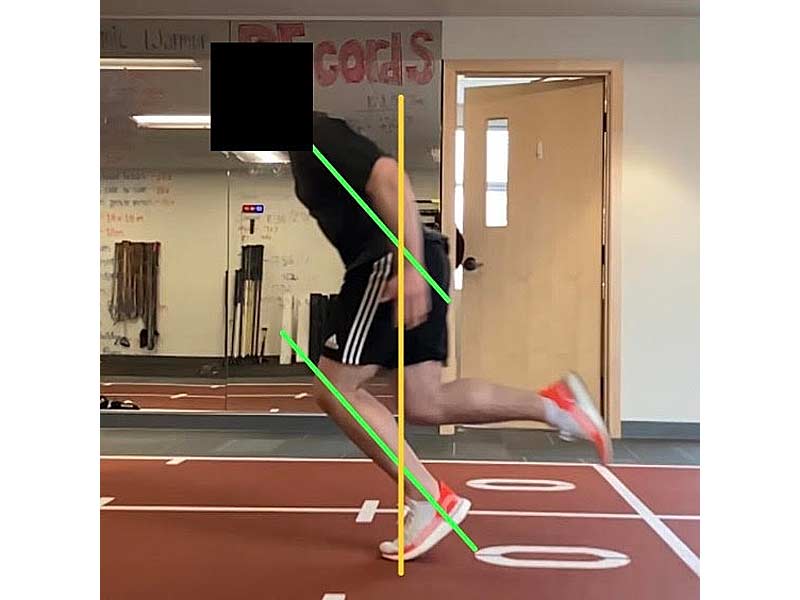
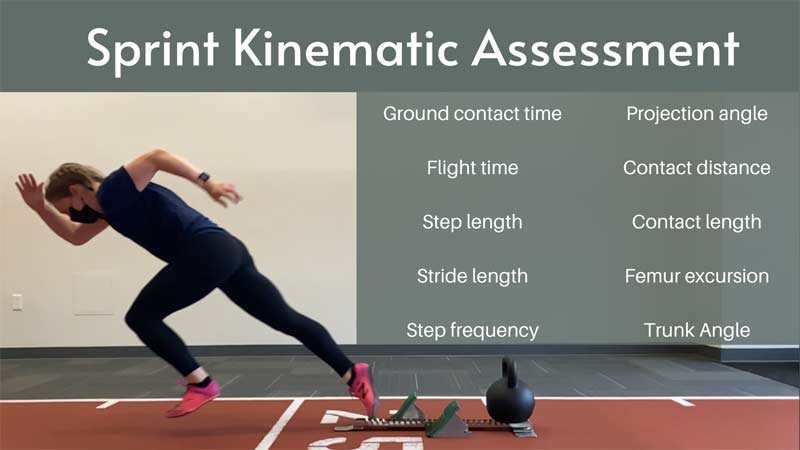
Having gone through a few iterations of sprint reports, I’ve learned to “trim the fat” and focus on the most coachable and relevant metrics: contact distance, contact and flight time, femur position at toe-off and maximum flexion, and a few other key KPIs, including step length and frequency.
The marriage of step length and frequency is, after all, the literal definition of speed.
An athlete with strong frequency but poor step length is telling when considering what variables to modify to increase speed. Clearly, this athlete calls for increased force expression without negatively affecting the neuromuscular “wiring” and decreasing frequency.
Likewise, an athlete with adequate step length but poor cycling will benefit from increased step frequency.
Lastly, we cannot look at any single metric in a vacuum. Say frequency is high—in the 4.5–5 steps-per-second range—but flight time is around 0.1 seconds or less. You can also bet that contact distance (distance between the point of contact of the foot upon touchdown and the center of mass) is too far, and I’d wager a good sum of money that maximum femur flexion is limited as well.
This athlete likely has very little vertical displacement and scuffles down the field rather than bouncing or gliding while sprinting. Flight time is often the tide that raises all boats, and trading a bit of frequency for increased step length may actually increase speed in this case.
Sprint Load-Velocity Profiling
Access to and understanding of resisted sprints has deepened significantly over the last decade. Moving the discussions from pounds on the sled (without controlling for surface friction, at that) to velocity decrement (the percent decrease in speed that a given load induces) was a giant leap forward in the application of resisted sprinting. Matt Cross’s work highlighting that maximum power is achieved at the load that produces a 50% velocity decrement created a platform for varying loads to be analyzed in research.
The 1080 Sprint upgraded the resisted sprint market (and assisted/overspeed sprints as well). The machine provides what harnesses and bungees cannot: precise, controllable resistance and objective data. Practitioners who enjoy taking a scientific and thorough approach love the 1080.
The unit also automates load-velocity profiling (see this piece by Matt Tometz for a thorough breakdown). This is crucial because, without a device like the 1080 Sprint or Dynaspeed, load-velocity profiles must be done via video analysis or radar/laser outputs and a little bit of Excel magic.
If you don’t have a 1080 Sprint or Dynaspeed, I don’t recommend completing a sprint load-velocity profile, as it takes too much time. If you do have access to these devices, do it, because it does add insightful data.
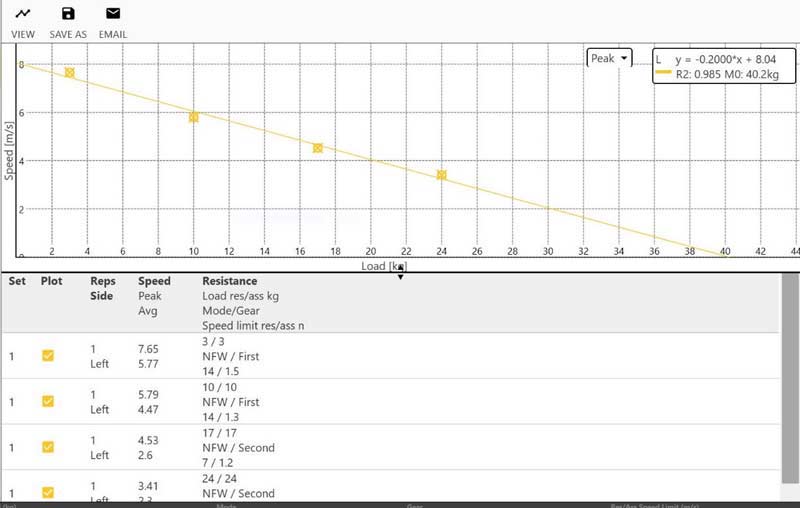
Stronger athletes can sprint against heavier weights faster than weaker ones. Stronger athletes (relative to body weight) also tend to have faster starting speeds, realized in 0–5-yard and 0–10-yard sprint times.
How fast an athlete can sprint with weight is evidence in the detective process of figuring out what stimulus they need to improve the most. For instance, if your audit reveals an athlete with slow starting speeds and poor sprint performance against heavy loads (meaning a high-velocity decrement comes at a relatively low load), part of the solution is likely heavy resisted sprints coupled with strength work in the weight room.
On the flip side, if the athlete can sprint relatively fast against heavy loads yet has poor starting speed, the issue is likely technical or related to the strength-to-size ratio (big athletes, like offensive linemen, fall into this category). If the audit also reveals poor kinematics in the first seven steps, then you’ve made a strong case for biasing training time toward technical interventions.
Beyond these insights, load-velocity profiles provide valuable training guidelines. Knowing what loads produce maximal power allows coaches to train at, above, or below that threshold with targeted interventions. Likewise, in the case above in which heavy resisted sprints are recommended, a sprint LVP reveals exactly what load constitutes heavy with razor-like precision, allowing for clear programming and targeted adaptations.
Range of Motion
Consider the major moving joints (as opposed to remaining stable) involved in sprinting: the ankle, knee, hip, and shoulder. Most people are not limited by shoulder flexion or extension range of motion, although I do wonder aloud how poor scapular mechanics affect the sprinting gait cycle.
Nonetheless, before asking athletes to maintain proper frontside mechanics, we ought to make sure such ranges of motion are available to them—specifically, hip extension. Poor hip extensibility could shift athletes into backside mechanics via an anterior pelvic tilt in order to achieve adequate femur position at toe-off.
Furthermore, knee extension ROM from a flexed hip position is critical, as it emulates hamstring mobility demands during the flight phase. It seems evident that limited knee extension range of motion from this position may be a risk factor for hamstring injury.
The Jurdan Test is a great option for assessing both hip and knee extension in a sprint-specific position.
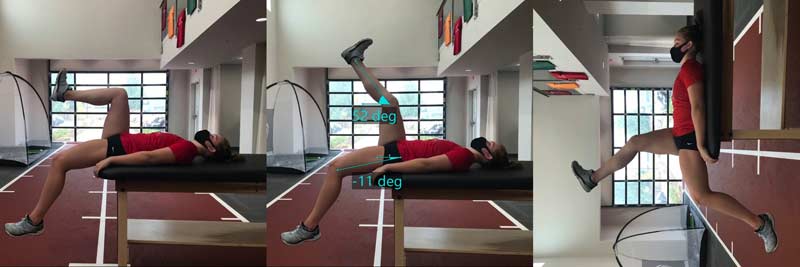
I wrote about the Jurdan test here; you can review that article for detailed instructions on administering and scoring the test.
Dorsiflexion is also a critical factor in sprint performance. During mid-stance, as the center of mass travels over the foot, the foot should remain in complete contact with the ground. Premature elevation of the heel, which could happen if dorsiflexion is limited and the end range of motion is met, limits the stretch-shortening cycle of the Achilles tendon and results in less propulsive forces generated from the foot complex.
In other words, poor dorsiflexion range of motion likely makes you slower and addressing it could make athletes faster.
Assessing ankle ROM is thus of value. A simple way to do so is with an iPhone or a goniometer.

A shin angle of 40 degrees is the minimum we’d like to see here. A shin angle of 45 to 50 degrees is a more comfortable range of motion to work from.
Of note—I believe that the Goldilocks effect is in play here. Too little range of motion is limiting for obvious reasons, but too much flexibility is likely maladaptive as well. Approaching an end range likely facilitates part of the stretch-shortening cycle and may help prevent dangerous positions from being achieved. These mobility screens are effective ways to quantify the range of motion to be sure athletes are in a healthy zone.
Weight Room Profiling
Although you wouldn’t know it by logging on to Twitter, I believe the majority of coaches share mostly similar views on weight room training for athletes. The debate over whether a power clean or trap bar jump is superior stems from a fundamental agreement that power training is valuable. Without that underlying agreement, we would ask, “why do either?”
While I don’t believe power is the end-all, be-all, it is a critical component and certainly one of the primary KPIs for most athletic endeavors, including change of direction and forcefully moving another object (like a ball or person). Power is also a significant contributor to speed at the sub-elite level (read: non-Olympic sprinters).
Here, I will provide a few specific recommendations about weight room profiling in general and suggest a few specific assessments that are not in everyday use.
Power Profiles
Generating power profiles for the major lifts you choose to implement is both descriptive of and prescriptive for athlete force production performance and potential across a spectrum of velocities. They quantify how strong, fast, and powerful an athlete is—the marriage between strength and speed. The profiles do so by illuminating the following:
- Maximum unweighted velocity (or velocity with just a bar, a proxy for unweighted velocity).
- One rep max.
- Maximum power.
- Load that yields maximal power, dubbed “optimal load” in the literature.
Most VBT devices automatically generate load-velocity and load-power profiles after completing a few reps with various weights. If you need to do it manually, you can compute the time it takes to complete the concentric portion of a lift via video analysis and run the calculations yourself. This video provides an excellent and thorough overview of how to create your own load-velocity profiles in Excel.
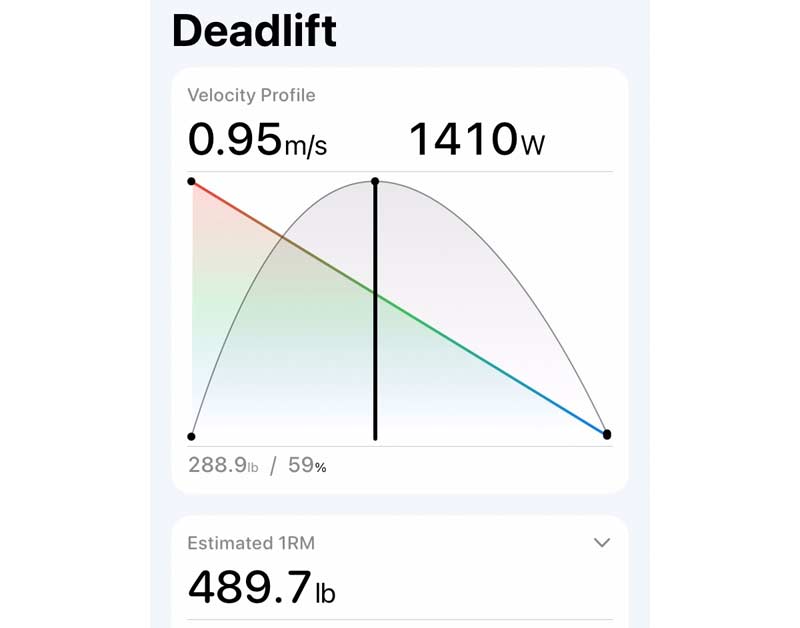
Once you obtain the data, you may compare athletes against each other. For example, a receiver may boast a very high 1RM in the back squat but a relatively low peak velocity in the squat jump with just the barbell, and that provides context for training. In this case, the athlete would benefit from skewing more volume toward the velocity side of the spectrum and away from the maximum strength side with exercises like CMJs and lightly loaded jumps.
To assess general athletic/power abilities, these lifts are worthy of inclusion:
- Squat
- Deadlift
- Squat jump
- Bench press
- Landmine press
- Clean variation of choice
Certain teams and strength coaches prefer particular lifts over others. The above list isn’t rigid, but assessing the main lifts you choose to implement in your S&C program is ideal.
From there, you are armed with data to improve athlete power. Although there isn’t one “best practice” for improving power production, in general, training slightly above and below the optimal load (the weight that produces maximum power) is a solid strategy.
Calf Strength
Beyond profiling the general lifts for raw physical outputs and preparedness, I recommend assessing a few specific actions: plantarflexion and hip extension force production.
These movements are rate limiters for speed, meaning even if the other pieces of the speed puzzle are in place, missing either of these qualities significantly limits speed potential.
Calf strength is particularly important during initial acceleration. The foot needs to be stable during the first steps of a sprint so the rest of the leg can push against it and propel the body forward. If the heel drops significantly upon ground contact during the first few steps, there is a significant energy leak that limits the rate of acceleration.
In athlete speak, stronger calves = more explosive starts.
Anecdotally, this is probably one of the reasons heavy sleds improve initial acceleration. Without discounting their effect on the rest of the system, we must recognize the training effect the calf and foot receive.
Maximum speed is also influenced by calf strength and power. Plantarflexion is the last piece of the kinetic chain—the crack of the whip—as the calf must overcome the force produced by the rest of the leg musculature pushing down into the ground to raise the heel and create plantarflexion.
During the final portions of ground contact, when the heel raises naturally due to reaching the end range of dorsiflexion, the calf must again act as an anchor, as it does during initial acceleration, to hold the heel in place and allow the hip extensors to push against it. Significant strength and power are required, and identifying athletes who lack such strength is an instrumental finding.
Hip Torque
Beyond calf contributions, the hip extensors play a special role in speed, as hip extension is clearly the primary driver of force into the ground. Squat and deadlift numbers are great and are indeed descriptive (to a degree) of hip extension potential, but let us recognize that hip extension creates both vertical and horizontal force, and those tasks are related to but distinct from each other.
Squats, deadlifts, and the IMTP all assess vertical force production. This is valuable and worth auditing, as vertical force production is a significant KPI toward maximal speed
But advanced sprinters understand that negative foot speed is also a critical variable, and striking the ground with an emphasis on such foot speed produces elite levels of force. Negative foot speed refers to the foot traveling backward—toward the center of mass—instead of strictly downward in a vertical fashion during the terminal swing phase. Coaches sometimes cue this as “pawing the ground,” a cue I’m not fond of but one that is descriptive of the action.
A stronger cue is one I learned from a coach who prefers anonymity: he refers to this action as swinging an axe, where the foot is the head of the axe. When chopping wood, the arc of the axe head eventually swings back toward the center of mass, like a pendulum, and not strictly downward in a vertical or piston-like fashion. So, too, should the foot travel backward toward the center of mass during the terminal stages of the swing phase.
Hip extension drives this motion.
Squats and deadlifts both involve the pelvis moving over a stationary foot. They are closed-chain actions juxtaposed with the open-chain motion of sprinting, wherein the foot travels through space underneath a pelvis that is fixed in relation to the torso (i.e., not hinging or moving vertically, as in squats and deadlifts).
Thus, analyzing hip extension in this forward-to-backward motion is highly specific to sprint speed. Said otherwise: we must assess hip extension ability where the pelvis is fixed in space and the foot and shank are the body parts intended to move, as opposed to the opposite, as in the lifts mentioned above.
My favorite assessment comes from the work of James Wild, who adapted a test originated by Goodwin and Bull. Fix the hips against an immovable object (like a heavily loaded barbell), place the heels on a force plate, and press them down into the plate as hard as possible, as if trying to make a crater with the heels.
Video 1. Hip isometric assessment, originated by Goodwin and Bull and enhanced by James Wild, integrating video and force plate data via Noraxon. The assessment quantifies RFD and maximal force production alike. Data must be normalized against body weight to draw conclusions regarding sprint performance.
A critical point: for this test to produce valid and actionable data, you must convert the force values gathered from the plates to hip torque and then generate torque-to-body-weight ratios, as opposed to force-to-body-weight. Torque takes limb length into account and is truly what drives horizontal sprint performance, as hip torque drives hip angular velocity and, thus, ground reaction force.
Let me be clear: ground reaction torque does not exist; ground reaction force is what propels athletes forward. But hip torque is what generates the hip and foot velocities that produce the resultant ground reaction force.
Indeed, the length of the moment arm plays a pivotal role in force expression. My intentions here are not to deliver a physics lesson, but the longer the moment arm (driven by leg length, in this case), the greater the torque. Thus, a taller athlete requires more hip torque (read: force production, i.e., strength) to get the same ground reaction force as a shorter-limbed athlete.
In practice, this means taller athletes require stronger hips than shorter ones. Clearly, training implications are present here. Once normalized to body weight, fair comparisons about hip torque can be made.
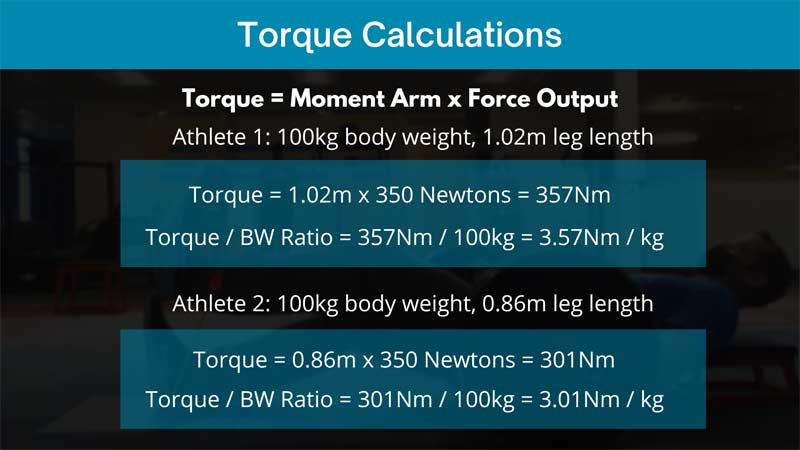
Analyzing torque with the knee bent to about 90 degrees and again with a knee at 15 degrees paints a more complete picture. A 90-degree knee better represents acceleration demands when the knee is much more flexed upon ground contact than it is during upright mechanics. Indeed, squats, deadlifts, and the IMTP may serve as a proxy for this measurement, but this position and hamstring/glute coupling are still more specific to early acceleration than those lifts are.
Propulsion and Elasticity
Whereas the hip assessments above directly measure RFD and maximal force production, jump tests deliver further insights into ballistic horizontal and vertical force production capacity, as well as elastic abilities.
The following tests are recommended:
- Broad jump
- Vertical jump
- 10-5 RSI/Scandinavian rebound jump test
- Triple broad jump
The following tests are honorable mentions that deserve consideration if time is not a constraint:
- Single-leg broad jump
- Single-leg 10-5 RSI/Scandinavian jump test
- Triple hop for RSI assessment
Data interpretations are provided later in this article, so I won’t belabor this point for now. I will quickly mention that the single-leg tests are valuable for assessing asymmetry and point out that the triple broad jump is an underrated tool, as it values both raw propulsion capability (force production) and elasticity. An MLB strength coach once told me that, for his players, the triple broad had the highest correlation with time to first base—even greater than the 90-foot sprint test!
Video 2. The 10-5 RSI and the Scandinavian jump test both evaluate the elastic potential of the lower leg. A jump mat, force plate, or contact grid (as shown in the video) can all streamline data collection. Alternatively, video analysis to quantify flight and contact times works but is laborious and time-consuming.
Aerobic Fitness
I’ve previously discussed how and why aerobic conditioning is vital for team sports athletes. In summary, aerobic health is a significant factor in repeat sprint ability. If you want athletes who can play fast while tired—or who aren’t tired when opponents are—aerobic fitness is a priority.
The 30-15 intermittent fitness test is an assessment that takes 25 minutes at most to complete, can be deployed with entire teams at once, and is valid and reliable enough to collect actionable data (see this article for an overview). The test provides a value similar to maximal aerobic speed from which coaches can A) estimate VO2max, B) track athlete progress objectively, and C) program conditioning workouts.
All you need to complete the test is a loudspeaker, YouTube, 40 meters of space, and a few cones.
The beauty is that the entire team can complete the test together, a myriad of research has been done to establish normative values (although, in fairness, most research is done on soccer athletes of varying levels), and coaches will quickly discover which athletes need to spend more time conditioning.
Sport-Specific KPIs and Holistic Health
Subsets of athletes who face unique sporting demands, such as overhead athletes, warrant specific testing. Quantifying shoulder rotation ROM and scapular mechanics for softball and baseball players, as well as javelin throwers, for instance, is a necessity.
Each of these athletes also utilizes rotational power to fuel performance.
The better you know the sport, the more closely you can capture high-value KPIs that coaches appreciate, says @KD_KyleDavey. Share on XThe better you know the sport, the more closely you can capture high-value KPIs that coaches appreciate. Adding exit velocity and a 90-foot sprint time to the athlete audit provides metrics that coaches find valuable—increasing your value simultaneously.
Other items to consider:
- Bloodwork and nutrition
- Lifestyle and sleep habits
- HRV status
- Team/school satisfaction
- Mental health and resilience
The point here is to look beyond physical capacity and toward the person as a whole, recognizing that they are more than a revenue earner and a stat scorer—they’re a complete person.
Are you happy with your college or team dynamics? Are you sleeping and eating well? Are you healthy internally? Are you mentally resilient enough to respond positively to adverse situations?
Respecting both the athlete as a person and the best interests of the team is not mutually exclusive. Healthy individuals create healthy teammates, and healthy teammates make for a healthy team capable of winning games. We need not pretend that pursuing W’s is inherently wrong or unhealthy or that maximizing athlete well-being in an effort to win is unjust.
Ultimately, ensuring holistic athlete health is best for the person and the team.
Interpreting the Data
Data tells a story. Our job is to extract and understand the story to make confident decisions that advance athlete potential on the field, court, or track. To do so, we must seek common threads that point toward certain lacking features.
Training time is limited, and coaches must know how to spend those precious minutes best to assert the most desirable outcomes for athletes. The more evidence that suggests a common theme, the stronger the case for biasing training toward that quality.
Ryan Grubbs discusses this concept and how he assesses athletes in an interview on the Pacey Performance Podcast.
To make clean comparisons regarding sprint speed, the strength and power data needs to be normalized to body weight. Sprinting is, of course, moving one’s body—so the numbers need to reflect that. When you compare athletes amongst a team, do so using the metrics relative to body weight. Otherwise, you run into the issue of thinking a 175-pound freshman receiver with a 375-pound back squat (2.14x body weight) needs to be stronger because the 245-pound linebackers are all squatting 450+ pounds (1.8x body weight).
Once the data is normalized to body weight, you can separate athletes in several ways: using quartiles, quintiles, Z-scores, standard deviations, etc.
None of these methods is perfect. They always produce bottom-of-the-barrel athletes, as there is always a “weakest” athlete in any group, even if they are actually absurdly strong. The opposite is also true: when using quartiles, there will always be athletes at the top, even if they are, in reality, poor performers.
The better route is to utilize challenging standards by which athletes can be compared. Research helps elucidate what these standards should be and allows coaches to use cut-off zones to determine if athletes indeed are deficient or, rather, simply the least elite of the group in that particular test.
The assessments discussed here have been selected via a reverse-engineering thought process. I want to know:
- What performance factors influence the chances of success in sports?
- What physical qualities underpin those factors?
- How can those qualities be accurately assessed?
Without answers to these three questions, I won’t be able to interpret the data collected. For instance, without understanding that maximum strength and power are significant contributors to initial acceleration (the first steps in a sprint), we wouldn’t know to be curious about the strength and power metrics collected from an athlete with a slow start. Even further, we may not know that an athlete with a poor start yet sound strength and power metrics (relative to body weight—a paramount modification that cannot be overlooked when analyzing these outputs relative to sprint speed) likely has poor kinematics.
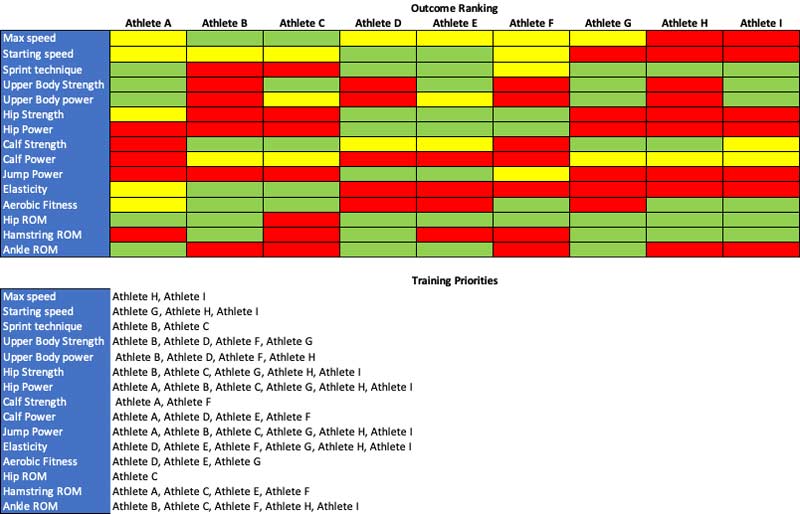
Providing a comprehensive education is beyond the scope of this article, but a few examples have already been provided for how you may interpret the audit. Sometimes the answer is straightforward, as in when most values are relatively high, but one or two are significantly low, like an athlete who is strong and powerful in the weight room but has a poor triple broad jump and a 10-5 RSI test. This athlete will benefit from elasticity work more than more weight room training.
As athletes become more elite, the audits typically become more difficult to interpret. This is why the audit exists in the first place: to determine what a great athlete needs to become even better. Share on XLikewise, athletes with poor sprint kinematics but good weight room numbers should receive technical training if they want to be faster.
Other times, the answer is more complex—and as the athletes become more and more elite, the audits typically become more difficult to interpret. However, that is the reason the audit exists in the first place: to determine what a great athlete needs to become even better. It’s not worth the time to audit a first-year high school student only to conclude that everything must get better.
Packaging and Reporting the Data
It is not lost on me that this is a lot of data to collect, analyze, make recommendations from, and report back to the relevant parties. Completing each of these is our job as performance analysts, but the final step, reporting the data, is unique in that there is a recipient we must ensure understands the results with ease and clarity.
In reality, most performance analysis consultant jobs will be hired by the S&C, sport science, or medical staff—not the sports coaches themselves. While the support staff and the sports coaches are literally on the same team and are pulling the boat in the same direction—putting the team in a better position to win games—your job is to make those who hired you look good to their direct reports, who is usually the head sports coach.
The report you generate must clearly display the raw data you’ve collected, a brief analysis of those results, and the training recommendations deduced from them. It should be detailed enough for the strength, sport science, and medical staff to appreciate and follow, and clear enough for athletes and sports coaches alike to understand the bottom line.
Reports should be no more than one page per athlete and include a one-page team and position group summary.
Lastly, the report should “bucket” athletes into training groups based on the findings and recommendations. Doing so makes life easy for the strength and sport science staff and allows them to program with clear goals in mind.
Checkpoints and Re-Auditing: Ensuring Progress and Long-Term Development
Athlete audits are not meant as a one-time assessment, never to be revisited. Scheduling periodic data collection is vital for ensuring athletes progress in the desired domains, but such testing does not have to be formal, time-consuming, or overbearing.
To be clear: completing a full audit will take a whole training session, maybe two, depending on the time and facilities available as well as the flow of the program. It’s not wrong to collect data over two or more sessions to compile the audit. However, once the complete picture is pulled together, regular testing should monitor the areas of specific emphasis (the qualities highlighted in red in the image above). It can be built into training sessions to collect data and monitor athletes in an ecologically valid environment without disrupting the training process.
Scheduling periodic data collection is vital for ensuring athletes progress in the desired domains, but such testing doesn’t have to be formal, time-consuming, or overbearing, says @KD_KyleDavey. Share on XA timed fly run or acceleration, a measured broad or vertical jump, and strength and power outputs in the weight room are data most coaches are likely gathering anyway. Monitor these key metrics to ensure athletes are progressing, understanding which values are the actual KPIs and which are the contributors to those KPIs.
Even with regular monitoring, complete audits should be scheduled annually or semi-annually. Doing so provides a host of key benefits:
- Quantifies athlete growth in response to the interventions delivered.
- Communicates to the athlete that they are indeed being tested and monitored (an undervalued aspect of auditing).
- Creates a new vision of what the athlete needs to continue improving.
- Ensures athlete strengths are not declining.
- Updates baseline data in the event of an injury.
- Updates database of normative values to compare against.
- Reveals insights between specific qualities and how they affect the major KPIs, like sprint and jump performance.
- Allows for long-term monitoring of athlete growth and development.
- Puts coaches and athletes on the same page, so to speak, with strength and sport science staff.
Failing to redo the battery of assessments is shortsighted and a lost opportunity. Perhaps most evidently, it would be a colossal failure to only monitor areas of weakness and ignore what makes the athlete great in the first place. If those qualities slip and backslide, the athlete may wind up worse than they started.
Dangers of Focus: Goodhart’s Law
Jo Clubb penned a fantastic and enlightening piece, “Why Every Practitioner Needs to Know Goodhart’s Law.”
In our setting, Goodhart’s Law dictates that when athletes and coaches focus too much on improving test measures, the value of those test measures may diminish or become irrelevant.
In Jo’s words: “We are in danger of optimizing for a metric that may not influence our ultimate goal (performance or injury) or, worse still, could potentially harm the goal.”
Coaches should take care not to make the performance test what matters and always keep in mind that enhanced game play is the end goal, says @KD_KyleDavey. Share on XI believe the list of test measures proposed in this article is a strong one, but I certainly don’t believe these are the only metrics that can or should be collected. Coaches should take care not to make the performance test what matters and always keep in mind that enhanced game play is the end goal.
Indeed, we see this in elite athletes who do not present elite physical attributes. Game knowledge or technical and tactical execution can often offset physical inadequacies.
An Afterword
I have previously outlined guidelines to complete an effective sprint analysis. Two of the points (which are relevant to team testing) deserve a word of expansion.
I recommended not using an iPhone to film and instead using an actual camera with a tripod. A camera serves dual purposes:
- Higher image quality.
- Professional appearance and execution.
While I state that iPhones are great for quick and dirty analyses—and I use my iPhone for immediate feedback during training sessions—the point of using a camera for formal analyses may have come across as a bit pompous, which was unintended.

Lastly, I recommended shooting at 120 fps in 4k versus 240 fps at 1080p quality (iPhone quality). This drew a bit of criticism, as folks accurately pointed out that 240 fps allows for a more granular calculation of contact and flight times as well as velocities via splits (4ms intervals vs. 8ms intervals). That is a fair point.
The solutions are simple: either film one sprint at 120 fps and 4k and the next at 240 fps or, as I do now, film all sprints at 240 fps with 2.7k image quality, an option my camera affords. The tradeoff between 4k and 2.7k for twice the frame rate is a good exchange.
Auditing Is the Future
The future of strength and conditioning will continue moving away from glorifying a single quality, like maximum strength, and will evolve more and more toward individualized interventions.
The future of S&C will continue moving away from glorifying a single quality, like maximum strength, and will evolve more and more toward individualized interventions, says @KD_KyleDavey. Share on XThe old style of programming is to give all athletes the same general strength and conditioning workouts, cross your fingers, and hope they get better. For developmental athletes and cases when full auditing isn’t available, general programming that addresses the major physical qualities will probably provide improvement most of the time.
But for the advanced athlete and coach seeking more than the minimum, customized programming tailored to specific needs yields greater results.
Athlete auditing reveals invaluable insights, provides a true north that guides interventions, and allows strength and conditioning coaches to confidently program at an elite level to elicit elite results.
Since you’re here…
…we have a small favor to ask. More people are reading SimpliFaster than ever, and each week we bring you compelling content from coaches, sport scientists, and physiotherapists who are devoted to building better athletes. Please take a moment to share the articles on social media, engage the authors with questions and comments below, and link to articles when appropriate if you have a blog or participate on forums of related topics. — SF
References
Goodwin JE and Bull AM. “Novel Assessment of Isometric Hip Extensor Function: Reliability, Joint Angle Sensitivity, and Concurrent Validity.” Journal of Strength and Conditioning Research. 2022;36(10):2762–2770.
Wild JJ, Bezodis IN, North JS, and Bezodis NE. “Characterising initial sprint acceleration strategies using a whole-body kinematics approach.” Journal of Sports Sciences. 2022;40(2): 203–214.


Nice and complete article Kyle! Thanks
Thanks Mariano, I’m glad you enjoyed it!