The block start has been used in international competitions since 1937 and was first seen at the Olympics in 1948. Starting from a fixed block was shown to be advantageous over a standing start or non-starting block crouched position in the initial sector of sprinting. This is due to its favorable position to develop horizontal over vertical forces in the initial few strides to enhance acceleration.
However, starting block positions vary according to anthropometric measures, limb strength, flexibility, asymmetry, and athletic experience. Biomechanist Dr. Ralph Mann goes into extraordinary detail in this area, and I heartily endorse his book The Biomechanics of Sprinting and Hurdling for those wanting more detail.
Some coaches will also have athletes whose techniques are raw and unrefined and whose positions have remained unchanged since they first put spike to block.
The Project
I am fortunate to work alongside one of Australia’s best technical coaches, Scott Rowsell of RAD Squad. Together, we undertook a project to improve the first 10 meters of a 10.6-second sprinter using Plantiga to guide our decision-making. You can read more information on Plantiga in a previous article here.
We undertook a project to improve the first 10 meters of a 10.6-second sprinter using Plantiga to guide our decision-making. Share on X
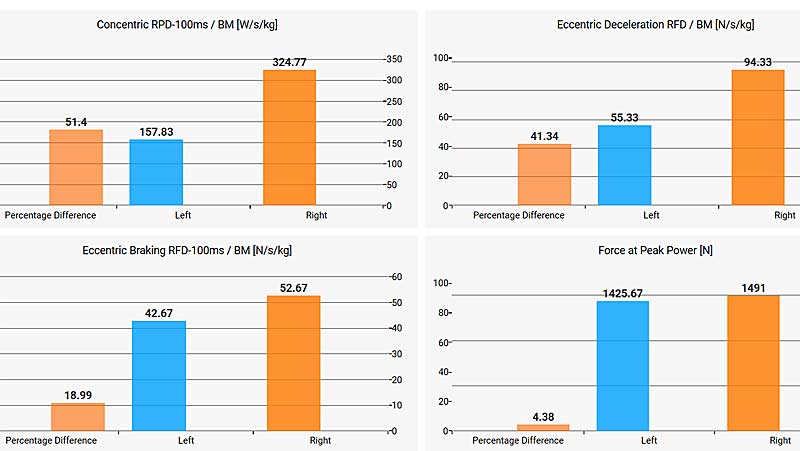
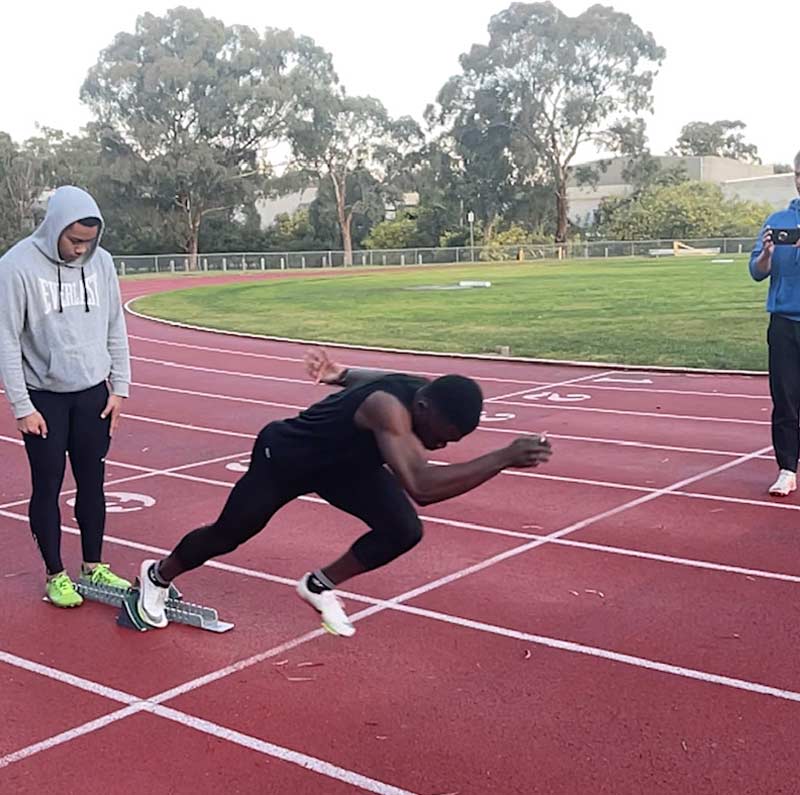
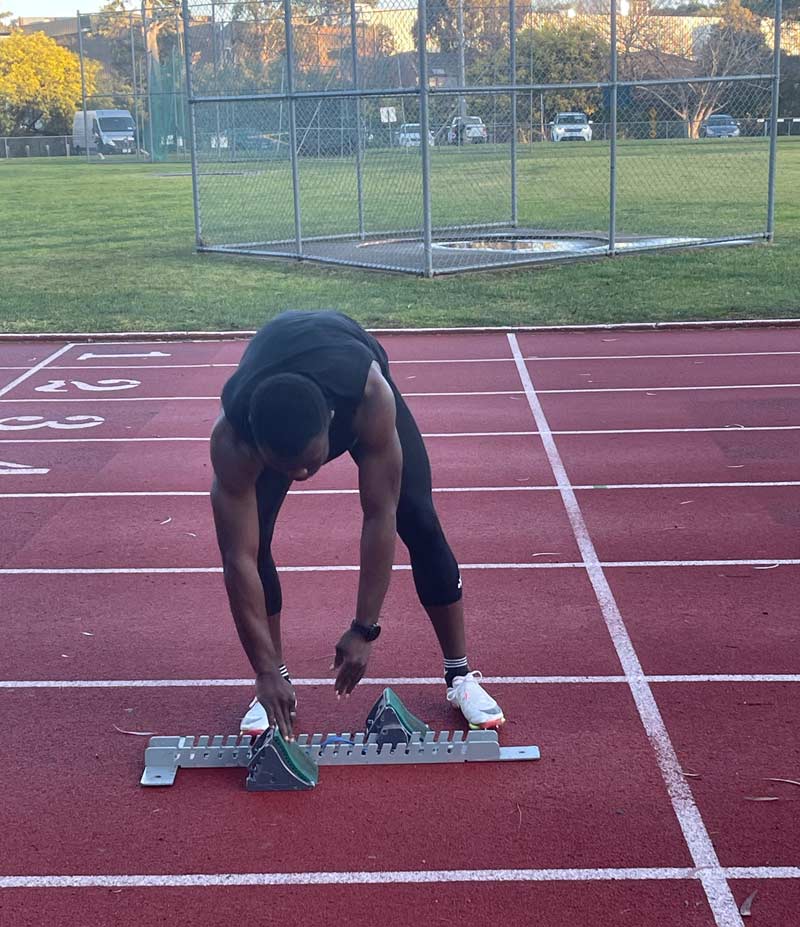
The athlete has adopted a “right foot back plate” position (see image 1 above) over the last five years; however, individualized strength and force plate testing demonstrate more power and concentric force-producing capability in the first 100 milliseconds on the right side (see figure 1 below).
Therefore, the rationale was to switch him to a “left foot back plate” position to place the more powerful right limb in the front block and then take advantage of the longer contact time and force-generating ability out of the blocks (see image 2 below).
The Data
Left Foot Back Plate Position
Figure 2 shows the raw data collection of just the first five steps of this athlete’s block start with his “left foot back plate.” Plantiga enables you to zoom in or zoom out on this sort of data, allowing for deep, individualized analysis or a basic summary report with essential metrics such as load, peak acceleration, peak velocity, and asymmetry, to name just a few.
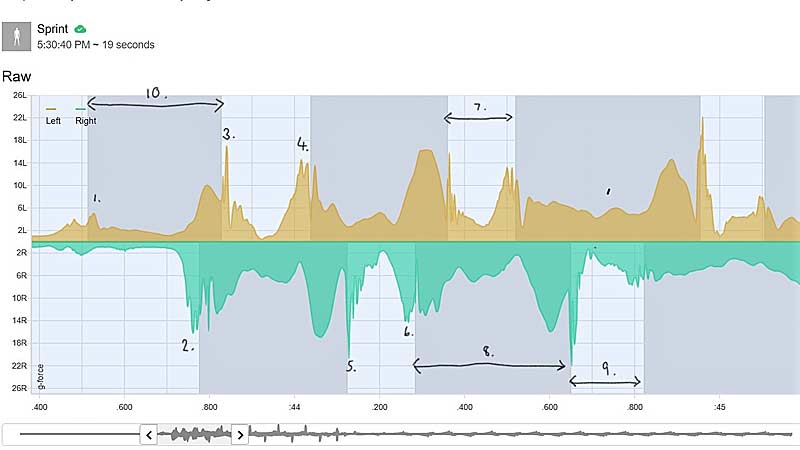
To simplify the explanation, the following points relate to the data pictured above:
- Rear (left) foot push-off.
- Front (right) foot push-off.
- Step 1. Left foot strike (landing acceleration).
- Left foot push-off.
- Step 2. Right foot strike (landing acceleration).
- Right foot push-off.
- Step 3. Ground contact time.
- Right foot “air time.”
- Step 4. Ground contact time.
- Time from rear foot leaving the block to first step.
The time to step 1 (point 10) for the left foot back plate position can be measured using the software. This is one of the most important considerations in perfecting the block start. An early first step would indicate a smaller first step, allowing for optimal acceleration rates as the center of gravity remains ahead of the leading foot. In this case, the time recorded was 0.314 seconds.
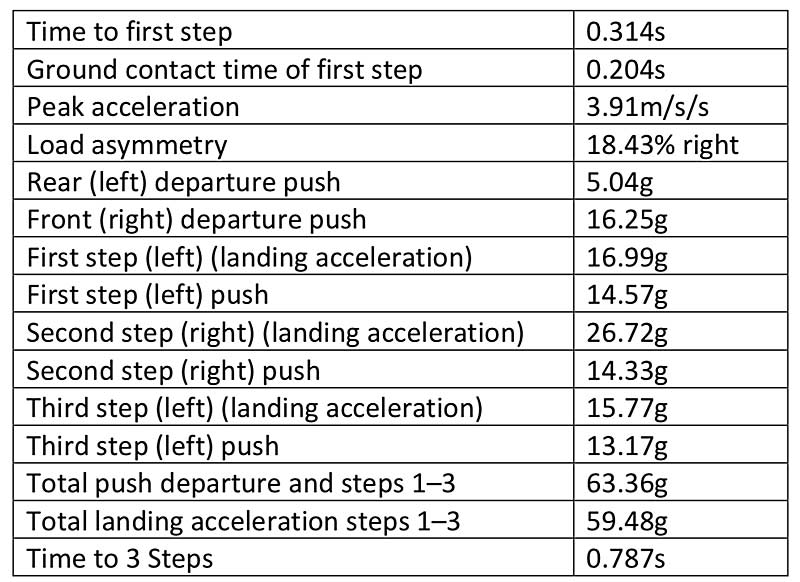
Plantiga enables you to zoom in or zoom out on this sort of data, allowing for deep, individualized analysis or a basic summary report with essential metrics. Share on XIn addition to the data generated automatically by Plantiga (e.g., peak acceleration, load, and ground contact time asymmetry), other data of relevance would be the push-off and landing accelerations across each step. The landing acceleration is similar to ground reaction force (GRF) in this case but measured in units of gravity (g), not Newtons (N).
Figure 3 displays this for the first three steps.
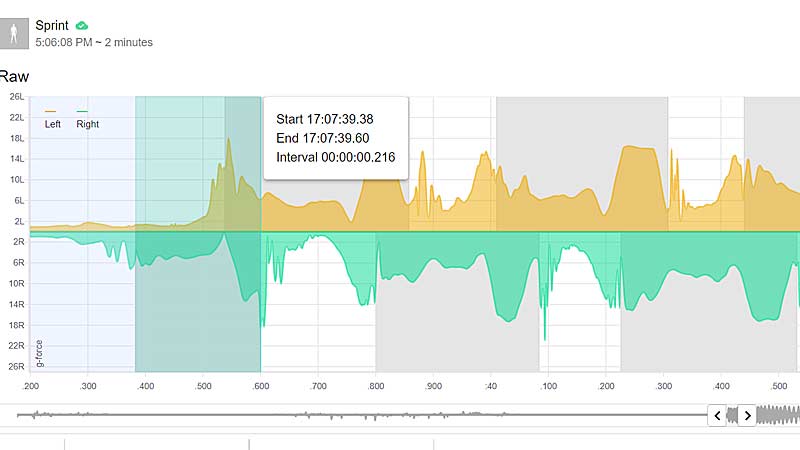
Right Foot Back Plate Position
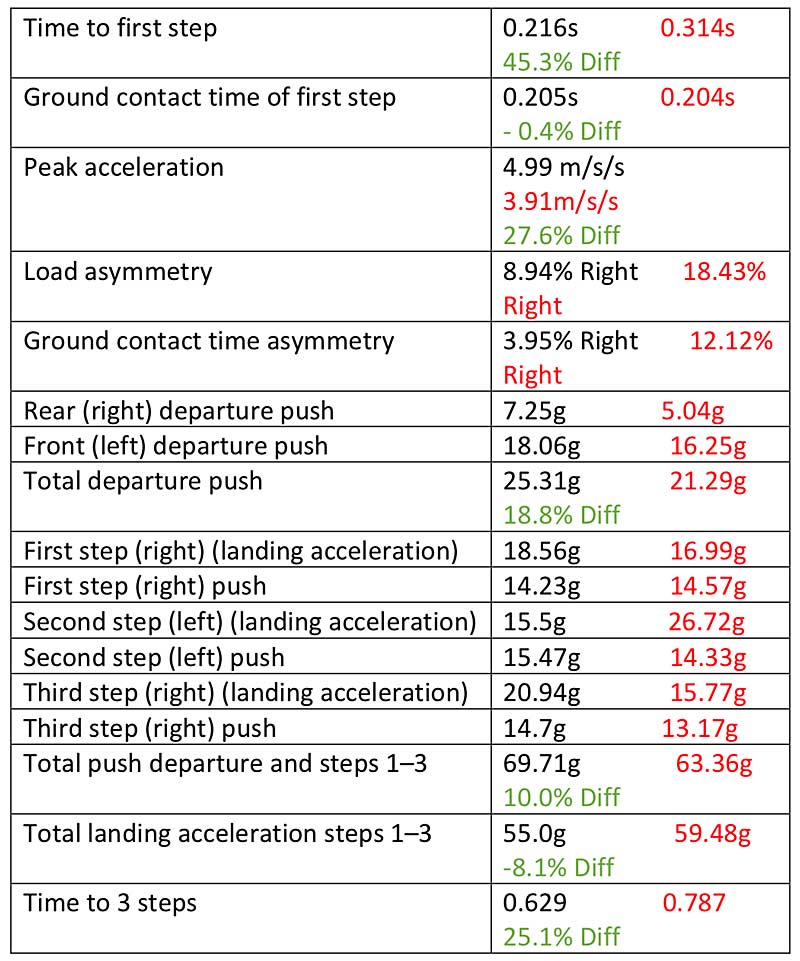
As a comparison, the figures in red below are shown for the left foot rear plate setup.
Summary of Key Data
The data that can be retrieved from the Plantiga software to assist in the technical analysis of an elite sprinters block start is quite outstanding. It can be summarized into the following data sets: Time and Technical, Power and Acceleration, Load, and Asymmetry.
Time/Technical
Time to three steps showed a 25.1% difference (0.629 seconds to 0.787 seconds) between the right foot back (RFB) and the left foot back (LFB), which is the newer unpracticed position. Time to first step was 45.3% quicker (0.216 seconds to 0.314 seconds) with RFB, though GCT on first step was comparable across sides.
This is suggestive of poorer starting mechanics in the LFB but similar ankle stiffness across both sides.
Power/Acceleration
Peak acceleration of 4.99 m/s/s with RFB was 27.6% better than LFB. This was supported by a total departure push (rear and front foot push) from the blocks being 18.8% higher and the total push from blocks to step 3 being 10.0% higher for the RFB position.
Load
Total landing acceleration (similar to GRF) was 8.1% higher for LFB, where the total push force described earlier over the first three steps was 10% less. We could hypothesize that the mechanics induced by the less-familiar LFB position generated positions that resulted in higher landing accelerations and the observed asymmetry.
The presence of these two variables is undesirable without observed improvements in “departure force” or time to three steps, potentially creating an injury risk if exposed over time.
Asymmetry
Load asymmetry was 18.43% to the right for LFB compared to 8.94% to the right for RFB and ground contact time 12.12% to 3.95%, respectively, to the right. As we saw with force plate testing (figure 1), the right leg was able to generate higher force than the left, so the asymmetry to the right was expected.
Results and Final Takeaways
The data reflects that sprinting from a block start is a skill and requires a learned technique. This athlete had five years of an RFB position and only a small number of trials in the LFB prior to this testing session to ensure safety, which explains the inferior results observed as described above.
If this had been trained over many months, we could satisfactorily state that it is not worth pursuing this position change. But at this point, with the limited number of sessions, it is still unknown.
Will the time and energy spent refining the new block start position yield an overall benefit to the 100-meter sprint? Plantiga provides objective, professional-grade data that can help you decide. Share on XThe question that the athlete and the coach must answer is, will the time and energy spent refining the new position yield an overall benefit to the 100-meter sprint?
The rationale for its pursuit is sound, utilizing the more powerful right leg at the front for the longer block contact phase. However, could a similar result be achieved via an increased strength focus on the left leg at the front block angle?
These questions epitomize the art of coaching—but coaching without data is subjective. Plantiga can provide a plethora of objective, professional-grade data specific to assisting this decision-making process. It is simple, quick, unobtrusive, and within the financial reach of even the amateur athlete.
Since you’re here…
…we have a small favor to ask. More people are reading SimpliFaster than ever, and each week we bring you compelling content from coaches, sport scientists, and physiotherapists who are devoted to building better athletes. Please take a moment to share the articles on social media, engage the authors with questions and comments below, and link to articles when appropriate if you have a blog or participate on forums of related topics. — SF

