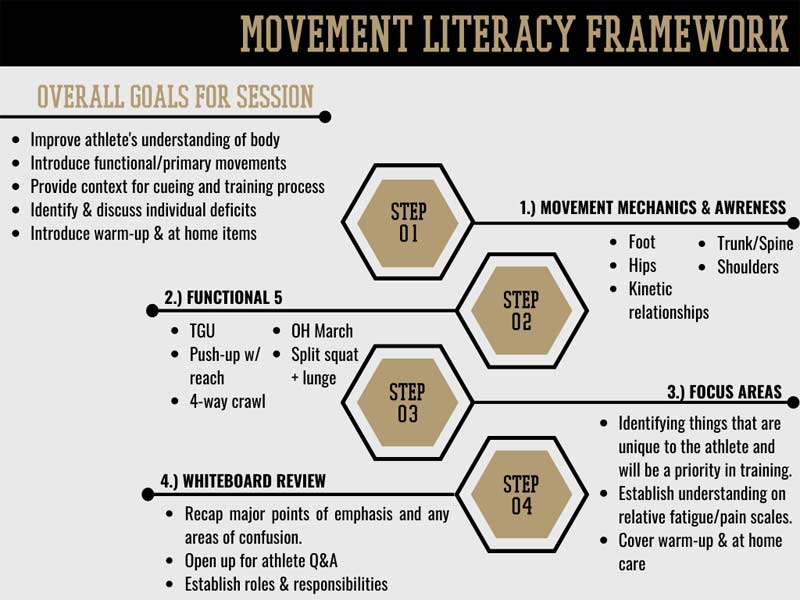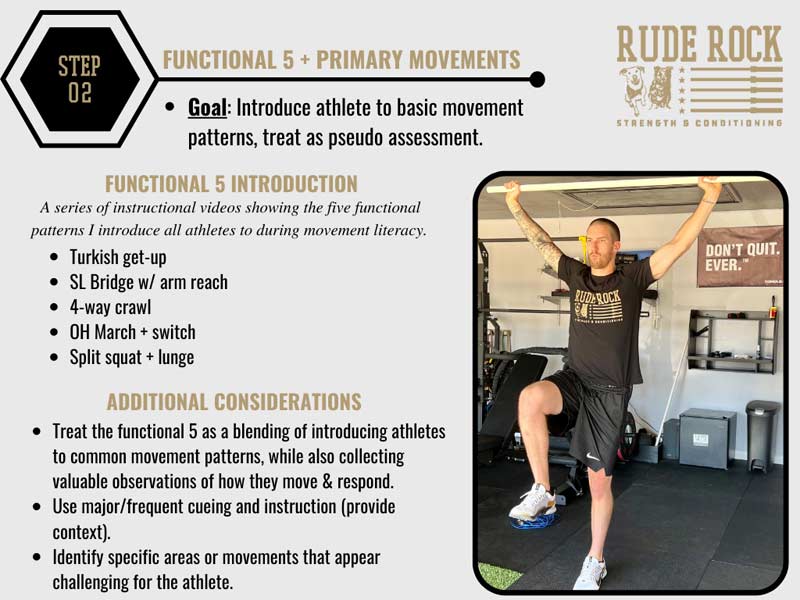
“Strength is measured in time.”
— Louie Simmons
Strength is important for every athlete, but even more crucial is displaying it over the course of time. For anaerobic dominant athletes, the ability to access strength immediately and accelerate through range of motion (ROM) is paramount. For the glycolytic-aerobic dominant athlete, maintaining output over the course of the event is key.
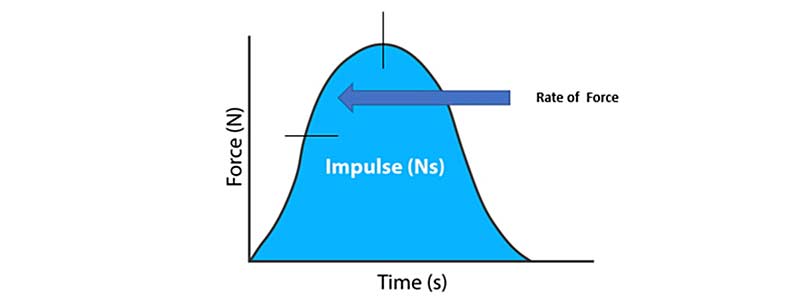
The application of strength in the first instance is known as Rate of Force Development—where he who turns their strength on immediately, wins. This will be witnessed in burst-oriented sports such as baseball, football, soccer, lacrosse, and basketball that rely on short-duration, explosive actions over the course of the contest. In the second instance, strength is accessed immediately and ideally maintained over the course of a distance-strength-endurance. Think stopwatch sports here: track, swimming, rowing, etc.
If the title quote holds true, then we can certainly appreciate the importance of time involved in applying and sustaining force. In essence, time can give us a way to quantify strength outside of the 1RM- or RM-type protocols.
While there is nothing wrong with max out sets or max rep sets, certain issues may mar their utility. Regarding a true 1RM, there is no strength test purer or more revered in the meathead psyche than crushing a big personal record (PR) single. The emotional euphoria coming off a big lift boosts the ego like nothing else, leaving you hungry to come back for more. A great state of being for sure, but how sustainable is it? We all know the answer: not for long. Dr. Bondarchuk even cited that the recovery time for a PR throw is about 15 days.1
While there is nothing wrong with max out sets or max rep sets, certain issues may mar their utility. Share on XWhile we certainly appreciate the 1RM mentality of our athletes in the weight room, a two‑week hangover will cost us valuable training time, especially if we are attempting to improve upon multiple bio-motor abilities at once. Not to mention the bulk of our trainees may not even possess the ability to recruit the high threshold motor units to benefit from maximal loading. In this case, what are we really testing (or training, for that matter)?2 In my opinion, training should give more than it takes from you at every level.
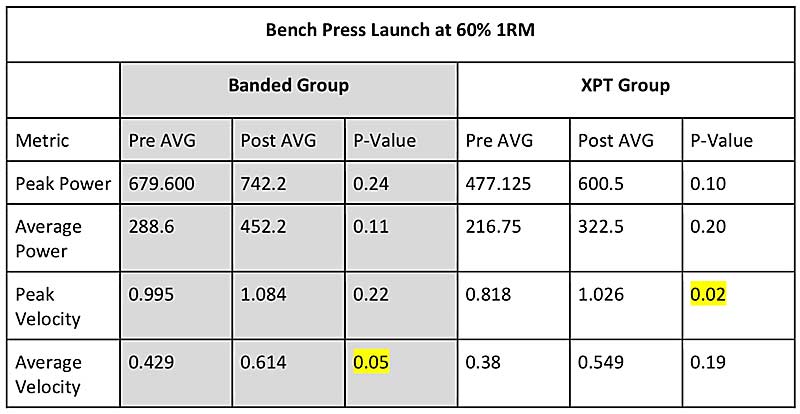
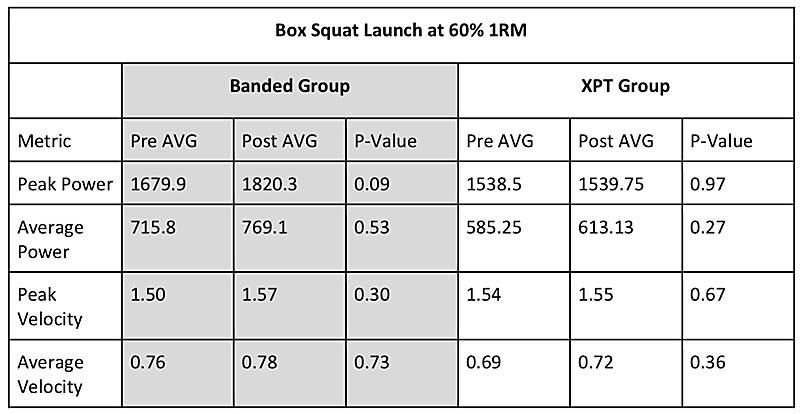
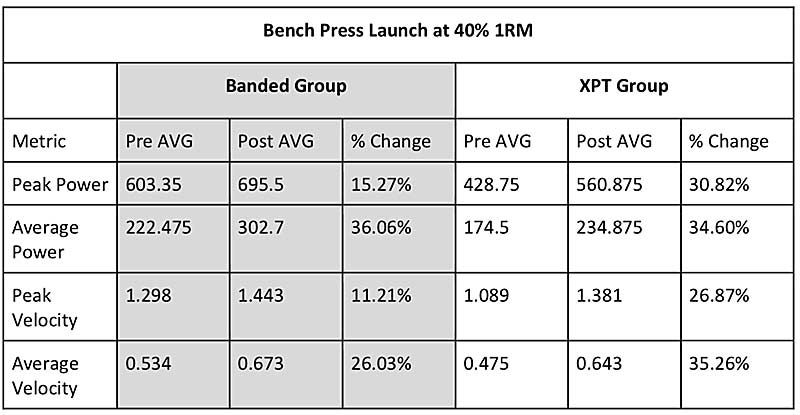
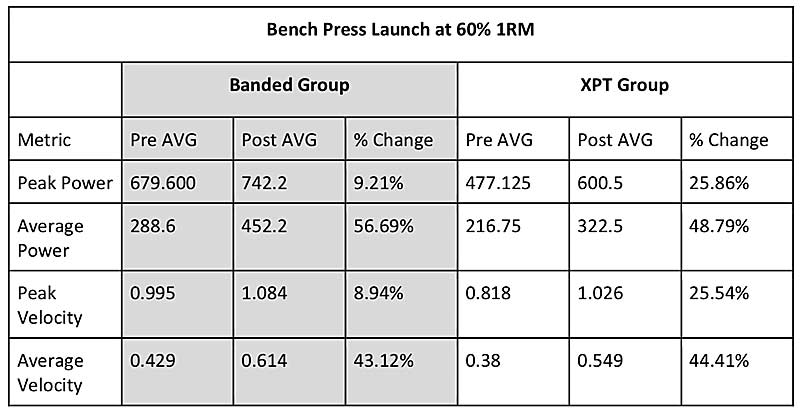
Bar Speed and Velocity Based Training
If applied strength for athletes lies within producing it quickly, accelerating through the ROM, or maintaining output over time, then I would assume submaximal loads would be of the highest utility. If total reps (within a set) are kept within a range of quality, then it will be tough for things to go awry.3
One common new way to measure strength improvement is via bar speed through a velocity measuring device. These are great because you can extrapolate a “1RM” based on speeds you hit along a spectrum of submaximal loads and also manage loading for a particular training effect. This process is relatively simple if you have the tools—but what if you don’t?
One common new way to measure strength improvement is via bar speed through a velocity measuring device. These are great because you can extrapolate a 1RM based on speeds you hit along a spectrum of submaximal loads. Share on XIn the case of the author of the opening quote, Louie Simmons timed his world class bench press lifters and the same theme rang true—personal best and world record attempts were completed in no more than 3.25 seconds during the concentric, phase and if the effort went beyond this, then the lift would fail.4 From an absolute strength standpoint, this is a slow lift where extremely heavy weights are moved by those that possess the skill. From a special strength perspective, we can use the same line of thinking with submaximal loads. We can apply a time constraint within a given rep range; let’s say X number of reps within Y time.
In fact, Louie wrote about this as well to justify the rep range for dynamic effort work in the bench press and squat, keeping to the three-second rule for both. If the double in the squat or triple in the bench was significantly over this mark, then the weight is too heavy; if it was under the time cut, the load was deemed too light (keep in mind the time applies to the total reps within a set including the eccentric portion and amortization phase; we’ll delve into the details of this later).
Roots and Applications of Timed Max Effort
I must mention that this idea is not an original of mine, but a version of one I read about close to a decade ago. I can’t find the article I have in mind, but I believe it was written either by Dave Tate or Louie Simmons and titled either “The Timed Max Effort” or “Max Effort for Time.” It is also possible that title was a section of a larger article. My apologies to the original source for this imperfect citation, but I hope they know their variation lives on in spirit in these protocols.
At Performance Inspired Training, Inc., we routinely apply these protocols to the bench press, so I’ll present this as our example:
- Beginning with 50% body weight, we pick a range of 3, 5, or 10 reps depending on what we are trying to affect. We time the set with a stopwatch, aiming for one rep a second on the initial set.
- On the next set, we’ll add five total pounds and give an extra second to complete.
- If the previous set is completed within this time frame, then we add another five pounds and an additional second.
- We usually perform three sets but with the lower rep ranges we may go up to five.
The three- and five-rep protocols are obviously geared toward the anaerobic dominant athlete—the power athlete! We’ve used this with football players and baseball players to bridge the gap of general strength to applied strength that develops not only the RFD, but also the ability to “load” the eccentric rapidly. For the front seven players on the gridiron, the ability to absorb and control the impact of an oncoming opponent will determine the outcome of that interaction. For a baseball player learning to load the antagonist muscle groups for a throw with speed, the rhomboids, rear deltoids, and biceps will potentiate the stretch reflex of the prime movers in the throw (pecs, lats, triceps) for increased arm speed.
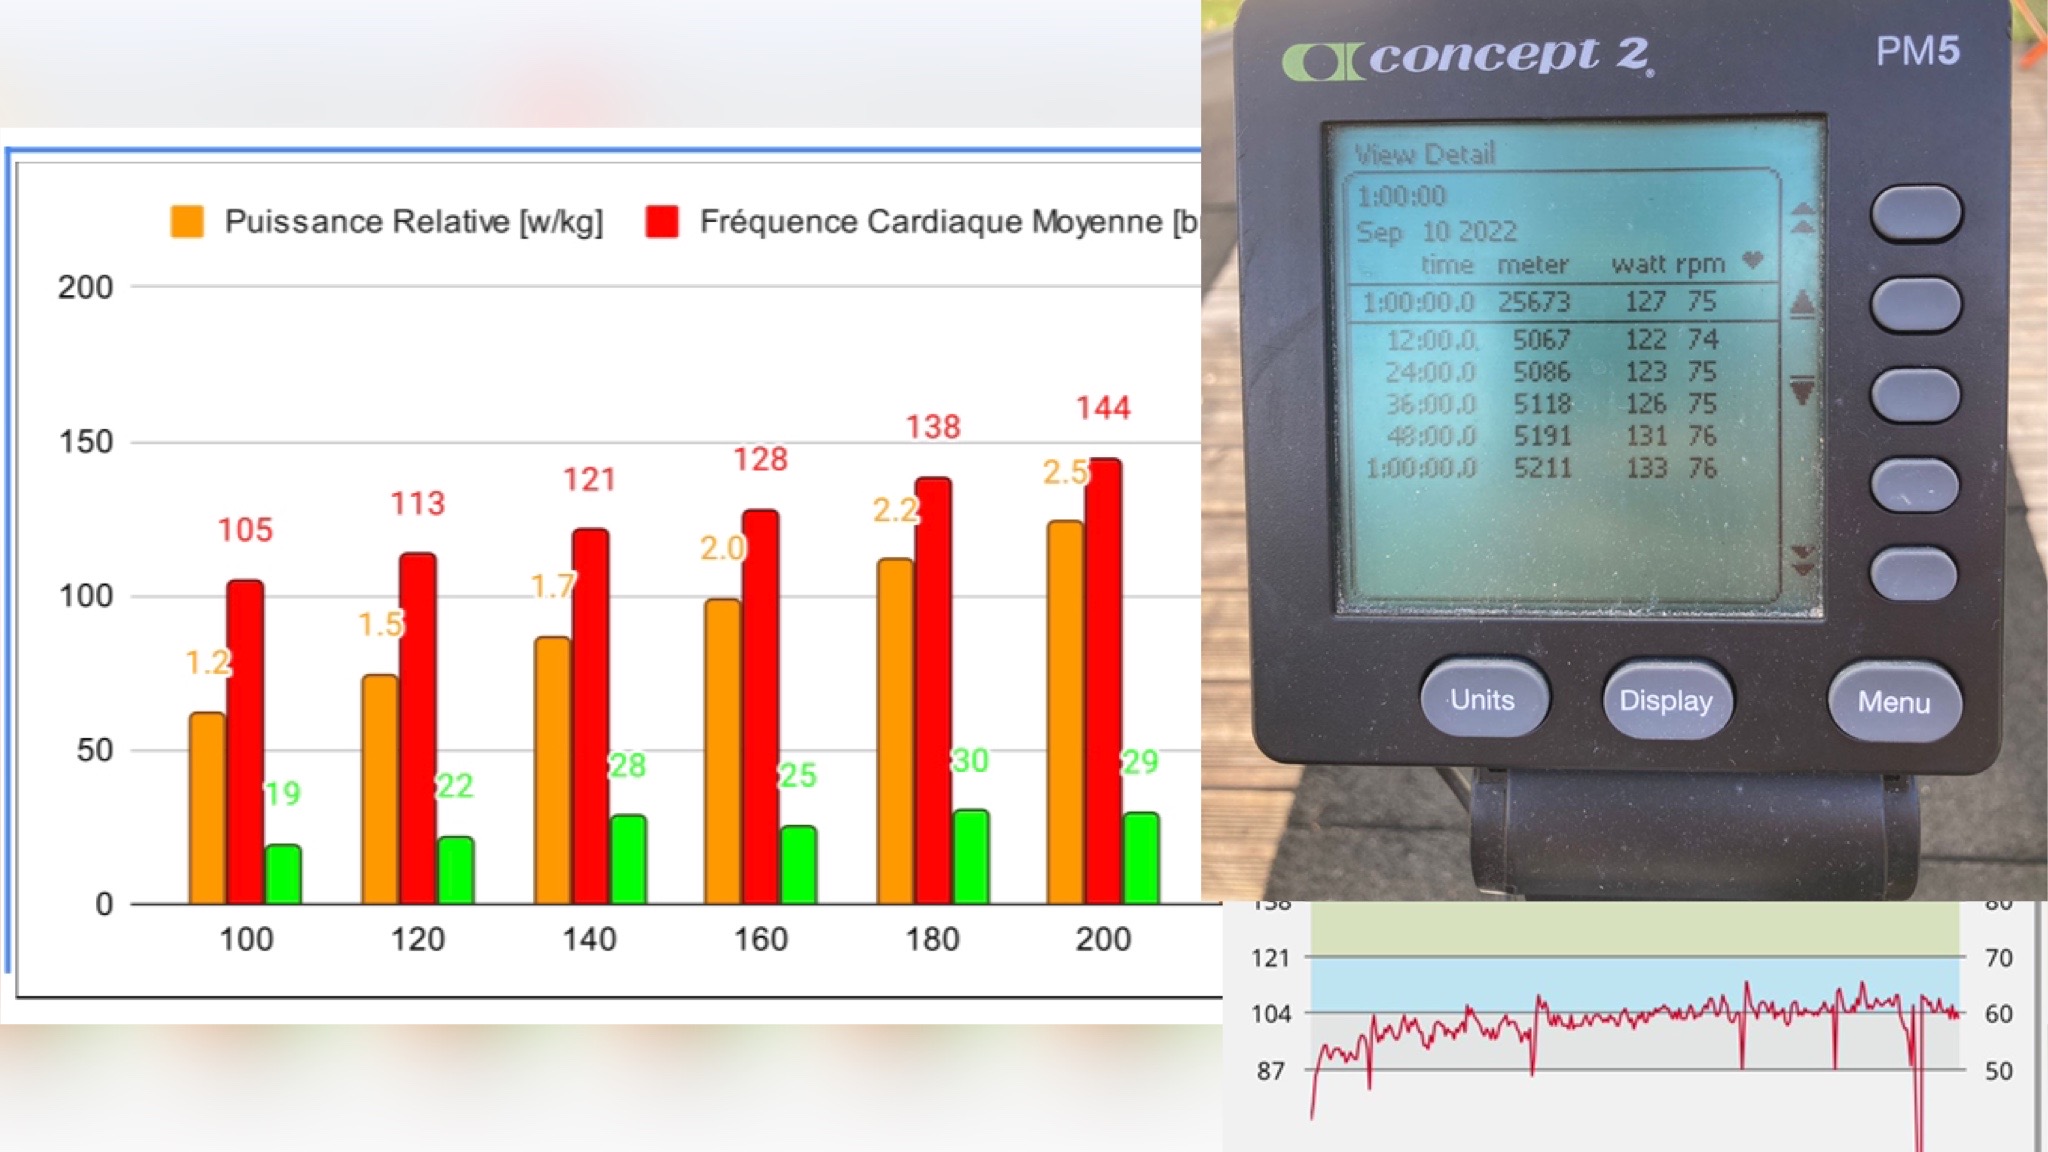
For the front seven players on the gridiron, the ability to absorb and control the impact of an oncoming opponent will determine the outcome of that interaction. Share on XIn the 10-rep protocol, the idea is the same but the effect is a bit different. For this timeframe, we are venturing into the endurance end of the spectrum. We are talking about the stopwatch sports like track and swim, where the ability to access power immediately and sustain it makes the difference between winning, placing, or neither. The concept is simple: the one who decelerates the least wins the race. By this logic, you’d better be able to stay strong for the time it takes to complete your race.5
We’ve applied this method in the training of male swimmers with some pretty good live results. This protocol was part of a proprietary program that helped lead to an Olympic Trials time cut in the backstroke for a 17-year-old high schooler. I have confidence in claiming this because this period of training was strictly in the gym during the lockdowns of 2020 when these kids were banned from training in the pool. We were able to sneak into a gym for three months of remote coaching, where this method was used throughout that period. When swim practice and meets commenced, it didn’t take long for this newly found power to be demonstrated as state and local pool records fell and the trial cut was attained.
We began as described above with ~50% body weight (100 pounds) for 10 reps in 10 seconds and climbed to a 30-pound increase over six weeks. After getting stuck at this mark for a couple of workouts we adjusted to a six-rep protocol using the same loading rules and improved to 175 pounds (~80% body weight) for six reps within six seconds. This process was interesting, as he was able to hit the 175-pound mark within three workouts (we used 10-pound increases at this point)—but was stuck for the remaining nine sessions before the six-second mark was cracked. My guess was that his system needed time to acclimate to stabilizing the load eccentrically for total power to be realized.
Timed Max Effort Protocols
In hindsight, this mode of work corroborates with DB Hammer’s definitions of work zones. Hammer classifies work zones as response and reserve.6 In my interpretation, we can understand this as:
- Developing a surplus of strength.
- Developing the ability to sustain it.
Some would argue, “Why not just do higher reps in general to effect strength endurance?” Hammer states, “A set of 10 squats vs a set of 10 shrugs are not equal.” The time demanded and systemic effect are hugely different given the difference in ROM and musculature used.
From a periodization standpoint, the zones of work (response and reserve) build on each other. Each time bracket is good for raising the capacity of work of the one beneath it. For example, work in the 9-25 second range is better for pure anaerobic development (4.5-9 sec.). The work in the longer periods allows some aerobic effect, allowing one to decrease recovery time between bouts of exercise and between intersession bouts, and to repeat outputs close to terminal level.6This gives coaches a working template to structure longer-term training cycles based on time where changes can be based on tracking performance effect. Like above, when my swimmer got stuck in the 10-rep protocol we dropped to a shorter time bracket of work and kept the needle moving forward.
Here are two protocols in live action:
Video 1. 10-Rep Protocol
We can see here that Pat progresses from 110 pounds in 12.55-13.07 seconds in week one to going sub-10 seconds with the same weight in the first set of the following week. In set two of week two, we move up to 115 pounds and add one second (10.62) to the time restraint. He hit the set in 11.10 seconds, so for the third set we kept the weight, which was hit for 10 reps in 11.66 seconds. Bar speed dropped a bit, but overall, a five-pound improvement in approximately one second less than the previous week. For week three, we will load the initial set with 110 pounds.
For MJ, his best set with 110 pounds was done in 13.63 seconds. His initial set in week two was performed in 12.30 seconds (1.33-second PR). We increased to 115 pounds with a time cut of 13.30 seconds and the time performance was the same as the first set. Given he made the cut within a second, we bumped the weight up another five pounds for the next set. It’s not in the video, but MJ pressed 120 for 10 in 13.43 seconds, which is 10 pounds heavier and one second faster than week one.
Just to be clear, I’m using the 10-rep protocol here with swimmers whose shortest race is in the 20-23 sec range. Their energy demands are different, as they must sustain power over time to cover as much “ground” as possible. This is known as stroke economy. This timed max effort feeds right into a racer’s mentality, allowing them to keep their mental focus sharp in training.
This timed max effort feeds right into a racer’s mentality, allowing them to keep their mental focus sharp in training. Share on XVideo 2. 5-Rep Protocol
Here we have a couple of multisport athletes, MS and Wheels, whose demands call for short bursts of strength where the tissues of the upper body must “load up” (eccentrically) in rapid fashion.
MS hits his initial set of 85 pounds in 4.06 seconds. This is very fast (and borderline too light)—but the key is that intent was applied and confidence was built. For set two we added five pounds and MS hit the set in 4.55—another fast one! Set three called for 95 pounds and another sub-five second performance, with 4.76. The next week we began with 95 and MS hit the five in 4.56—a two-tenths time drop! For set two, we jumped to 100 pounds for five timed at 4.73 seconds—which is just as fast as the previous week’s third set with five more pounds. For set three we added another five pounds for 105, which MS hit in 5.23 seconds. He is currently at 75% body weight with this effort.
For his training partner, Wheels, this was his first workout with this method. So, we established a baseline and were able to progress from 95 to 105 pounds within the course of the session. He was even able to hit his second set faster than the first.
Using time to quantify sets as opposed to pure load allows us to realize the benefits of dynamic effort and max effort simultaneously. Share on XUsing time to quantify sets as opposed to pure load allows us to realize the benefits of dynamic effort and max effort simultaneously. A maximal intent to move the bar as fast as possible within the given time frame can cover the short burst power spectrum to the special endurance. Not to mention, we have two ways to set a personal best every session—which helps in the incentive department. Give this method a try!
Since you’re here…
…we have a small favor to ask. More people are reading SimpliFaster than ever, and each week we bring you compelling content from coaches, sport scientists, and physiotherapists who are devoted to building better athletes. Please take a moment to share the articles on social media, engage the authors with questions and comments below, and link to articles when appropriate if you have a blog or participate on forums of related topics. — SF
References
1. Mann, Bryan. “Testing & Statistics.” Strength Coach Network Fundamentals Level I.
2. Mann, Bryan. “Maximal Strength Development.” Strength Coach Network Fundamentals Level I.
3. Tsatsouline, Pavel. “The Origins of Strong First Programming: The Soviet System.” StrongFirst: The School of Strength. Retrieved from: www.strongfirst.com/the-origins-of-strongfirst-programming/
4. Simmons, Louie. Book of Methods. Westside Barbell. 2007.
5. Harvey, Nate. “How to Smash Track PRs with Timed Squats.” EliteFTS. Retrieved from: https://www.elitefts.com/education/how-to-smash-track-prs-with-timed-squats/
6. Buchenholz, Dietrich-Heinz. The Best Sports Training Book Ever. 2004.