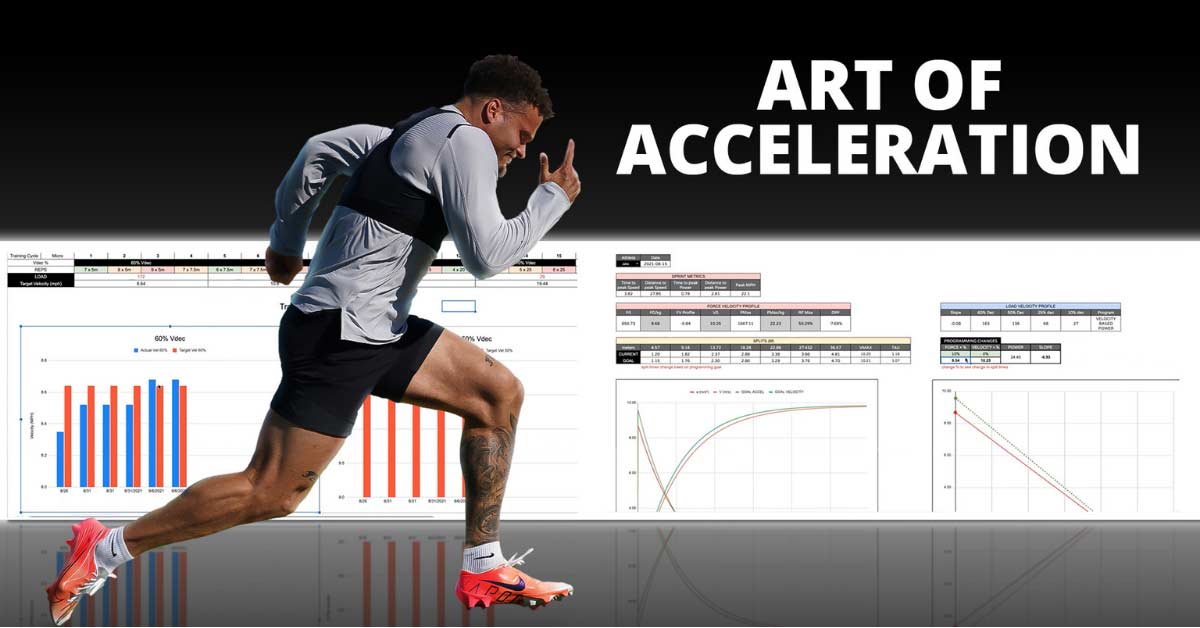
In his course “The Art of Acceleration,” Les Spellman lays out the blueprint for creating an individualized speed development program that has been proven to get tremendous positive results. There is no disputing the science or the program’s effectiveness; however, critics are typically unsure of this approach’s applicability to a large, diverse group of athletes—particularly in the public (as opposed to private) domain.
I have successfully applied this approach from the Power 5 collegiate level all the way down to the high school level. What follows isn’t a regurgitation or a summary of the course. Instead, it’s a practical guide of the ins and outs and dos and don’ts of how you can logistically implement these principles yourself, presented by someone who has practical experience with this system.
For full disclosure, I didn’t just learn about the concepts presented when I watched this course, as it was only released recently. This is a speed journey and the evolution of ideas that Les has taken to a level that he and I only dreamed about years ago, when we were exchanging DMs with JB Morin and filming Pro Day guys with the first-generation MySprint app. “The Art of Acceleration” is the single best resource on the market for learning how to be a scientific architect of speed and developing an individualized program that will make your athletes significantly better in a very short amount of time.
This course will help you prescribe targeted intervention strategies that are logistically manageable and brutally effective at improving an athlete’s speed & acceleration abilities. Share on XThe course shows what makes Spellman truly unique—it’s not just a collection of drills but an entire attitude and approach toward speed development that is innovative and effective. You will be able to assess athletes efficiently and prescribe targeted intervention strategies that are logistically manageable and brutally effective at improving an athlete’s speed and acceleration abilities. It takes the guesswork out of programming and allows you to “look under the hood” at the underpinnings of an athlete’s expression of speed, diagnose in an objective manner precisely what they need to improve upon, and prescribe a training program specifically designed to address these needs. Best of all, it shows you how to create a system around these assessments, making it organized, structured, and adaptable to all training environments.
Background and Connections
I first met Les Spellman in 2012, when I was working at Sparta Performance Science in California’s Silicon Valley, and he was a rugby athlete for USA 7’s who had popped in for some training sessions. We were doing some cutting-edge stuff with force plate technology and individualizing training programs based on movement signatures derived from vertical jumping. It opened to me an entirely new way of looking at movement and planted the seeds for doing the same type of analysis for speed development.
When I left Sparta and went to the University of California, we were the first college football team to utilize force plate technology. I was given the freedom to apply the concepts adopted from Sparta to our team’s speed development program by associating certain movement signatures derived from force plate testing with specific strengths and weaknesses in the 40-yard dash. I wrote an article about it you can still find: “Forty Yard Sprints and Force Plates; How to Sniper Speed Development.”
While a step in the right direction, it was imperfect because it was based on vertical rather than horizontal force production.
From Cal, I moved on to Texas Tech, where, as the Director of Speed & Power for football, I had free rein to go as far down the rabbit hole as I needed to find something to give our team a competitive edge. This is where things really started to accelerate (no pun intended). This period was when JB Morin’s research, among others, began to introduce force-velocity profiling, and it is also when I reconnected with Les and connected with Cam Josse. Both were outstanding, like-minded resources for pushing the envelope on individualizing speed development. You can read about what we were doing at Tech in “Optimizing Sprint & Jump Training Based on Individual Force-Velocity Profiling.”
As the system started to evolve and Les (and Cam, for that matter) started to get the recognition they deserve, I continued to apply these principles at the University of South Carolina with Combine/Pro Day and return to play (RTP) football athletes and again with the football team at Washington State University. Finally, it is the foundation of my system even now at the high school level at Bishop Lynch High School in Texas, where I currently coach along with being a member of the Spellman Performance team for the NFL Combine campaign. That’s what makes this system great: its versatility. Les’ system has produced numerous first-round draft picks, Olympians, and professional athletes, but it has also helped develop middle school and high school athletes.
Les’ system has produced numerous first-round draft picks, Olympians, and professional athletes, but it has also helped develop middle school and high school athletes, says @CoachSSal. Share on XRead on for a “from the trenches” perspective on how you can implement it with your population, regardless of your level.
Three Components of Training Acceleration
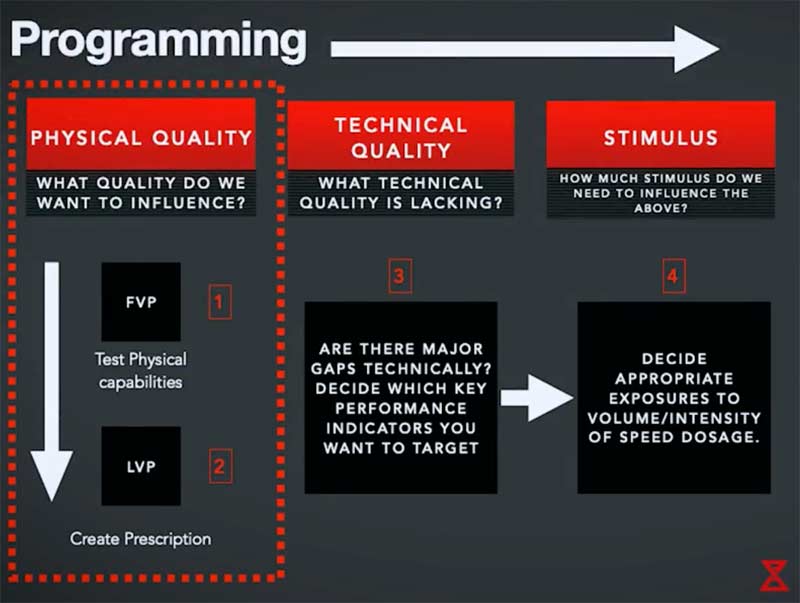
Les breaks training down into three components:
- Physical
- Technical
- Stimulus
We’ll work through them in that order.
Physical
This piece refers to an athlete’s force production and power output ability. The first thing we need to do is force-velocity and load-velocity profile the athletes to “look under the hood” and gain insight into these abilities. This profile tells you at what velocity the athlete performs suboptimally, coinciding with a specific piece of the sprint (start/early accel, transition, or MaxV), and dictates where you will get the most bang for your buck in training.
You can, if necessary, run this system without profiling your athletes. As the largest co-ed private high school in Texas, we have close to 700 athletes. They haven’t all been profiled, and arguably, many of them can improve simply with basic skill development (and it’s clear they all need to get stronger). But for many, such as varsity football and athletes from other sports who have committed to play at the collegiate level, the system is very beneficial.
Also, because the athlete-to-coach ratio is so high, it’s not always in our best interest logistically. But all of our teams still implement this system; it is just periodized in a vertically integrated and comprehensive fashion, progressing from short to long, slow to fast, heavy to light, etc., in specific blocks of time. This system produces a “well-balanced” program addressing all strength and speed qualities.
In college, however, because there are more coaches and fewer athletes and the technology is so much better, profiling each athlete on your respective team is a valuable use of time to gain insight and individualize programming for a superior competitive edge.
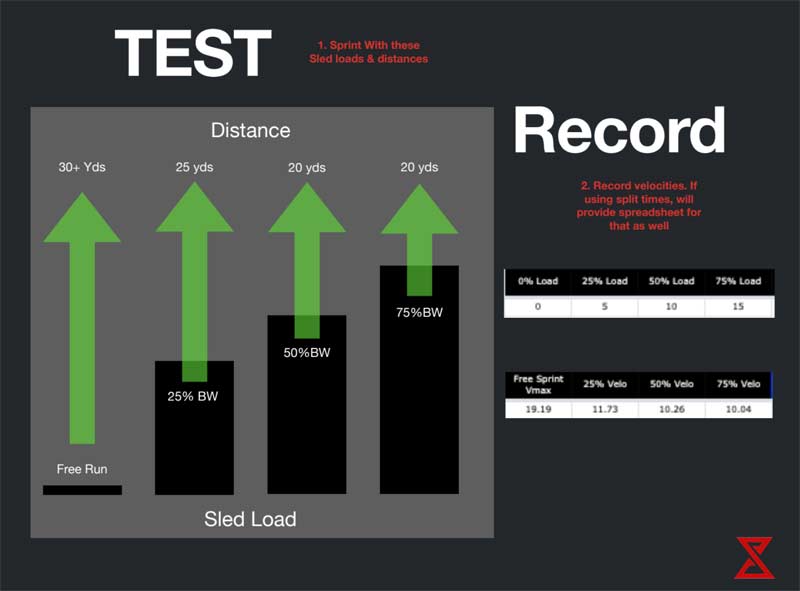
Now that Les has pioneered GPS to profile athletes if you have that technology, it is your best bet, as it is time-efficient and user-friendly. You don’t even need to have any “testing” day: just have the athletes sprint 30 yards with their unit on—non-weighted for FVP and then at 25%, 50%, and 75% body weight for LVP—and you’re all set. It looks just like a typical training session.
Video 1. Slow motion view of athlete accelerating into a sprint while capturing GPS data.
With any GPS units that only give you max velocity (as opposed to isolating each rep), you simply utilize the same process, just in reverse. Start with heavy and record each rep’s velocity value, as each rep will get progressively faster. Without GPS, it takes a little bit more time, but with the next-best option—laser timing gates—you just set up a testing day where you get 10-yard (or ideally 5-yard) splits with each load for each athlete and plug them into the spreadsheet that comes with the course (or JB Morin’s spreadsheet that can be found online).
One last option is the MySprint app, which I still use occasionally. It works well with smaller groups and can be useful anywhere there is less of a budget for technology. When I first made the move to the high school level, I dusted off the app and started filming sprints. The best thing to do in this instance is to first film all the sprints in the “slo-mo” video setting—otherwise it won’t work in the app—rather than trying to run the app in the heat of battle.
Bang out all the videos first, then go back when you have time and run the analyses. Force-velocity profiling will help you “bucket” athletes by their primary needs. Load-velocity profiling will help you prescribe individualized sled loads, just like you would for a barbell exercise in the weight room, based off the sled load that produces peak power.
Reactive Strength Index (RSI) and vertical force velocity profiling are other beneficial tests, as you will learn in the course—these are a secondary means of bucketing athletes, and for us they help dictate strength protocols in the weight room. RSI measures the athlete’s ability to be elastic (optimize ground time relative to air time), and there are various pieces of equipment to measure this, most commonly the Just Jump mat. Force-velocity profiling will direct you as to what strength qualities will be best addressed for that athlete in a weight room setting (e.g., max strength, strength-speed, speed-strength, etc.) for best results in performance.
Any device that measures barbell velocity will work well in this instance. JB Morin has an outstanding resource online for computing this as well. However, once again, the My Jump 2 app has stood the test of time for both of these; just remember to film in slow motion first and analyze later, just like the sprints.
Technical
As mentioned in the course, the start profile is the key metric that we initially need to identify in this domain. This is simply a measurement of time to toe-off out of a static stance, and then air time and ground time of the 0 step, first step, and second step, contrasted with the step length of each as well. The simplest way is to just set up cones as references (hash marks on a football field work as well) to gauge step length, and then use the app of your choice (I use Runmatic) to time the slo-mo video to get the air times and ground times. This will identify the athlete’s strengths and weaknesses in early acceleration and, when compared to the FVP information we gathered, give a clearer picture of where to “bucket” the athlete (which we will get more into later).
Video 2. Performing a video review to provide specific feedback to athletes.
The same thing can be done for max velocity mechanics. I usually choose three steps, culminating in the penultimate step of the sprint, and repeat the same exact process in order to see ground and air time metrics in the later phases of the sprint. This, combined with the RSI measurement we took, will once again aid in “bucketing” the athlete into the correct training program.
You can see in the charts the ideal ratios for these values, but in general we want to see the ground times get shorter, the air times get longer, and the step lengths increase as the athlete advances. Another useful metric here is the “kickback score,” which is a way to evaluate technical efficiency and evaluate to what extent the athlete “butt kicks” rather than steps over the knee in a concise fashion. For this, you will need a kinogram (again, I use Runmatic).
*Key side note: Even though the majority of traditional speed training focuses on the start and the finish, the transition is a place where, anecdotally, I have seen many athletes fail. This is something profiling will help identify. If they have a good start and still reach a high velocity but for some reason aren’t running the time you would expect, this is probably the culprit.
Even though the majority of traditional speed training focuses on the start and the finish, the transition is a place where, anecdotally, I have seen many athletes fail, says @CoachSSal. Share on XIn a conversation we had about this very phenomenon, Bobby Stroupe called this “the black hole.” In profiling, this shows up as an athlete who has a poor “DRF” (decrease in ratio of force). Essentially, they are capable of producing a high amount of horizontal force, but they bail on it in favor of vertical too quickly. We will dive deeper into this, as well as training interventions, later in the programming section.
Video 3. Athletes performing wall drills in a speed training session.
Stimulus
This is true, full-speed, all-out sprinting. The two most important things here are being patient in order to give sufficient rest times and ensuring maximal volitional intent. One minute of recovery per 10 yards of true speed is the standard recipe, which sounds like a lot, but I have found that if you are truly watching, coaching, giving feedback, and encouraging athletes to listen to each others’ corrections, the time flies by.
As far as the intent piece, there are several ways to manage this. First, as I always joked in college, you could line up a bunch of guys wearing NFL polos with clipboards and stopwatches. Seeing as that’s not a realistic option for most, the next best way is to laser time the sprints. You will get max effort typically because athletes are competitive; they want to beat their time, and you can’t hide from the truth. Having that data is also an excellent way to track progress over time. A live feed from a GPS system works as well if you have staff free to monitor the laptop without any coaching responsibilities.
Another efficient way to get maximal intent that works in all scenarios, both low-tech and high-tech, is simply to race. Again, athletes are by nature competitive: they love to win and hate to lose. To keep the races fresh and give everyone a fighting chance, I set up a number of different “heats” based off speed. Each week, we tabulate the results, and if an athlete had the most wins in their heat, they move up a group; if they came in last the most times in their heat, they move down a group. The number of races is based on a predetermined volume I want to hit. As stated in the course, 150 yards on an acceleration day and 250 yards on a max velocity day (resisted sprints are accounted for in this total too) are good thresholds.
Another efficient way to get maximal intent that works in all scenarios, both low- and high-tech, is simply to race. Again, athletes are by nature competitive: they love to win and hate to lose. Share on XWe typically time on max v days and race on accel days. Obviously, if you have GPS units, you will wear them throughout. With this setup for the “stimulus” aspect, nobody on your team gets stale, and they know they must show up to perform.
Putting It All Together
There’s a section in the course that lays out very clearly and succinctly the various options to choose from for planning a microcycle. I’ll detail my preference, which is a three-day speed model:
- Early acceleration day
- Late acceleration/transition day
- Maximal velocity day

From there, I bucket athletes based off FVP. This is all covered in the course, but if you haven’t seen it, I will summarize how I approach it. The particular variables we look at are F0, Peak RF, DRF, and V0:
- F0 – The total amount of force produced, which is clearly heavily influenced by the weight room and strength qualities.
- RF – The ratio of horizontal to vertical forces at the beginning of the sprint (to put it in perspective, below 50% Hz is bad, 50%–55% Hz is solid, 55%–60% is good, above that is outstanding).
- DRF – The decrease in ratio of force—essentially how much Hz force an athlete loses in favor of vertical for every incremental increase in speed (once again, to provide perspective, 10% and above is poor, 9% is okay, 8% is solid, and 7% is good).
- V0 – Maximal velocity and the ranges will vary by age, sport, and position.
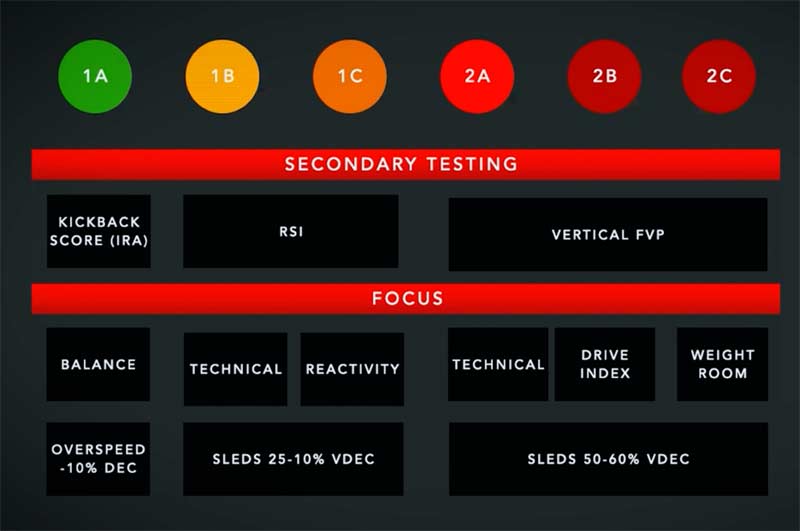
As I mentioned earlier, the overall scheme of the speed program is shorter to longer (distance), heavier to lighter (resistance), and slower to faster (velocity) over the course of the training cycle. This is where the individualization starts to bleed into the program. The course refers to these buckets as 2A-2C and 1A-1C. First, it is important to note that all athletes will spend time training all qualities: strength-speed/early accel, speed-strength/late accel, and velocity in a weekly micro. This ensures the retention of qualities that are already strengths and also allows for overlaps in training that help logistically.
However, in the first layer of individualization, athletes poor in F0 and RF (2C-2B) will stay in the first block (heavy) for an extended period of time and with a much higher percentage of weekly volume devoted to early accel/strength-speed work. Athletes who are poor in RF and DRF (2C-1C) will advance to the second block (medium) and stay there for an extended period and with a much higher percentage of weekly volume devoted to late accel/speed-strength work. Athletes who are poor in DRF and V0 (2B-2C) will advance to the third block (light) and stay there for an extended period while allotting a higher percentage of weekly volume to velocity work.
You will rarely see an athlete who is good at everything but just needs to get even faster. In fact, at the high school level, most athletes are in bucket 2B or 2C and need strength stimuli. But even assuming you have a wide variety of athletes, at this level there are still at the most three groups going at one time and typically only two (easily handled by almost any coaching staff). Athletes on a training template with less than three speed days would obviously prioritize their needs. For instance, in an athlete needing strength-speed, early accel would be one full day, and then if there’s a second speed day, late accel, and then max v only if there’s a third day allocated for speed, such as in my preferred model.
You will rarely see an athlete who is good at everything but just needs to get even faster. In fact, at the high school level, most athletes are in bucket 2B or 2C and need strength stimuli. Share on XThe next piece of individualization, the LVP (load-velocity profile), just dictates the weight on the sled. This gives you the load associated with peak horizontal power as well as the loads associated with different speed decrements and therefore different strength qualities (i.e., strength-speed, speed-strength, etc.). We already do this in the weight room; just carry the same method over to the field. Set each sled off the highest possible load, with a variety of plates, and give each athlete their number. Post it in the locker room and carry a list out to the field with you on a clipboard just in case. If you have Run Rockets or the like, this becomes even easier—just know your number and turn the dial.
Everybody, regardless of what bucket/block they’re in, will sled sprint, all that’s different is the load. If you haven’t LVP’ed, use percent of body weight but still manipulate it heavy, medium, and light to correspond with the different horizontal strength qualities. If you don’t have sleds, use bands: again, thick, medium, and thin as resistance. These are also more portable and easier to set up for coaches who are crunched for time between groups or must change locales frequently.
Dichotomy of Needs: Physical vs. Technical
Essentially, if the requisite strength qualities are in place as evidenced by profiling and secondary tests such as RSI and vertical jump FVP, but we’re still not getting the times desired, then it’s likely a technical issue.
Each session will already have a technical and physical component, so at this point, it’s simply a matter of volume. All the athletes in your group will already be doing the same drills, but technical guys will stay on the technical piece for slightly longer before moving over to the sleds; physical guys will move to the sleds earlier to get a few extra reps there. Then everyone will come together for the stimulus and race.
Logistics shouldn’t scare you. At the most, a coach will have 2–3 things going on at once. Last summer, when I first moved to the high school realm, I was a one-man show; even then, I still had a technical drill and a physical drill going on at once (directly overseen by a position coach), while I oversaw the whole operation. The technical group would pop off two reps for every one rep of the physical group, but I controlled rest times and each set was on my whistle. The sport coaches helped with organizing lines, crowd control, and motivation, while I coached and controlled work to rest.
We got better.
Obviously, in the system “physical” alludes to resisted running but also includes plyometrics and med ball throws. The list of plyos that you can use is long and distinguished (showing my age with the Top Gun reference), but in general, accel days are complemented by longer GCT exercises like broad jump variations while speed days are complemented by shorter GCT exercises like pogos, hurdle hops, etc.
As far as the technical piece, Les has another outstanding course called “Speed Pillars” that gives an idea of the drills that complement this system. In acceleration, examples include A-series, wall drills, banded projection and banded three-step, MB starts, kneeling starts, and four- and seven-cone drills. Velocity examples include dribble series, straight leg series, an assortment of bleeds, buildups, and wicket runs of varying distances. You probably have your own favorites. Obviously, that’s just a start, but it gives you an idea—drill selection will be dictated in large part by training emphasis and also placed on the yearly training calendar as coordination, difficulty, and intensity progress over time.
An additional aspect that falls more in line with the “art” side that can be influenced by these protocols is coaching language. Cueing can have a tremendous impact on coaxing technical adjustments; however, coaches often just repeat the same handful of tired and worn-out cues. With this system, coaches can individualize their feedback based off how the athletes are bucketed in much the same way that the program is individualized into groups to emphasize certain qualities. For instance, a 2C athlete (lacking force) and a 1C athlete (lacking reactivity) might do the exact same drill, but the 2C athlete could be encouraged to “push,” “project,” or “drive” while the 1C athlete might be encouraged to “pop,” “punch,” or “spring.” Tailoring instruction to meet the needs of the athletes will complement the environmental interventions and optimally bring out the desired technical and physical qualities we want to develop.
Tailoring instruction to meet the needs of the athletes will complement the environmental interventions and optimally bring out the desired technical and physical qualities, says @CoachSSal. Share on XDifferent Sports and Different Positions
The last layer of bucketing would be adjustments made based on sport or position. For instance, some sports have little to no max velocity requirements. Some positions, such as a lineman in football, do not have the same high-velocity requirements as a skill position player. I like to include max-velocity work whenever possible, because as Ken Clark and others have demonstrated, raising maximal velocity raises all associated speed qualities, just like raising maximal strength raises the ceiling on the ability to develop associated strength qualities. That being said, for some sports/positions, it’s not as big of a priority. So, in my lineman example, no matter how the lineman tests, he will never be in the velocity bucket, ensuring that he always gets an extra helping of volume where he needs it most: in early acceleration work.
Additionally, I have seen tremendous success with this system in the return to play population. There are several reasons for this:
- The abundance of physical data provides metrics to compare an athlete to their “healthy” self to make a quantitative decision as far as what percentage of health the athlete is functioning at. JB Morin has shown that even when an athlete is able to hit their previous max velocity, some of the underlying force parameters are still sub-par, risking reinjury.
- The technical analyses provide the qualitative piece to determine if the athlete is moving well or still has visible compensation in their movement patterns.
- All the resisted running—progressing from heavy, short, and slow to light, long, and fast—is a good ramp-up to return to play, as often it is the speed of movement that is painful, not the muscular effort. This allows us to execute sprinting movements in a high-force, but safe, low-velocity environment. This is complemented by skips, switches, and dribbles at higher limb velocities but still traveling forward at a safe, scalable pace.
Bang for Your Buck
Now to the important part. This all sounds good in theory, and you can see how it’s simple enough to pull off logistically…but is it worth it? Does it work? Why does it work? Specifically, what type of results can you expect?
In addition to Les’ resume with top-flight draft picks, improving their times and draft stock, I have consistently seen improved times at every level and in every situation that I’ve been in. And the best part is I can look under the hood and see why they improved; or, if they didn’t improve as much as we wanted, I can see what went wrong and know precisely what to work on.
Let’s look at some numbers from an athlete I consider to be the median of what you can expect. Rather than just give a summary of values, I think it’s more beneficial to really dive into a truly representative subject and look at the good, the bad, and the ugly of a standard eight-week “pre-40-yard dash test” training cycle and the effect it had on a college football player, in both the physical and technical realms. Then I will quickly touch on how he was bucketed and what interventions we made.
First, the physical. As you can see, this athlete shaved .2 off his 30-meter time in a standard eight-week cycle. The benefit of this system, again, is that rather than guess, we can see exactly how this happened. His velocity improved from 16.5 mph to 18.2 mph, and his theoretical max velocity (V0, or the speed he would reach based on his acceleration curve if he had continued to run past 30 meters) improved from 16.8 mph to 18.6 mph.
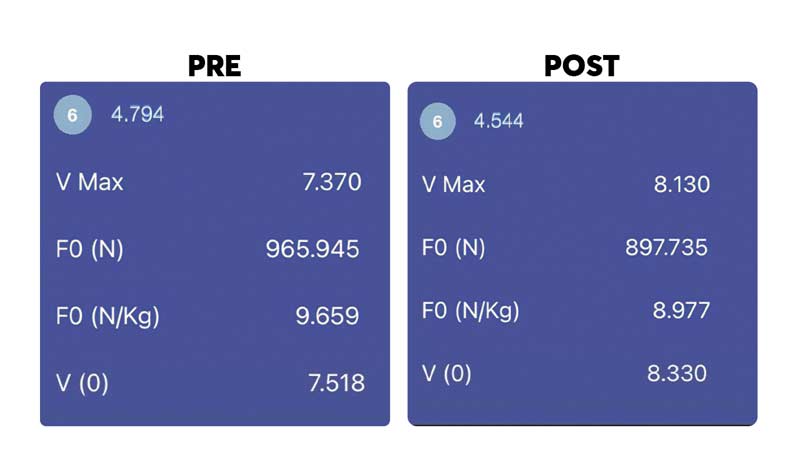
These numbers are from the MySprint app, which I’ve found to be conservative on velocity measures. This athlete touched 19 mph on their tested 40 according to GPS. In that same picture, you can also see that his F0 or total force and relative force (N/KG) at the beginning of the sprint actually got worse. This obviously was not the intent, and had I done a better job of retaining this piece, the results could’ve been even better. I attribute this to getting speed greedy and de-emphasizing general strength work. It was a good learning experience.
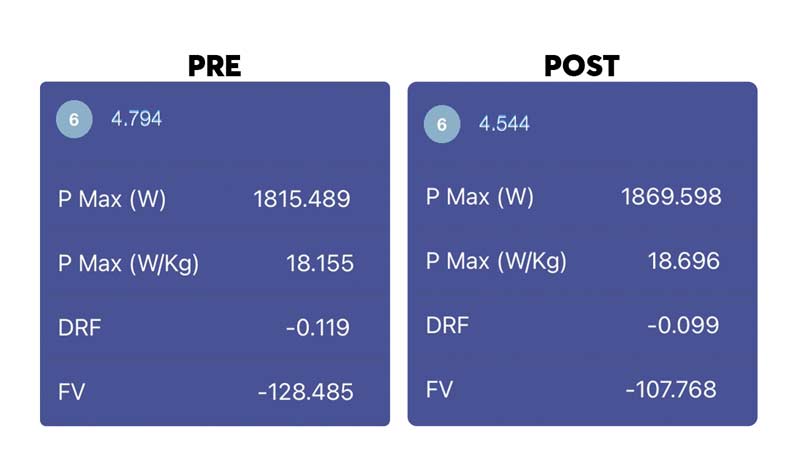
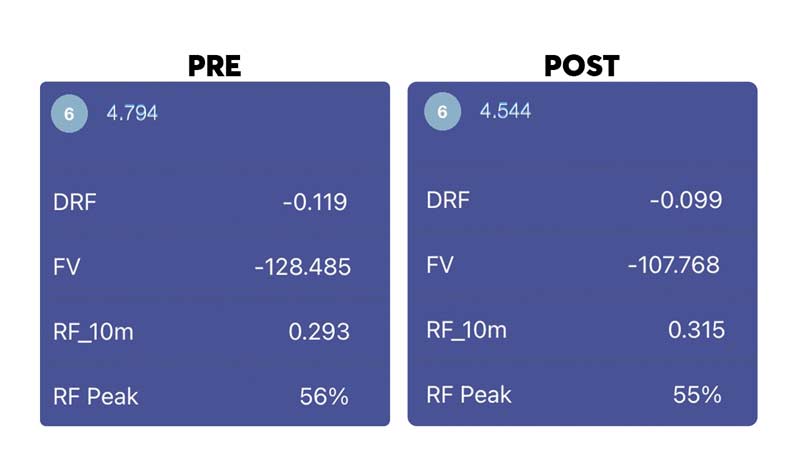
In this next image, you can see that, even though the force production took an unfortunate dip, peak power still improved from 1,815 watts to 1,869 watts, indicating an improved ability to produce force at higher speeds, which was one of our primary training targets. In this view, you also see this athlete’s main weakness: DRF, which improved from a terrible 11% to a mediocre 9%—but even that small change can yield significant improvement in late acceleration for an athlete that has this as their weakness. RF stayed relatively the same at 55% and 56%.
So how can the athlete still have a decent start and maintain their RF (recall, ratio of horizontal to vertical force at the beginning of sprint) even with a decrease in total force? Mechanical (i.e., technical) efficiency.
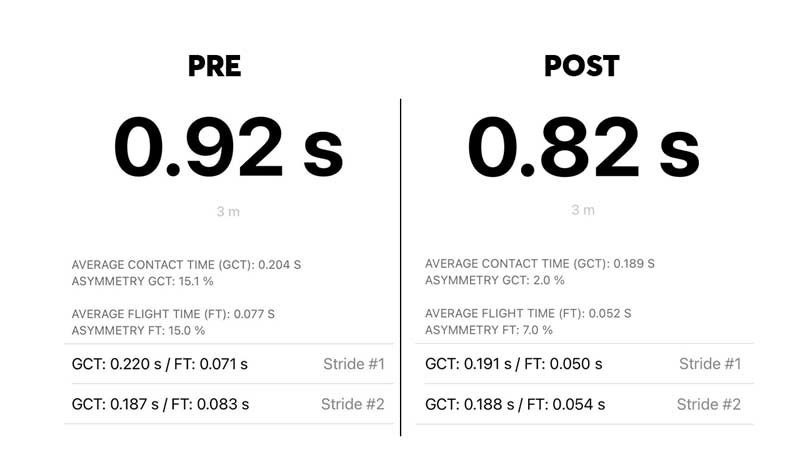
In this image, you can see that the athlete shaved .1 off their “start profile” (remember, one of the primary technical KPIs), which is essentially their time to 0 step, and first and second step. He decreased ground contact time on his first contact and decreased air time on both steps (arguably too much when compared to the ideal measures). This resulted in a greater horizontal orientation of the body and a steeper angle of projection and allowed him to hit the same stride lengths with a more positive shin angle, when analyzed on film.
This subject was bucketed as a 1C, being physically deficient in velocity-based power. He had a balanced vertical FV profile, so good vertical force, solid F0, and a good RF; and, as we say, technically sound at early acceleration. He had a terrible DRF and a poor RSI, and his 10–20 split was his worst split, relatively speaking, keeping him from hitting a sufficiently fast top speed. His training focused on medium to light resisted sprints and reactive plyos while focusing his stimulus work on 20- to 30-yard sprints. He obviously improved a lot in a short period of time. As I suspected, the new vertical FVP revealed a force deficiency, which, along with the dip in F0, meant a renewed need for the weight room and heavier sled clusters to complement the continued accel work to keep improving DRF.
This subject is par for the course of what you can expect with this system. Anecdotally, I train myself with this same system and broke 20 mph as measured by GPS and ran under a 5.0 electronic at 41 years old for the first time since my late 20s. (I was only a 4.8 guy when I played in college anyway.) Obviously, there are other training components necessary for the success of a team sports athlete such as ESD, general strength, deceleration, mobility, etc. They are beyond the scope of this article, but the system incorporates those as well, and perhaps I can write a follow-up on that process.
Closing Thoughts
The beauty of this system is that it is an organized and methodical way to evaluate and group athletes based on specific needs in a fashion that is easy to manage and—most importantly—it gets results. It is impossible to do the “Art of Acceleration” course justice in a single article, but hopefully this gives you a glimpse of how simple and effective it can be to use with your athletes.
The beauty of this system is it is an organized and methodical way to evaluate and group athletes based on specific needs in a fashion that is easy to manage and—most importantly—it gets results. Share on XGo out and pick up the course, and while you’re at it get “Speed Pillars” too. You won’t regret it. Try it with your own teams and let us know if you have any questions. Best wishes and welcome to Speed City.
Since you’re here…
…we have a small favor to ask. More people are reading SimpliFaster than ever, and each week we bring you compelling content from coaches, sport scientists, and physiotherapists who are devoted to building better athletes. Please take a moment to share the articles on social media, engage the authors with questions and comments below, and link to articles when appropriate if you have a blog or participate on forums of related topics. — SF

