Every strength and conditioning coach in team sports secretly dreams about one thing—being called the “Fitness Guru” by journalists and peers in the field. There is no better feast for the ego than hearing the announcer in a televised match stating this with excitement, in terms like “They are dominating the physical battle!”
Indeed, in team sports, what we really strive for as S&C coaches is to somehow make our players less inclined to fatigue than our opponents as the game progresses. Being the mastermind behind a team that outworks the opposition, snatching win after win in the dying moments of the game regardless of any technical or strategical superiority…this is what we live for.
In team sports, what we really strive for as S&C coaches is to somehow make our players less inclined to fatigue than our opponents as the game progresses. Share on XSurprisingly, with so much at stake, nobody has yet come forward with the magic recipe for fitness dominance in team sports. Even worse, *conditioning* is the aspect of physical performance training that casually displays the least specific definition. If strength or speed development is discussed at length by purported field experts and academics—spreading clear principles and guidelines all over the internet—conditioning is left in a fog, subject to interpretation. Fitness in team sports is a complicated topic, where the range of efforts, durations, and intensities is wide and constantly varying—but this won’t prevent us from trying to establish a guideline usable for any team sport.
Knowing the Demands of the Sport
If you ask me if an athlete is fit or not, I can’t answer until you narrow that down to fit for what? Fitness in team sports and conditioning as a training component has three main purposes:
- To allow the players to meet the energy demands of the game they play.
- To prepare for the worst, the most intense, passages of play.
- To build mental and physical resilience.
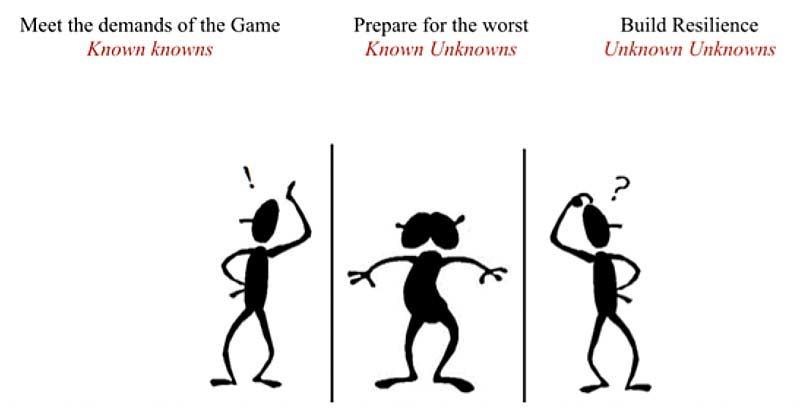
The first role of a conditioning program is nothing complicated or tricky. The energy demands of the game you play is a known known. All the information needed is readily available through game analysis.
The difficult part here is to accept that nothing fancy or new is required to nail that aspect of a conditioning program. Energy system pathways have been widely studied, and it is with good confidence that one can heavily rely on the findings from scientific papers when designing a conditioning plan. Everything we do requires the transfer of energy adenosine triphosphate (ATP). This is our body’s currency, and the more work needed, the more ATP needs to be produced. Because the intramuscular stores of ATP are relatively small (~5 mmol per kilogram of wet muscle), they are unable to sustain contractile activity for extended periods; therefore, other metabolic pathways must be activated.
Three basic energy systems exist in muscle cells to replenish ATP:
- The phosphagen system (anaerobic alactic): Provides immediate energy for short bursts (1-15 seconds) of maximal-intensity exercise by using energy stored in the muscle (phosphocreatine) without requiring oxygen (anaerobic).
- The glycolytic system (anaerobic lactic): Takes over just before the phosphagen system runs out and provides energy for moderate- to high-intensity exercise (10 seconds to 3 minutes) using energy from the breakdown of carbohydrates (glucose) and requires no oxygen (anaerobic).
- The oxidative system (aerobic): Predominant energy supplier for low- to moderate-intensity exercise, starts to predominate after about 2-3 minutes of exercise, and is the main source of energy after 3-4 minutes. It produces ATP through the breakdown of both carbohydrates and fats for energy and uses lactate as an energy source too. This system requires oxygen (aerobic).
The level of development of the various energy systems has a significant impact on translating athletic abilities into performance—therefore, designing a successful conditioning program starts with identifying which athletic abilities are critical to the sport and which energy system is involved in providing the necessary fuel to perform that ability.
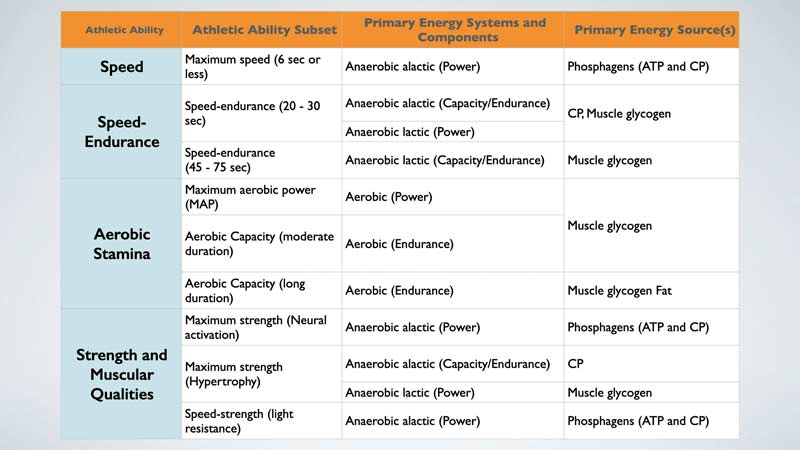
If this is a good place to start, unfortunately the relationship between an energy system and an athletic ability isn’t static. During exercise, the dominance of one energy system over the others depends mainly on these four factors:
- Exercise intensity.
- Duration of effort.
- Number of efforts produced.
- Type and duration of recovery between efforts.
In team sports, the last two are sometimes forgotten. With the obsession for repeated high-intensity efforts, it isn’t rare to come across coaches—armed with GPS targets and heart rate monitors—nailing the running intensity and mirroring their game demands in term of bout duration. But quite often, those same coaches arbitrarily define the number of efforts and the work:rest ratio used, increasing the former and shrinking the latter as a mean to progress the drill.
If an effort that is perfectly designed to target the lactic system is repeated too many times or without a proper work:rest ratio, it soon becomes a subpar aerobic stimulus, which may completely miss the specificity of the sport.
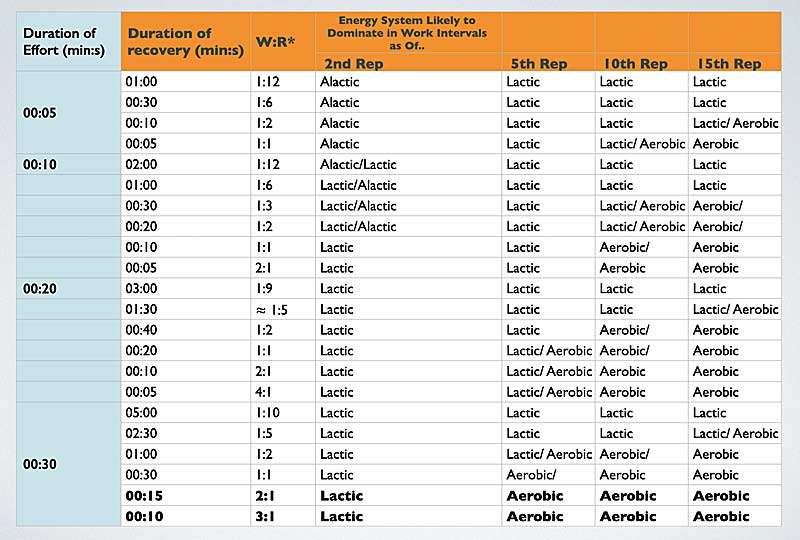
Coaches often feel pressured by time constraints when planning a conditioning session in team sports. The need to maintain the rhythm of the session to avoid facing a group of bored players waiting around for their next run makes it difficult to plan the long rest periods needed to target the lactic system. Moreover, rarely do S&C coaches get offered stand-alone conditioning sessions, and the fitness work must somehow fit in sessions that also include technical and strategical work, often in slots not exceeding 20 minutes.
A way to deal with such limitations is to work our way backward from the needed work:rest ratio to determine the duration of each effort. Instead of planning the effort duration in order to match a pre-identified key metric (e.g., average play duration) and the number of repetitions to match a subjective expected metric number (e.g., distance or number of sprints)—sacrificing without too much second thought the work:rest ratio—I would argue that we would often be better off ensuring we hit the target we want, physiologically speaking, before worrying about what the GPS will say.
I would argue that we would often be better off ensuring we hit the target we want physiologically speaking, before worrying about what the GPS will say. Share on XLet’s imagine, for instance, that we are planning a session of repeated high-intensity efforts aimed at stressing the lactic system. We are given 10 minutes. Alone with our whistle, we cannot afford any individualization of the runs’ timing, so it is convenient to go with the start-on-the-minute system. We can then select our effort bouts’ durations depending on the number of efforts we can afford in 10 minutes while respecting an optimal work-to-rest ratio. If we choose to go for 20-second bouts, at an ideal work:rest ratio of 1:5 to maintain the stress on the lactic system for the entire duration of the drill, we will get about six repetitions.
Planning Conditioning Games
Getting the work:rest ratio that you need is a relatively straightforward quest when the conditioning stimulus is obtained through a physical-only drill such as runs, jumps, or ground-based/wrestle-style activities. With the days of fartlek, MAS running, and repeated sprinting seemingly behind us, nowadays the trendy S&C coach vents to whomever is happy to listen about how they get their players fit and ready for the competition without taking away the specificity of the game. In the era of obsessive need for specificity, conditioning games and “worst-case scenario practice” are at the center of sports teams’ conditioning programs.
However, while throwing a ball around may slightly increase the technical demand placed on the players, if it comes at the expense of physiological specificity or strategic principles, we may well be wasting our time.
As Yogi Berra once said: “If you don’t know where you are going, you may never get there.” And that is exactly the pitfall of programming conditioning games. Taking players to exhaustion by means of a fun and engaging activity sounds like a great deal—we get tons of running volume, sprinting, jumping, and sports-specific additional mechanical demand such as collision if we want to. Through the rules, space, and duration utilized, we can get anything we desire in term of physical output. Instead of facing players looking sadly at their feet, waiting anxiously in line for the whistle to be blown during a traditional MAS running block, we can get them happy and fully engaged by disguising the fitness work in a game.
The GPS reports are flattering, the technical coaches are involved, the players are cheerful… conditioning games can quickly become like a drug for the S&C. But the moment we realize, as performance practitioners, that we are designing our conditioning drill to be as entertaining as possible, we need to pull ourselves out of the circus we created and go back to the drawing board.
I remember once visiting a rugby team training. From the sideline, I watched—stunned—as the players suffered through a conditioning game that screamed torture, while listening incredulously to their strength and conditioning coach’s explanation. His aim was to increase the lactic capacity of his players because analysis of the game revealed that most ball in play sequences lasted 30 to 45 seconds. Forcing his troops to go all out for 30-second bouts with 30 seconds of rest in between, by the fifth bout the GPS data may well have been through the roof, but the drill stopped targeting the lactic system. The poor players were doing aerobic work, unable to change gears anymore, while trying their best to make it look “high intensity.”
Some kind of model or guideline seems like it should absolutely be required when it comes to conditioning games, because it is so easy to get carried away and get it wrong. First of all, even the basics of conditioning programming—volume, intensity, and work:rest ratio—can quickly become a nightmare to plan and result in unsatisfactory compromises, especially when technical coaches get involved. You may, for instance, have all agreed that the aim of the conditioning game is to stress the aerobic system. Everything is going according to plan: the effort bout’s duration, the intensity, the work:rest ratio are all in their optimal range. Then, suddenly, the head coach—vexed by the number of technical errors—decides to punish the players by moving from touch to full contact (raising the involvement of the anaerobic system considerably) or to deliver a lengthy rant, blowing away the work:rest ratio.
Involving technical coaches in conditioning games is a fantastic way to ensure that the game isn’t just a way to make conditioning work more pleasurable for the players, but a real learning experience that will contribute to improved performance in the technical area too. However, before doing so, it is absolutely necessary to work with them on developing a common language and understanding surrounding the boundaries defining each type of game.
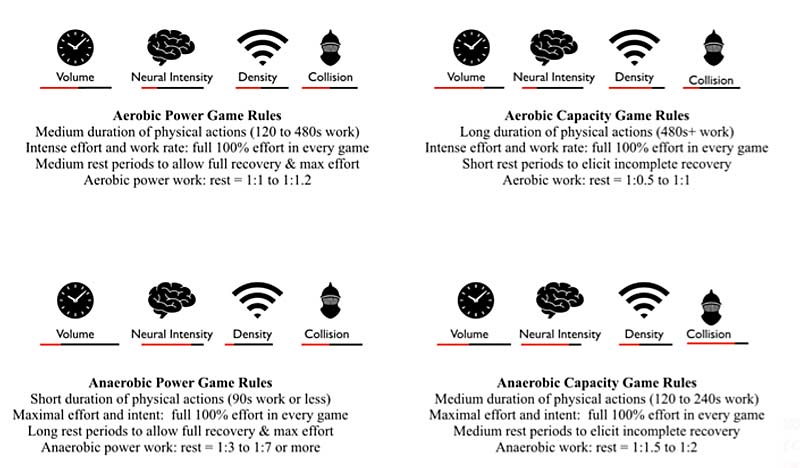
A first option is to categorize conditioning games according to the energy system targeted. The duration of the physical bouts and the intensity required, as well as the work:rest ratio and the nature of the recovery, are specified, and all staff members involved during the conditioning game are responsible for enforcing those parameters. The central nervous system (CNS) involvement—especially through explosive actions such as jumping or accelerating/decelerating and changing direction—and the number of impacts or collisions complete the list of agreed-upon defining parameters due to the effect of those on energy system pathways.
Indeed, for a conditioning game to be classified as an aerobic capacity one, not only should the duration of each physical bout exceed eight minutes and the work:rest ratio be maintained below 1:1, but the CNS involvement and number of collisions need to be kept very low. Too many explosive changes of direction and physical duels would increase the anaerobic contribution to the overall energy production, swiftly shifting the game toward a more lactic dominant activity.
If such a model surely provides some basis to a more efficient and smoother conditioning games programming, it is still far from exhaustive. There is much more to a conditioning game than just a physiological stimulus.
Running and jumping load are not enough to clearly picture the actual energy demand of a conditioning game, nor the amount of fatigue it creates. In addition to the physical load, coaches need to add the cognitive and emotional loads.
To clearly picture the actual energy demand of a conditioning game and the amount of fatigue it creates, coaches need to add the cognitive & emotional loads in addition to the physical one. Share on XThe brain consumes more energy at rest than any other part of the human body, and it is a safe assumption that increasing the cognitive workload during a conditioning game will compound the resulting level of fatigue and energy spent. Factors weighing in on the cognitive load of a conditioning game are:
- The density and volume of decision-making.
- The number of technical gestures involved, as well as the quality and precision required in their execution to meet the task demand.
- The level of expectation asserted by coaches standing by.
- The complexity of the strategic plan and the extent of cooperative efforts needed to achieve them.
Emotions are known to be able to change physiology. A player feeling anxious or stressed will undoubtedly undergo a rise in their cortisol level, impacting their ability to adapt and recover efficiently, as well as a rise of catecholamines directly impairing their ability to take on new information, learn, and remember. If it is sadness, disappointment or regret that is swallowing the poor individual, then a dopaminergic crisis follows and increases their chances of feeling pain, of contracting a non-contact injury, or of maladaptation to the training load. On the other side, excitement, happiness, or alertness contributes to an optimized adaptation to the physical stimulus as well as learning abilities.
It is important to be aware and to understand that a game designed to target the aerobic capacity system will have a completely different impact on the player’s physiology, fatigue, and adaptation if it includes technical gestures or tactical plans looked over by a head coach in a bad mood—yelling and threatening at every mistakes—or if it is a relaxed and fun activity without any other aim than getting them to run a certain volume without complaining or looking bored.
Physical, cognitive, and emotional loads all contribute to the stimulus a conditioning game delivers to its participants. There is no magic formula, nor any right or wrong—the ability to manipulate those three variables in order to obtain a certain kind of adaptation are at the center of the art of planning conditioning games.
Moreover, we tend to consider conditioning games as exclusively a means to get a particular physiological stimulus, but if we look at it in a more holistic way, we quickly realize that for technical coaches, conditioning games can be used as learning experiences reinforcing some critical technical skills and tactical principles, or for developing more general cognitive abilities.
Conditioning games are a powerful training drill able to stress multiple important qualities required to achieve high performance. To grasp the full scope of potential benefits of conditioning games, beyond just energy system development, as well as to provide some guidelines on how to better plan them, it is necessary to come up with a model. Here comes the quadratic model.
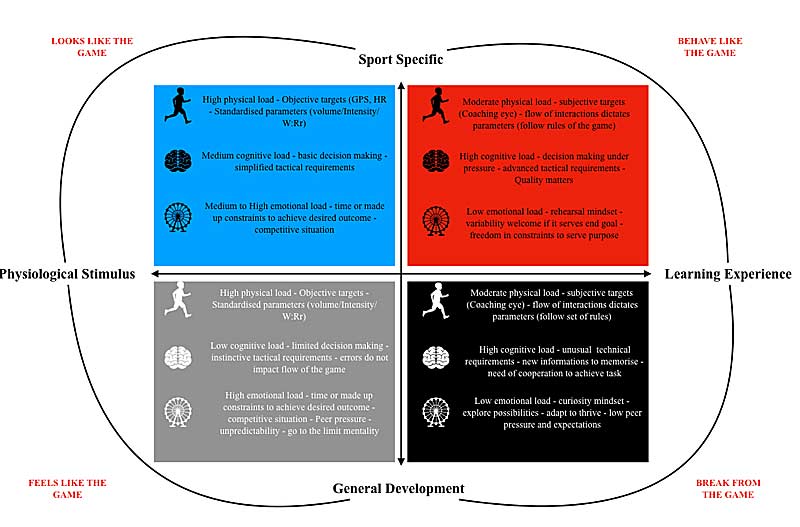
The Quadratic Model
The quadratic model classifies conditioning games according to their position on two continuums. The first continuum addresses the main goal of the activity, opposing straightforward physiological stimulus (the purpose of the game is just to be less boring than a traditional running drill) and learning experience (the purpose of the game is to improve the team’s technical and tactical knowledge and mastery).
The second continuum is the one of specificity, from sport specific (the game played is designed to involve technical and tactical components of the sport) to general development (the game played involves technical and tactical components that best serve the development of a particular ability or quality, irrespective of their origin).
Such a proposed modeling allows the inclusion of three different types of loads and combines them to optimally serve the purposes of the planned conditioning game.
Each quadrant comes with a set of principles that the practitioner can use as general guidelines.
Quadrant A: Sport-Specific Physiological Stimulus
Games in this quadrant have as a main objective to stress a particular energy system while reinforcing technical (and to a lesser degree tactical) proficiency by incorporating a similar ball, rules, and scoring opportunities as the actual sport. To ensure this objective can be achieved, three principles ought to be observed.
The 80-20 Rule
Eighty percent of the game should be identical to the sport played. This means that amongst the five main design components, four should be consistent with a match situation:
- Duration of activity and rest.
- Size of pitch.
- Number of players.
- Game rules.
- Intensity of actions.
The remaining 20% are subjected to regulation in order to emphasize the desired energy pathway and musculoskeletal stimulus. Examples of regulation are:
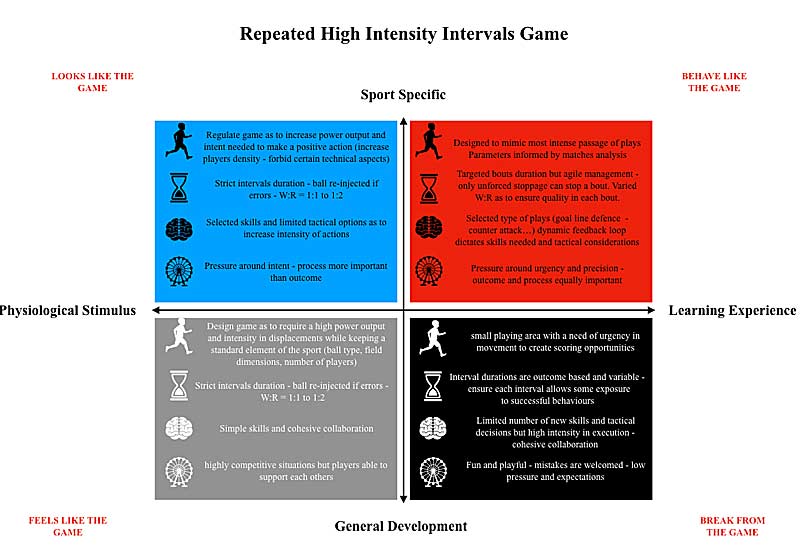
- Small-sided games: to target aerobic power and anaerobic capacity through an increase in acceleration/ decelerations, sprints and change of direction, as well as increased density of displacement (work/rate).
- Bigger field games: to target aerobic capacity and speed endurance through an increase in distance covered at medium, high, and very high intensities.
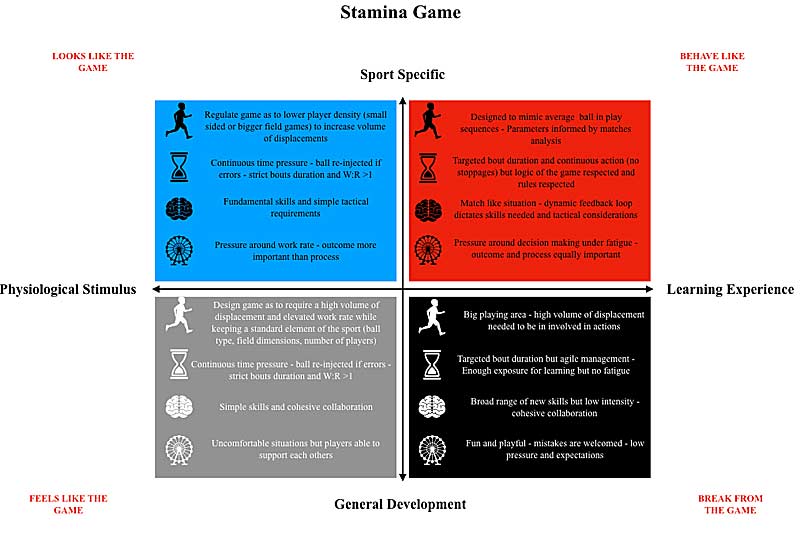
- Pre-set sequences of play: to target the lactic system and overall stamina by repeating passages of play for a standard duration with a stable work:rest ratio.
- Rule modifications: aimed at encouraging or removing a particular behavior in order to better induce a certain physiological stimulus (no contact, set pieces replaced with live ball injection, can only score after a certain number of passes, etc.)
Objective Assessment:
The game is designed to meet objective, quantifiable, and measured targets, as recorded by a GPS tracker or heart rate monitor. At any time during the game, the type of regulation can be modified to ensure those targets are met, as they are reflective of the physiological stimulus imposed. Game duration and intensity can be altered to continue fitting the pre-set objective goals of the drill, no matter if the scoring requirements of the proposed game have been met or not.
Redundancy:
Technical gestures and tactical cooperation needed to play the game are kept basic and well known. As cognitive and physical demands compete for the players’ resources, the burden placed on the brain is eased by requiring only a skill set that the individuals are very comfortable with. Novelty is avoided here whenever possible, and the same games are played over and over again, thereby inducing low levels of stress, anxiety, and learning in order to allow physiology to be the limiting factor.
Quadrant B: Sport-Specific Learning Experience
Games in this quadrant have as their main objective improving tactical and technical performance to positively impact the next match result. To ensure this objective can be achieved, three principles ought to be observed.
Dynamic Feedback:
Games in this quadrant do not include any sorts of regulations that go against the normal flow of the sport practiced. Unlike those of the three other quadrants, games designed to be a sport-specific learning experience sanction or reward behaviors that are exactly what would occur during a match. For instance, during a conditioning game of quadrant A, a player making a line break and providing a scoring opportunity can be stopped before the end of their action and the ball can be given to the opposition in another area of the field in order to force a rapid reorganization and increase the work rate.
Such a negative consequence of a very positive action for a player and his team is comprehensible when a physiological stimulus is targeted, but it is completely against the logic of the sport. Therefore, when the goal is to create a learning experience, positive actions need to be rewarded with positive outcomes and negative ones sanctioned by tur-overs and loss of territory.
Games in this quadrant leave the actions and decisions of both teams to dictate the rhythm and outcome of plays, using unplanned stoppages (errors, scoring) to reset and debrief with little regulation other than referring according to the rules of the sport.
Subjective Assessment:
Here, sport science technologies are run in the background as the coaching eyes prevail. The ultimate goal of a learning experience is to acquire knowledge and reinforce proficiency in a particular domain. Therefore, to tell when the actions of the players demonstrate a successful learning experience is up to the technical staff. The number of repetitions and the volume, intensity, and work:rest ratio of such games show the optimal acquisition of the tactical and technical principles the team is working on. The physiological stimulus obtained may therefore be different from one practice to another, and it is the responsibility of the physical performance staff to have options planned around the game itself to compensate for an above or below expectations physiological stimulus.
Differentiation:
A sport-specific learning experience game differs from other tactical and technical drills by targeting learning through differentiation. Games in this quadrant should offer the players a situation in which no two repetitions are the same. Indeed, a sport-specific learning experience game should not be a process of repeating a solution (rehearsal) but a process of finding and adapting a solution (discovery). Learning is obtained through “repetitions without repetition,” where players mostly implicitly gain understanding and mastery of a tactical or technical aspect of the sport by differentiating between successful solutions and less prolific ones. Since strong negative emotions can shut down learning and memory, it is important to create a situation where players feel safe and encouraged to be creative and explore solutions without fear of being criticized and judged.
A sport-specific learning experience game should not be a process of repeating a solution (rehearsal) but a process of finding and adapting a solution (discovery). Share on XQuadrant C: Physiological Stimulus Aimed at General Development
Games in this quadrant have the objective of delivering a strong physiological stimulus with an emphasis on a specific energetic system, while keeping players engaged and motivated through the use of a collective task requiring collaboration rather than traditional conditioning drills. To ensure this objective can be achieved, three principles ought to be observed.
The 80-20 Rule (reversed):
Flipping the 80-20 principle observed in quadrant A, this time, 80% of the game is subjected to regulations that aim at targeting the desired physiological stimulus (see examples of regulations in the quadrant A section), and only 20% is kept specific to the sport. Trying to obtain a strong physiological stimulus by playing a game that is completely foreign to the players or less than 20% specific poses the problem of a higher cognitive demand (new skill set to learn and acquire) competing with the physical demand for limited resources. In order to maximally focus on the physiological stimulus, you better keep the cognitive demand low.
Objective Assessment:
(As discussed in quadrant A.)
Cohesion:
Targeting a physiological stimulus through a non-sport-specific game is subject to more variability and fewer precise and individualized outcomes than traditional conditioning drills. To justify choosing a less optimal mean to achieve a physiological goal such as the development of an energy system, “making the players happy and more motivated” isn’t enough. Games in this quadrant should be designed to enhance cohesion through situations requiring groups of players to collaborate, work for one another, and support each other. Non-specific conditioning games are generally planned during the pre-season—coupling energy system development with team bonding seems an interesting prospect.
Quadrant D: Learning Experience Aimed at General Development
Games in this quadrant have as a main objective to improve general cognitive abilities such as vision, problem-solving, reaction time, dexterity, or tactical sense. To ensure this objective can be achieved, three principles ought to be observed.
Transfer:
Despite not being present as such in the sport played, the situations created and the skills required to answer them require players to find cognitive and motor solutions that are transferrable to their actual needs. For instance, a game played in a much larger field than the one used for their sport can improve football players’ peripheral vision. Since peripheral vision is a critical aspect of football performance, the learning experience created through the means of a non-specific game requiring a larger field (such as Aussie rules) has a transferrable solution to the sport of football. Another example would be catching a smaller and faster ball, therefore improving the dexterity of the players’ hands—this is meaningful and transferrable to a rugby player or a goalkeeper.
Downregulation:
The use of a conditioning game to target the development of a general cognitive ability should be aimed at continuing to improve performances while giving the player a break from the fast-paced, cutthroat, and repetitive day-to-day practices. Taking a step back—both away from the sport and toward an activity that has no intent to overly stress the body or directly improve the team tactical or technical mastery—can considerably lower the pressure gauge. When faced with a congested competitive schedule or environmentally and emotionally draining situations (such as travel crossing multiple time zones or a rivalry series), games in this quadrant can offer an opportunity to continue to create meaningful learning experiences while avoiding more stress and strain on the players.
Cohesion:
This is shared with quadrant C. If a game is the vehicle chosen to deliver a learning experience aimed at general development instead of individual skill work, it should be because of the cohesion aspect it brings. A tennis-volley game is superior to a kick-to-target drill to enhance general kicking accuracy for a football player because of the communication, collaboration, and shared emotions it creates amongst the participants in each team.
If a game is used to deliver a learning experience aimed at general development instead of individual skill work, it should be because of the cohesion aspect it brings. Share on XBringing It Together
All fundamental goals of a conditioning program for team sports—to meet the demand of the game, to prepare for the worst, and to build resilience—can be achieved through the proper planning and design of conditioning games.
To accomplish this, practitioners need to look beyond the style of conditioning drill a game has to fit according to the physical performance program needs. Instead, they need to work with technical coaches to decide where on the specificity and learning experience continuums the activity should be placed to optimally fit the overall plan.
Since you’re here…
…we have a small favor to ask. More people are reading SimpliFaster than ever, and each week we bring you compelling content from coaches, sport scientists, and physiotherapists who are devoted to building better athletes. Please take a moment to share the articles on social media, engage the authors with questions and comments below, and link to articles when appropriate if you have a blog or participate on forums of related topics. — SF


 Kim Goss has a master’s degree in human movement and is a volunteer assistant track coach at Brown University. He is a former strength coach for the U.S. Air Force Academy and was an editor at Runner’s World Publications. Along with Paul Gagné, Goss is the co-author of Get Stronger, Not Bigger! This book examines the use of relative and elastic strength training methods to develop physical superiority for women. It is available through Amazon.com.