Anyone who has worked with athletes has observed how rare it is for them to get identical results from the exact same routine. Although trends may be similar within a group, there are inevitably some athletes who produce better results while others are stagnant or regress. Using the latest technological advancements in sport and exercise science gives us some insight into the variation from individual to individual in order to either capitalize on their strengths or try and improve areas that are holding them back.
Metabolic testing, such as expired gas analysis and blood lactate levels, helps to determine whole body energy demands—particularly for aerobic and anaerobic lactate events. Appropriately matched external performance measures, such as power, force, and speed assessments, are excellent for monitoring individual response from a training routine, validating a successful training phase, or monitoring recovery. Neuromuscular assessment by surface EMG (electromyography) helps to connect the dots between the neural response and the performance outcome during a training environment or competition.
This—EMG—is a key factor that I considered one of the missing links for finding appropriate individual exercise prescription.
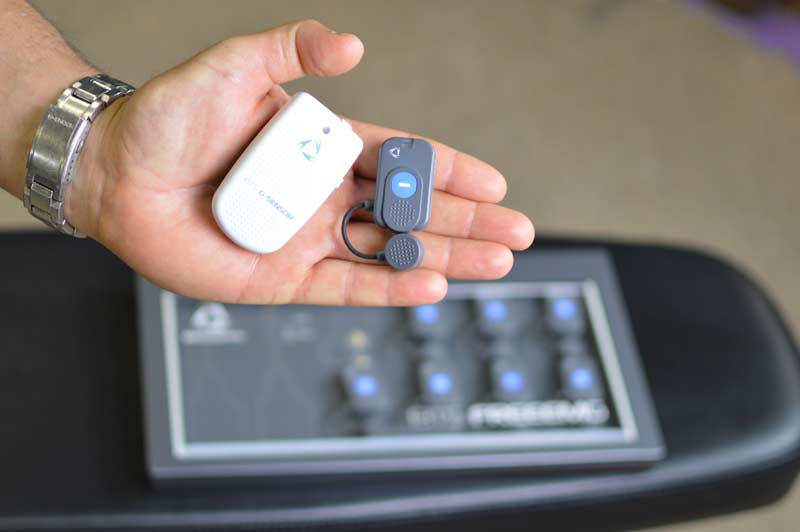
(Bipolar surface) EMG is a key factor that I considered one of the missing links for finding appropriate individual exercise prescription. Share on XWith this goal in mind, finding the most appropriate system for my needs was no easy task. In the end, I invested in a wireless 8 EMG sensor system and inertial sensor (G-Sensor 2) from BTS Bioengineering. I chose BTS Bioengineering because:
- They have been in the business of motion analysis for more than 25 years.
- Their sensors have been validated and used in peer-reviewed scientific research.
- The products have been used in a variety of medical, sport, and aerospace applications.
Although EMG has been very well researched over the decades (a quick Google Scholar search returns 27,600 articles for 2020 alone), and the technology and interpretation continue to be developed, I have found it is not as commonly applied as an assessment tool in a sport and fitness setting.
To keep it simple for the purpose of this article, I am referring to bipolar surface EMG and not fine wire or multiple-array EMG. Measuring and monitoring the EMG signal tells you several different characteristics of how the muscle is responding, including when the muscle is active (on or off), how much the muscle is active, and how the muscle’s activity is responding to movement and applied force. From these findings, you can extrapolate additional information, such as how that muscle behaves in relation to other muscles and whether or not the muscle is fatiguing.
My interest has always been in the field of muscle strength and hypertrophy, so the ability to finally “see” how a specific muscle responded to a stimulus was exciting.
Muscle Activation: Differences Between Individuals for the Same Exercise
The EMG signal is a measurement of the combined action potentials of the motor units immediately underneath the electrodes and to a certain depth within the muscle. This signal is a combination of the number of motor units, the size of the motor units, the firing rate (or rate coding), motor unit cycling in conditions such as fatigue, and to a certain extent the synchrony to which these motor units fire together.
The last factor is generally believed to not necessarily have a large impact on the signal in most submaximal contractions at moderate speeds. As the Henneman size principle on motor unit recruitment states that motor units recruit from smallest to largest, in the very simplest sense a larger EMG signal is believed to generally be caused by increased motor unit recruitment of progressively larger motor units up to around 80% to 85% of MVC in most muscles. However, all muscles do not behave exactly the same, and a motor unit that is further away from the electrode will give a smaller signal than the actual signal produced, along with changes in firing rate and synchrony that all can ultimately affect the measured signal.

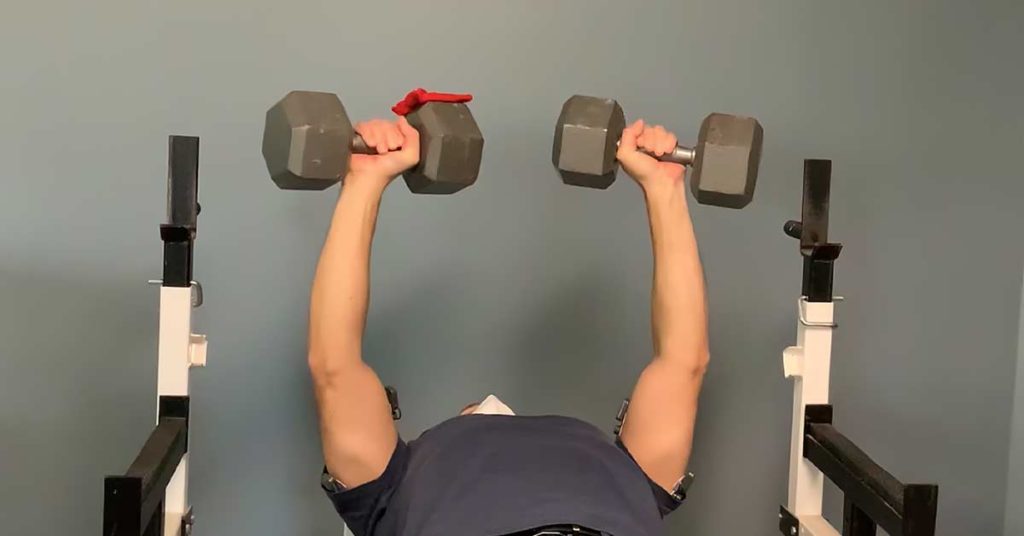
To put it to the test, I examined a former bodybuilder, a current competitive powerlifter, and a recreational lifter on the flat dumbbell press. The latter I had worked with in the past—he had always struggled with chest development and pressing strength.
When comparing three different subjects with three different training histories, one might expect unique recruitment patterns throughout the exercise. The question is, could measuring these unique recruitment patterns bring to light areas where their technique could improve to maximize the effect of the exercise? The hypothesis is that by examining our recreational lifter’s muscle activation pattern against athletes who have had successful results in both strength and hypertrophy, we might gain more insight to help explain his consistent lack of results in this area. Although having athletes to compare results to is definitely a benefit, it is not always required. If the goal is to improve chest development, it would be desirable to see a pattern of higher activation throughout the full range of movement in the pectoralis major.
The setup for this investigation was as follows:
- Four FREEEMG sensors on each side for the pectorals major (sternal portion), anterior deltoid, biceps brachii, and triceps brachii (long head).
- Electrode locations were by established guidelines (SENIAM and Cram’s Introduction to Surface Anatomy, 2nd Ed.)
- The G-Sensor was attached to one of the dumbbells on the dominant side.
Data was collected using EMGAnalyzer software and analyzed with a custom developed protocol with SEMGAnalyzer software, both of which were included with the system. To be able to compare and examine the activation patterns, the EMG signal of the first five repetitions was normalized to the dynamic peak EMG signal (converted into a ratio where the EMG signal is divided by the highest EMG signal during the set of five repetitions) during the exercise. Although, it may have been desirable to compare to an MVC, the issue with collecting several valid MVC for all muscles is that it requires a fair amount of setup and was not possible due to time constraints.

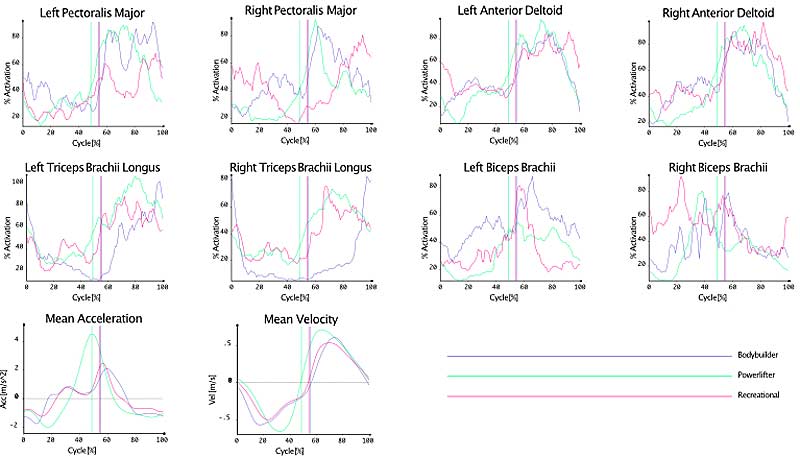
On first glance, the graphs in figure 1 potentially reveal a few insights as to how the nervous system activates the muscles during the movement. Since the graphs are normalized as a percentage of the mean peak activation during the movement, you can see the distinct differences in activation pattern between the three different lifters. In the recreational lifter, mean peak chest activation of approximately 75% occurs on the right side at the end of the movement on lockout versus earlier in the concentric portion with mean peak values closer to 90% for the more experienced lifters.
Although the left side chest activation patterns are closer in similarity between the three, mean peak activation still lags in the fitness enthusiast. Deltoid activity looks similar between the three lifters, but triceps activation has a lower activation level for the bodybuilder compared to both the powerlifter and the enthusiast at the start and mid-point of the concentric portion.
Acceleration and velocity kinematics were collected by the G-Sensor attached to one of the dumbbells on the dominant side. This was necessary in order to determine the lowering phase (eccentric contractions) and the lifting phase (concentric contractions) of the dumbbell during the lift. The ability to collect three-dimensional acceleration, along with orientation angles, can also provide information on the forces applied to the dumbbell.
Remember Newton’s second law of motion that Force = Mass x Acceleration? Since our dumbbell weight doesn’t change for the individual, we can get an idea of the forces acting on the dumbbell caused by the muscles through the acceleration data. We can see the powerlifter moved the dumbbell faster and with a nice, smooth acceleration (and therefore force) curve, versus the wavy graph produced by the others.
So, what does all this mean?
Initially, it appears that the recreational lifter could have less optimal chest activation compared to the others, the bodybuilder potentially has the greatest activation of the chest muscles, and the powerlifter is hitting the “Goldilocks zone” of similar peak activation across all three muscles. Remember, the graphs are the mean values normalized to the peak EMG value obtained during first five repetitions. Values close to 100% in the cycle would suggest consistent activation close to the dynamic peak.
The reverse of this is also true, with a lower percentage representing a consistently lower activation compared to the dynamic peak. Although the biceps brachii does cross the shoulder joint, in this case it is believed to act more like a stabilizer than a strong contributor to the movement. Calculating the mean of both the concentric and eccentric phases is another way to quantify this difference; however, as you can see, during a dynamic contraction the activation changes throughout the movement and a mean value may not tell the whole story.
As in most test situations, more questions are inspired and therefore more testing!

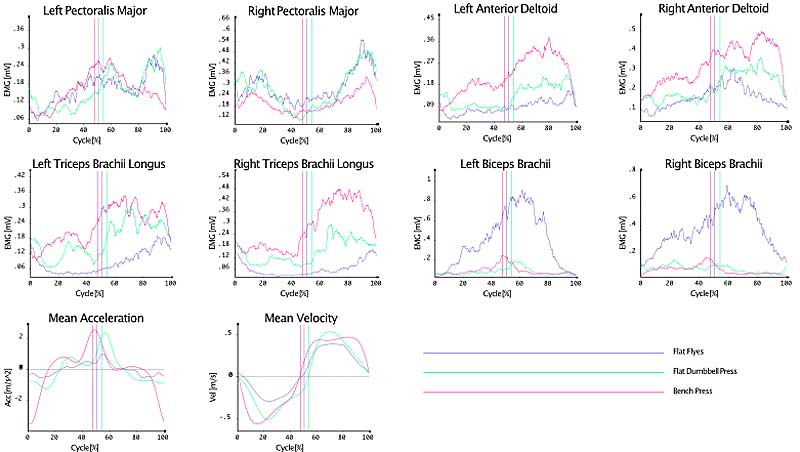
These graphs represent a comparison of three different exercises performed by our fitness subject (flat flys, flat dumbbell press, bench press). In this case, since we are comparing the same muscles in the same individual on the same day without removing the electrodes, with a minimum of five minutes’ rest between submaximal exercises, there is no need to normalize. The readings are the actual voltages in mV read by the FREEEMG sensors.
Interestingly, the same activation in the right pec muscle persists, although left and right activation levels were similar for both flat dumbbell press and flat flys, with the bench press showing a very different pattern between left and right. Another interesting observation is the high activation of the biceps muscle during the fly movement. Although calculating individual forces on muscles within a movement is challenging, to say the least, could we make an argument that the fly exercise could also be considered a bicep exercise due to its biarticular function here?
While the common perception that shifting to dumbbell work results in a more equal left-to-right-side balance, in this case the activation pattern of a U-shaped curve on the right and A-shaped curve on the left persists through both exercises. Could this be a learned neural strategy? A past injury? A technique issue? Could there be an anatomical difference in structure? All are possibly valid theories that would require working with the client to establish a solution to help get them the results they want.
Also, it is important to remember that a greater amplitude does not necessarily mean a stronger muscle. Initially, this may seem counterintuitive, as we are used to seeing increasing graphs resulting in increased strength. In very general terms, an increasing EMG amplitude will often be related to an increase in force in that same muscle. This relationship is not necessarily linear and can be more of a curvilinear relationship in different muscles.
It is important to remember that a greater amplitude does not necessarily mean a stronger muscle. I find it better to think of the EMG amplitude as how hard the muscle is working. Share on XInstead, I find it better to think of the EMG amplitude as how hard the muscle is working. For example, assuming electrode application is correct and the conditions for signal strength are similar, if the left biceps curls a submaximal weight of 20 pounds and results in an amplitude of 1 mV and the right biceps lifts the same weight but results in a reading of 1.3 mV, you might automatically think the right biceps is stronger. However, if both biceps have a maximum activation level of 1.5 mV during a maximal voluntary contraction, the right biceps is working at 86% activation whereas the left biceps is working at only 67%. In this case, the left is more likely stronger (can produce more force with less activation) than the right and illustrates the importance of normalization of the signals to an associated effort.
Future technique strategies to help our recreational lifter could focus on engaging the right pectoralis muscles at the initiation of the concentric movement by altering arm angle while trying to deactivate synergist muscles such as the anterior deltoid in combination with drawing a stronger mental connection to the muscle’s contribution to the movement. Although the biceps brachii is not particularly active in either press movement, it is significantly higher in the fly movement—most likely as a result of the muscle being placed in a stronger position with the arm extended at the elbow.
If our fitness enthusiast wants to prioritize chest development, bench press may not be the best choice in the short term based on this assessment. This last statement can be a controversial one, as increased EMG activation has not been proven to result in greater hypertrophy. However, at times you have to make a decision based on the best information you have, and I feel that EMG analysis can be a valuable tool to help make those decisions.
The one caveat I am consistently reminded of that is generally true for all assessments, but especially for EMG data collection, is to make sure you have good “clean” data. Skin preparation, electrode choice, exact placement on the targeted muscle, muscle cross talk on small muscles, and the amount of fat tissue between the skin and the muscle can all affect the quality of the signal. It may take more time to do it properly, but you will be confident in your data and subsequently your analysis.
Data-Based Exercise Prescription
Assessing muscle activation by EMG and inertial monitoring provides additional information as to how the muscle works under different exercise and training conditions. With this type of evaluation, we can check to make sure the muscle is responding as desired throughout the range of motion. This removes common assumptions and generalizations we may rely on to guide our exercise prescription.
Assessing muscle activation by EMG and inertial monitoring helps remove common assumptions and generalizations we may rely on to guide our exercise prescription. Share on XAlthough peer-reviewed scientific articles provide excellent information on muscle activation for a wide variety of commonly used training techniques, as we have just seen, there is also an individual response that should be considered, especially when results have not achieved the desired level. Presenting this information in a graphical form is a powerful way to communicate this to both the athlete and the coach to help change established mindsets as to what exercise is “best” and to consider other approaches to the problem.
As you could see from the graphs, our fitness enthusiast would most likely benefit initially from a closer look at his technique to help increase activation and symmetry in the pectoralis muscle, as even different exercises continued to show a similar recruitment pattern. Although investigating additional chest exercises may result in the discovery of a more ideal activation pattern, the fact remains he would most likely benefit from changing his biomechanics to more favorably load the chest muscle among the three tested exercises.
Technique modifications such as a greater range of motion, changes in acceleration, a greater upper arm abduction angle in relation to the torso, and a change in pronation of the hand, combined with a stronger mental connection to the targeted muscle, could all have an effect on the activation pattern of the agonist and synergist muscle groups and presumably his results. The lifter should be retested (combined with video analysis) in the same initial conditions along with detailed notes taken as to what technique changes occurred. The addition of video during a test has been particularly helpful to me in understanding the context of the notes after the fact.
If the goal is more performance oriented, combining EMG data with kinematic data obtained from an inertial monitor during the performance of an actual skill can help ensure specificity of training by matching the prescribed exercises to the actual movement activation patterns. Does the chosen exercise during training actually mimic the activation patterns needed to perform the skill? As we have seen, the results can sometimes be both surprising and enlightening. Effective muscle hypertrophy, strength, or rehabilitation training can be more efficiently matched to the correct exercise for that individual’s muscle activation patterns, thereby narrowing the varied training response.
In my own application of these techniques, changes in acceleration cause noticeable changes in activation level combined with relatively small changes in body position. Trying to establish a stronger mental connection to increase activation seems to be more effective in those who have less training experience than experienced athletes. However, the mental connection becomes more useful in this latter group in helping them deactivate or relax certain muscles involved in the movement to help improve movement efficiency or to emphasize other muscle groups.
As someone who has worked with a wide variety of clients for more than 25 years, it can be difficult to assess all angles and movement patterns at once without possibly overlooking something. Having the data laid out for me in an easy-to-read format makes it easier to address what could be improved and can help unlock unseen issues I may have never even considered that may give an athlete an edge against their competition.
Having the data laid out for me in an easy-to-read format makes it easier to address what could be improved and can help unlock unseen issues I may have never even considered. Share on XThis last point I have encountered many times. There is something very gratifying and humbling when what you thought was occurring wasn’t actually occurring—and, in fact, something else was going on that never even crossed your mind. You really don’t know what you don’t know…until you know you don’t know it. EMG, when done properly and judiciously, can provide that next level of information for clients to help make well-informed decisions for individual exercise prescription.
Since you’re here…
…we have a small favor to ask. More people are reading SimpliFaster than ever, and each week we bring you compelling content from coaches, sport scientists, and physiotherapists who are devoted to building better athletes. Please take a moment to share the articles on social media, engage the authors with questions and comments below, and link to articles when appropriate if you have a blog or participate on forums of related topics. — SF

