Heart rate variability (HRV) monitoring has become increasingly popular in both competitive and recreational sports and training environments due to the development of smartphone apps and other affordable field tools. Though the concept of HRV is relatively simple, its interpretation can be quite complex. As a result, considerable confusion surrounds HRV data interpretation. I believe much of this confusion can be attributed to the overly simplistic guidelines that have been promoted for the casual-end, non-expert user.
In the context of monitoring fatigue or training status in athletes, a common belief is that high HRV is good and low HRV is bad. Or, in terms of observing the overall trend, increasing HRV trends are good, indicative of positive adaptation or increases in fitness. Decreasing trends are bad, indicative of fatigue accumulation or “overtraining” and performance decrements. In this article I address the common notions of both acute and longitudinal trend interpretation, and discuss why and when these interpretations may or may not be appropriate. We will briefly explore where these common interpretations or “rules” have come from within the literature, and then discuss some exceptions to these rules.
This article will mostly focus on the log-transformed root mean square of successive R-R interval differences (lnRMSSD), which is the vagal-HRV index used in popular smartphone apps. For several important reasons lnRMSSD appears to be the preferred HRV parameter for athlete monitoring.
- It can be easily calculated without specialized software
- It is reflective of cardiac-parasympathetic modulation
- It demonstrates greater reliability compared to spectral measures (e.g., HF power)
- It can be assessed in only 60 seconds
- It is less influenced by breathing rate, making it more suitable for field usage
Why a high HRV score is thought to be good and a low HRV score is thought to be bad
HRV-guided endurance training has been shown to be superior to pre-planned endurance training in healthy1,2 and clinical subjects3 for inducing improvements in aerobic fitness variables. Essentially, training with higher intensity/volume when HRV is at or above baseline appears to elicit greater training adaptations. This results in high (or within baseline) HRV being synonymous with “readiness.”
Acute decreases in HRV have been reported to occur following intense endurance training,4 resistance training,5 and competition.6 Therefore, low HRV is commonly thought to provide a reflection of acute fatigue from training or competing.
Where these interpretations can be misleading
Decreased HRV has been observed in a variety of athletes preceding competition as a result of heightened levels of excitement or anxiety.6,7 Further, lower vagal-HRV has been reported to be favorable in sprinters on the day of a race.8
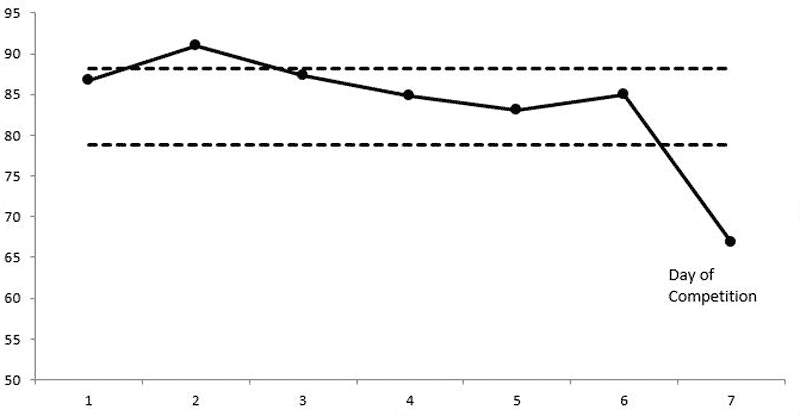
A low HRV score as a result of fatigue also does not necessarily forecast impending reductions in performance. A small case study of 3 high-level tennis players showed that performance markers (VO2 max, single-legged counter-movement jump, and drop jump index) improved following a 30-day overreaching period. The athletes expressed their improved performance at the end of the training program despite showing decreases in RMSSD (between -13 and -49%).9
This was also evident in a recent study of ours with a collegiate female soccer team10 that assessed changes in HRV (weekly mean and weekly coefficient of variation [CV, a reflection of the day-to-day fluctuation in HRV scores]) and perceived wellness in response to weeks of varying training load. During a high-load training week, wellness scores and the HRV weekly mean were lower, and the HRV coefficient of variation was higher. All these changes indicate a higher presence of fatigue.
Having devised and implemented the training program, I interacted with and observed the athletes in terms of behavior, body language, etc. They were definitely experiencing fatigue. However, they all completed workouts of higher volume and intensity in both the weight room and during conditioning sessions. This indicates that they were still able to demonstrate their strength and fitness qualities despite fatigue.
Therefore, in the presence of fatigue reflected by HRV, performance may or may not suffer. HRV will typically show changes before performance decrements and thus may serve as an early warning sign of fatigue accumulation. But do not expect your or your athletes’ performance to be poor based on a low HRV score, as this certainly is not always the case.
Why an increasing trend is thought to always be a good thing
Increases in aerobic fitness have often been associated with increases in cardiac-parasympathetic activity in a variety of individual and team sport athletes. A common observation is that those who improve fitness also improve HRV, while those who do not improve fitness show either no change or even decreases. For example, a study by Buchheit and colleagues11 demonstrated that subjects who improved their 10K run time following a training program also showed a progressive increase in their HRV, while non-responders showed no meaningful changes. Large correlations between changes in HRV and maximum aerobic speed and 10K time trials were found.
A recent study of ours currently in press12 evaluated how early changes in HRV relate to eventual changes in intermittent running capacity in team-sport athletes. We found that athletes who demonstrated an increase in their HRV weekly mean and/or a decrease in their weekly HRV CV at the halfway point of a 5-week training program improved performance to a greater extent than those showing the opposite HRV changes. In light of studies like these, interpretation of an increasing HRV trend as being a positive response to training has become popular.
Why interpreting an increasing HRV trend as always a good thing can be misleading
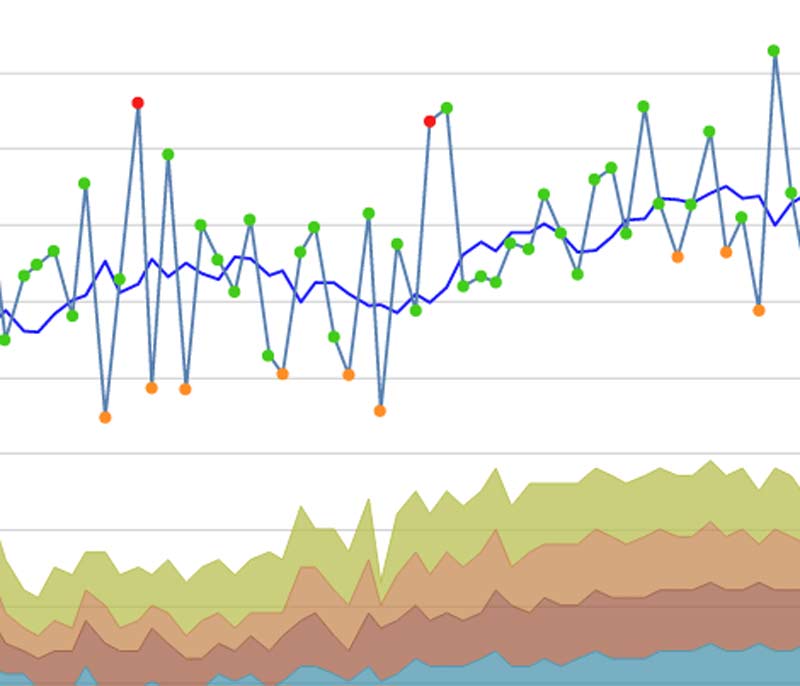
Unfortunately, an increasing HRV trend throughout training is not always a good thing and thus should not always be interpreted as such. In fact, several studies have reported increasing HRV trends in overtrained athletes predominately involved in endurance sports. For example, Le Meurr et al.13 showed decreased maximal incremental exercise performance and increased weekly HRV mean values in elite endurance athletes following a 3-week overload period, compared to a control group who saw no changes. Following a taper, performance supercompensation was observed along with a return of HRV toward baseline.
Why a decreasing trend is always thought to be a bad thing
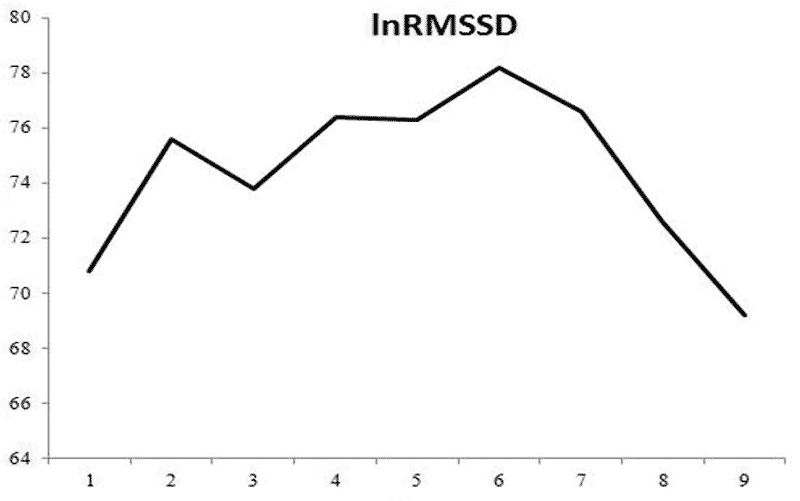
The most common response to overload training is a progressive decrease in HRV. This is your typical alarm response to a stressor, where the sympathetic arm of the autonomic nervous system is activated. In this situation, resting HR is elevated and HRV decreases. With insufficient recovery time, HRV may not fully recover to baseline before the next training stimulus and thus will result in a downward trend when this cycle is perpetuated. An intense day of training can result in suppressed HRV for up to 72 hours post-exercise.14 With the higher training frequencies and training volumes often associated with overload periods, it makes sense that HRV will show a decreasing trend. Typically, HRV will respond first with a decreasing trend and performance decrements will follow if the overload period is sustained.
A study by Pichot et al.15 provides a good example of a decreasing HRV trend in response to overload training. They showed that middle distance runners saw a progressive downward HRV trend (up to -43%) during a 3-week overload period. In week 4, training loads were reduced and HRV recovered and exceeded baseline values.
Why and when a decreasing HRV trend does not necessarily reflect fatigue
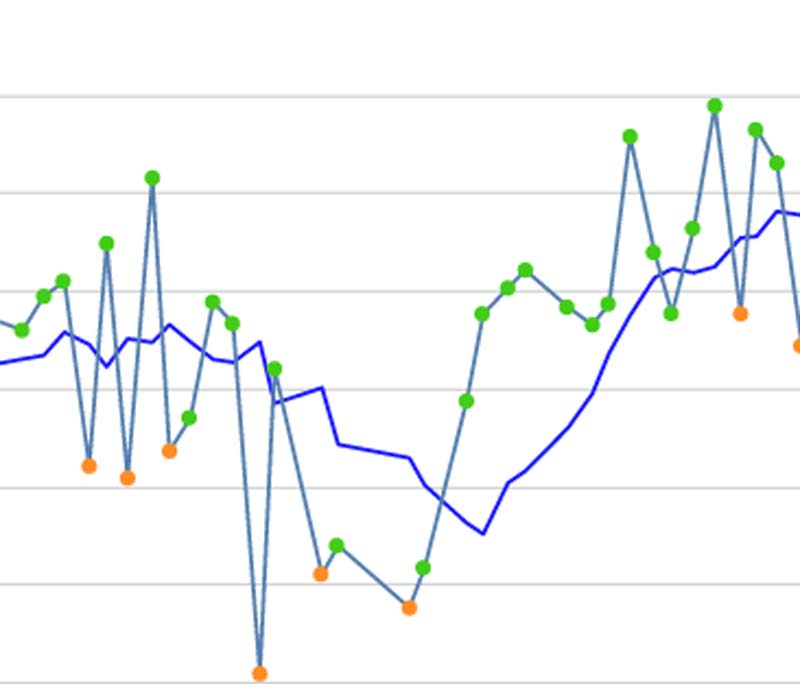
Aerobic exercise tends to have a stimulatory effect on parasympathetic modulation, which can be observed in the HRV score the following morning. This is one reason why moderate aerobic exercise is often used as an effective recovery modality. However, exercise intensity is an important mediator of cardiac-parasympathetic responses to the training session. A recent study by Plews and colleagues4 featuring Olympic-level rowers found that training phases of high intensity (e.g., above the second lactate threshold) suppressed HRV, while phases of lower intensities (e.g., below the lactate threshold) increased HRV.
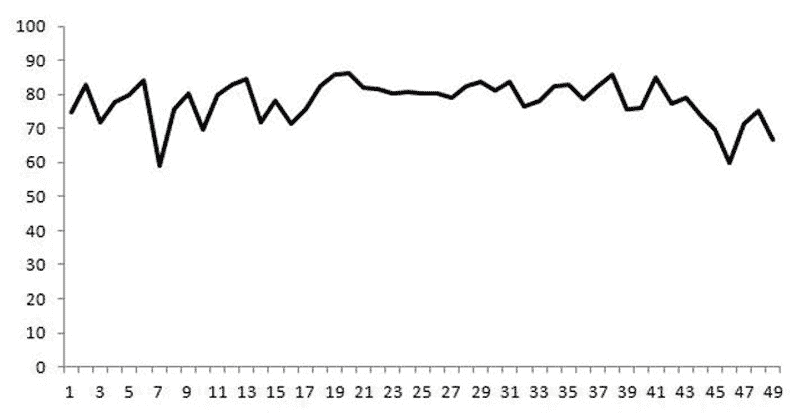
This is important to understand when interpreting an HRV trend over time. Phases involving moderate intensity aerobic work are likely to cause an increasing HRV trend, while phases of high intensity conditioning with minimal low intensity work will cause a decrease. The absence of low intensity aerobic work results in an absence of the stimulatory effects that this training type has on parasympathetic activity.
Further, the high intensity training will be more disruptive to homeostasis as a result of greater metabolic demand. In this situation, a progressive decrease in HRV can occur despite no meaningful increase in levels of fatigue. Therefore, you shouldn’t be alarmed if you observe a decrease in your HRV trend when limiting moderate aerobic work.
Conclusion
Monitoring HRV cannot be done effectively when following a black-and-white approach to trend interpretation (i.e., high = good, low = bad). Further, relying on an HRV score alone to assess training status will prove to be very difficult. HRV changes must always be taken into context, by keeping track of training load, training type/content, lifestyle factors (sleep quality, nutrition, stress, etc), and performance. These variables are complementary and provide a more complete picture of training status.
Users should therefore observe the HRV trend -> analyze in the context of sport and lifestyle demands (i.e., training load and psychometrics) -> determine the meaning of the change -> adjust training or lifestyle factors if necessary according to the goal of the current phase.
Since you’re here…
…we have a small favor to ask. More people are reading SimpliFaster than ever, and each week we bring you compelling content from coaches, sport scientists, and physiotherapists who are devoted to building better athletes. Please take a moment to share the articles on social media, engage the authors with questions and comments below, and link to articles when appropriate if you have a blog or participate on forums of related topics. — SF
References:
- Kiviniemi, A.M., Hautala, A.J., Kinnunen, H., and Tulppo, M.P. (2007). “Endurance training guided individually by daily heart rate variability measurements.” European Journal of Applied Physiology, 101(6), 743-751.
- Botek, M., McKune, A.J., Krejci, J., Stejskal, P., and Gába, A. (2013). “Change in Performance in Response to Training Load Adjustment Based on Autonomic Activity.” International Journal of Sports Medicine, 35(6), 482-488.
- Behrens, K., Hottenrott, K., Weippert, M., Montanus, H., Kreuzfeld, S., Rieger, A., and Stoll, R. (2014). “Individualization of exercise load control for inpatient cardiac rehabilitation: Development and evaluation of a HRV-based intervention program for patients with ischemic heart failure.” Herz.
- Plews, D.J., Laursen, P.B., Kilding, A.E., and Buchheit, M. (2014). “Heart Rate Variability and Training Intensity Distribution in Elite Rowers.” International Journal of Sports Physiology and Performance.
- Chen, J.L., Yeh, D.P., Lee, J.P., Chen, C.Y., Huang, C.Y., Lee, S.D., and Kuo, C.H. (2011). “Parasympathetic nervous activity mirrors recovery status in weightlifting performance after training.” The Journal of Strength & Conditioning Research, 25(6), 1546-1552.
- Edmonds, R.C., Sinclair, W.H., and Leicht, A.S. (2012). “The effect of weekly training and a game on heart rate variability in elite youth Rugby League players.”
- Morales, J., Garcia, V., García-Massó, X., Salvá, P., Escobar, R., and Busca, B. (2013). “The use of heart rate variability in assessing precompetitive stress in high-standard judo athletes.” Int J Sports Med, 34, 144-151.
- Merati, G., Maggioni, M.A., Invernizzi, P.L., Ciapparelli, C., Agnello, L., Veicsteinas, A., and Castiglioni, P. (2015). “Autonomic modulations of heart rate variability and performances in short-distance elite swimmers. European Journal of Applied Physiology, 115(4), 825-835.
- Thiel, C., Vogt, L., Bürklein, M., Rosenhagen, A., Hübscher, M., and Banzer, W. (2011). “Functional overreaching during preparation training of elite tennis professionals.” Journal of Human Knetics, 28, 79-89.
- Flatt, A.A. and Esco, M.R. “Smartphone-derived heart rate variability and training load in a female soccer team.” International Journal of Sports Physiology and Performance. In press.
- Buchheit, M., Chivot, A., Parouty, J., Mercier, D., Al-Haddad, H., Laursen, P.B., and Ahmaidi, S. (2010). “Monitoring endurance running performance using cardiac parasympathetic function.” European Journal of Applied Physiology, 108(6), 1153-1167.
- Flatt, A.A., and Esco, M.R. “Evaluating individual training adaptation with smartphone derived heart rate variability in a collegiate female soccer team.” J Str Cond Res. In Press.
- Le Meur, Y., Pichon, A., Schaal, K., Schmitt, L., Louis, J., Gueneron, J. and Hausswirth, C. (2013). “Evidence of parasympathetic hyperactivity in functionally overreached athletes.” Med Sci Sports Exerc, 45(11), 2061-71.
- Stanley, J., Peake, J.M., and Buchheit, M. (2013). “Cardiac parasympathetic reactivation following exercise: implications for training prescription.” Sports Medicine, 43(12), 1259-1277.
- Pichot, V., Roche, F., Gaspoz, J. M., Enjolras, F., Antoniadis, A., Minini, P., and Barthelemy, J.C. (2000). “Relation between heart rate variability and training load in middle-distance runners. Medicine and Science in Sports and Exercise. 32(10), 1729-1736.
- Flatt, A.A. and Esco, M.R. (2014). “Endurance performance relates to resting heart rate and its variability: A case study of a collegiate male cross-country athlete.” J Austral Strength Cond. 22:48-52, 2014.


In an average person, how much day-to-day fluctuation is normal? Is it usual for people to have a 2x fluctuation, ie 66 one day and 33 the next? Or only if training very heavily?
Hi Cindi. The author of the article, Dr Andrew Flatt uses the ithlete HRV app, which has a log scale for HRV, so actually a change from 66 to 33 on that scale would be massive 80% reduction. On the ithlete scale, anything below 50 is really quite a low score and the only time we saw such big reductions is in people who contracted conditions like swine flu that really stressed their bodies.
If you are talking about a raw scale, like plain rMSSD, then 66 to 33 is not such a big jump, and could be induced by a race or very intense training. You should look for recovery to baseline & preferably above within 2-3 days though, otherwise this loading could be non-functional (ie unproductive for adaptation).
FANTASTIC. Thank you for not just being another bit of evidence to add to the one side of the HRV right or wrong debate. You stated the issues with action based off black and white assesments, but didn’t totally throw it out the window. You showed it’s substantial correlation and reliability AS LONG AS all stressing factors are taken into consideration!
I would LOVE to see that same format put into an article discussing the LF/HF issue. HOPING there’s been enough progress by now on understanding and assimilation to comprehensible, actionable data from the LF/HR ratio.
Create article!
What’s the difference between lnrMSSD and rMSSD? I’m not quite sure what log-transformed means. Is it like a rolling average?
I’m currently tracking a number of clients through a daily questionnaire on sleep, mood, soreness, stress, fatigue; and also a 7 day rolling average on heart rate and rMSSD.
Lee.
Hi Lee. Ln just means taking the natural logarithm (Log to base e) of each raw RMSSD value. This transformation is used to make the distribution of HRV values more normal (Gaussian) so we can apply regular mean & standard deviation stats to identify significant changes. Hope this helps. Simon.
So when I’m seeing the rMSSD number on ithlete or HRV4Training it’s actually showing me the lnrMSSD?
That’s correct. ithlete multiplies the lnRMSSD x20 to give a number which is more intuitively meaningful. Generally speaking, elite endurance athletes >85, people in poor health <50, everyone else in between.
I see! Thanks.
Another question if i may:
Regarding CV% and it indicating that a higher CV% gave an indication that the women in the female soccer team were fatigued. However, what’s confusing me is that a higher CV% should be a good thing, because we’re adding stress to impose adaptations (SAID) causing HRV to decrease, but then giving adequate rest causing HRV to increase, this then causes a higher CV%. But why is a higher CV% seen as a negative?
Lee.
Hi Lee. You have to think about cause & effect and the time course of adaptation. Higher CV% compared to other members of the squad indicates that an individual player is reacting more to given loads, indicating lower resilience at that point in time. But as you say, that higher CV% will stimulate adaptation, so given sufficient deloading / taper (+ good nutrition, sleep, stress management), that player will adapt & become stronger / fitter / more resilient. They will then show a lower CV% for the same load in future indicating they are more resilient and ready for higher loads.
Hope that makes sense.
Simon.
That makes sense. I’ve also seen it stated that analyzing CV with other variables (7 day HRV mean, HR mean, Total Wellness score) can help to solidify the state of the individual and whether the data you are seeing is trivial or significant. I guess if HRV scores are lower than norm, HR scores are higher than norm, Wellness lower than norm and a CV% that is decreasing – this could be a good indication that the individual is now non-functionally overreaching (NFOR). However, if an individual has a CV that is increasing despite having the same scores as above, then that individual has more than likely only entered an acute stressed state and thus possibly hasn’t hit the NFOR stage yet.
That whole progression for an individual was well described in a research study by Dan Plews at HPSNZ summarised here https://www.myithlete.com/research-summary-a-successful-vs-an-overtrained-triathlete/
why does different people have different base #’s for SDNN>RMSSD.etc??
I am 58 BMI less than 20 and I train for health. I can recover from 160bpm to 90bpm in less than a minute yet interestingly my HRV value is the 30 in the morning and less later in the day. I do steady aerobics and interval training. My labs are good, I should be a sample of health but my HRV and resting heartrate 67 bpm put me more in line with overweight and sedentary people. Since I am new to this, I will talk to my Doctor next time.
Thank you and I shared this page on Facebook.
Hello David. Depending on what sensor and app you are using, that may be quite a low number, and to be honest is not consistent with your resting HR, HRR and general fitness level.
If you are using ithlete with a validated sensor, this article gives the range of HRV you could expect for your age https://www.myithlete.com/blog-heart-rate-variability-long-life-whats-connection/
Are you using paced breathing during the HRV measurement?
I like the article.
When I’ve done HRV measurements in the morning for 3 minute periods I’ve noticed the results can vary greatly by doing a second or third trial. It seems like HRV varies quite a bit during the 24 hour period. Has there been research on long period HRV?
I use a device that measures during my sleep and shows a graph and average for the whole night. I like that because I can’t really consciously influence the readings. I’ve used heartmath and they teach you have to change your HRV based on breathing rates and thoughts.
I do morning reading 4 minutes.,this is a first class article.
I get my HRV from my Apple Watch 4. I really don’t know what is fast or slow. My Heart Rate Variation for this week is averaging 164ms. I think the higher the number would be better. 200ms better than 100ms. Can you please help me?
Thanks,
Jim Hardy
Dear Jim,
Thanks for the comment. Unfortunately, at the present time, the Apple watch uses a crude measure of HRV called SDNN. This really does not allow us to distinguish the high frequency ‘parasympathetic’ or rest and digest component of HRV from the ‘fight or flight’ low frequency HRV.
The sensor position on the back of the wrist is also not ideal for making precise measurements.
We would recommend choosing one of the popular HRV apps, such as ithlete offered by Simplifaster if you do want to track your HRV precisely.
Best wishes,
Simon Wegerif.
Great article!
What would you say the best app to use is? I myself use the Elite HRV app but it requires a fairly expensive external monitor to take measurements. I’ve tried the Welltory app as well but it doesn’t actually give you a number for your HRV which I think would be useful for my online clients.
Many thanks
This is quite interesting. I am using Whoop which gives you a readiness score every day and I am starting to think it’s a futile endeavor.
If there are so many factors that need to be taken into account and trends aren’t black and white, at least for a recreational athlete, it seems a little pointless.
EB — sorry, you left this a few mths ago but I was wondering if your opinion of WHOOP changed? I’ve only been using it a few weeks and it seemed good, but then the past 4 days have been easy days and my HRV went way down (67 to 36) and RHR is way up (51 to 57) … but I don’t feel sick at all. Wondering if it’s me or WHOOP. Just curious if you have any further experience or insight. Thx.
I’m a college athlete (men’s lacrosse) and many of my teammates have HRV scores in the 100-120 range. While we are the same age, my average is anywhere from 35-41…… what does that mean? Should I be worried?
I am 74 and workout daily / Pilates and walking. My hrv normally is around 45 but lately has been spiking to 180?
Im 58 i wear a fitbit that averages my hrv during sleep. My concern is its been very low it goes from 9-20 for the last few months should i be worried it cant go much lower.i did have gallbladder surgery 3 weeks ago but i feel fine. Also i have had some sevral losses. Just wondering if that should be a concern?
I started on ADD meds a couple months ago. Shortly after my hrv and sleep plummeted. Since then my HRV is in the mid to upper 60s (Garmin watch) whereas it used to me in the 90s. Should this be a concern? I’ve thought about stopping the meds to see what happens. I’m a competitive cyclist, for my local scene, and am wondering whether the meds are affecting performance.
Isn’t a concern no. I take concerta for ADHD and not only experience similar effects, but ADHD and ADD medications have been proven to increase resting heart rate. This would then coincide with a decrease in HRV.
This is really interesting. I primarily train for rock climbing, with resistance training to support the physical demands of the sport. Most of the training is anaerobic which explains why I generally see flat or slightly down-trending HRV during training cycles. However, with a single rest day my HRV usually comes up to or above baseline which I believe is the more important factor.
I wonder how I can use overnight HRV to detect signs of overtraining if it isn’t related to the trend. Would I be looking more at the time for it to come back to baseline?