• Skip to content
  • Skip to primary sidebar
SimpliFaster

SimpliFaster

cart

Top Header Element

  • Facebook
  • Instagram
  • Twitter
  • YouTube
  • Login
  • cartCart
  • (925) 461-5990
  • Shop
  • Request a Quote
  • Blog
  • Buyer’s Guide
  • Freelap Friday Five
  • Podcast
  • Job Board
    • Candidate
    • Employer
    • Facebook
    • Instagram
    • Twitter
    • YouTube
You are here: Home / Blog

Blog

Skating Speed

Understanding the Basics of Skating Biomechanics with Sami Kaartinen

Freelap Friday Five| BySami Kaartinen, ByNick Gies

Skating Speed

Sami Kaartinen is a former professional ice hockey player (1998–2015), a doctoral student at the University of Eastern Finland (Sports and Exercise Medicine), and an S&C coach at KalPa Hockey (an elite league in Finland), where he is also in charge of skating coaching. Sami is the co-founder and chairman of Pro Prospect, which offers services to optimize the performance of individual athletes, mainly ice hockey players. He is studying skating biomechanics to offer tools to players and knowledge to coaches to help them improve their roles.

Sami has worked with all levels of hockey players, from very young beginners and junior World Championship athletes to Olympic athletes and professional hockey players in top European leagues and the NHL, helping them become better athletes and skaters. He has also had the opportunity to share his skating knowledge with coaches all over Europe.

Freelap USA: Your academic research has focused on ice skating biomechanics. Can you explain some of the major biomechanical differences between faster and slower skaters?

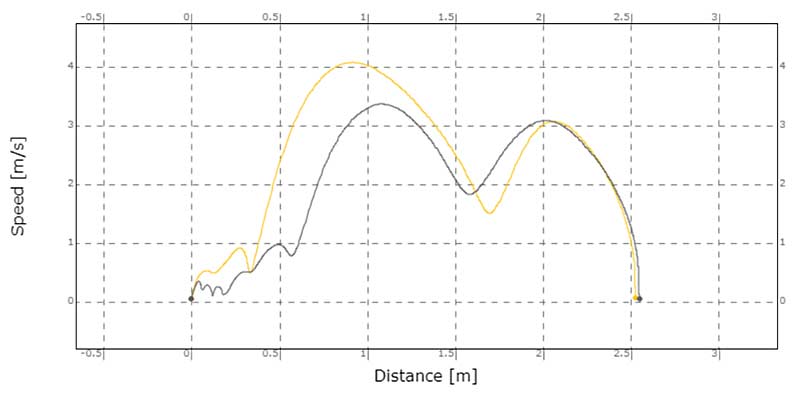
Sami Kaartinen: When talking about fast skaters, I like to divide them based on players with a good ability to accelerate and/or players with high maximal velocity. If you are good at accelerating, it doesn’t automatically mean you have a high maximal velocity or vice versa. Based on my own and previous studies of skating in ice hockey, it seems that there are kinematic elements that increase acceleration rates and maximal skating speeds.

The available knowledge on skating acceleration shows that “running” types of acceleration techniques would be the most efficient way to accelerate in ice hockey—meaning that faster skaters seem to have higher striding rates and shorter contact times (no gliding phase during the skating cycle), with sufficient hip external rotation to offer proper grip on the ice. To support previous components of “running start” acceleration, a higher center of mass (COM) has been reported during first steps. The players with higher acceleration rates have also reported a larger range of motion (ROM) of the hip joint. From my own experience, movement of the hip is one of the key elements driving acceleration.

I often see players having slow hip flexion, which limits:

  1. The amount of hip flexion during the recovery phase, causing too much hip flexion during initial ice contact and thus negatively affecting fast force production (“kicking” the ice, as I describe the phenomenon).
  2. There is some evidence that significant forward lean and skate placement straight under the hip, rather than in front of the body, are beneficial for a higher rate of acceleration.
When it comes to the maximal skating phase, greater knee flexion and ROM, together with sufficient hip adduction in the recovery phase, have been observed from the faster skaters. Share on X

When it comes to the maximal skating phase, greater knee flexion and ROM, together with sufficient hip adduction in the recovery phase, have been observed from the faster skaters. It has also been reported that faster skaters flex their hips more rapidly during the recovery phase. To support this finding, I found in my own study that lower muscle activity of the gluteus maximus (antagonist of the hip flexors) predicts higher skating speed. Furthermore, greater external rotation of the lower limb, together with high extension and abduction velocity, have also been reported to be favorable elements for achieving higher maximal skating speed.

In summary, I would say that during the first 3–4 steps (acceleration), the skate should not glide at all during the ice contact, while during initial ice contact, the lower limb should be significantly extended and contact time fairly short. During the maximal skating phase, great ROM of the hip, knee, and ankle with a quick recovery phase are the basic elements behind greater maximal skating speed.

Freelap USA: When designing an S&C program for a hockey player, what are the key areas coaches should focus on to help improve skating speed? 

Sami Kaartinen: Because I am deeply interested in the skating side of ice hockey, my S&C philosophy is based on that. Therefore, I see knowledge of skating biomechanics as the first step—skating might not be a movement the human body was made for. Skating is fast motion and includes movement in all planes (sagittal, frontal, and transversal), in maximal ROM, over a very thin skate blade, on a surface where minimal friction exists. Therefore, it is very important to understand the basics of skating biomechanics.

Even though skating includes different types of speed (e.g., reaction times, stops, and starts) with different kinds of skating techniques (crossovers, backward skating, turns, pivots, etc.), maximal forward skating speed is the simplest and the most analyzed speed in ice hockey. One forward skating stride (or cycle) is already quite a complicated movement pattern that sets high demands on the neuromuscular system.

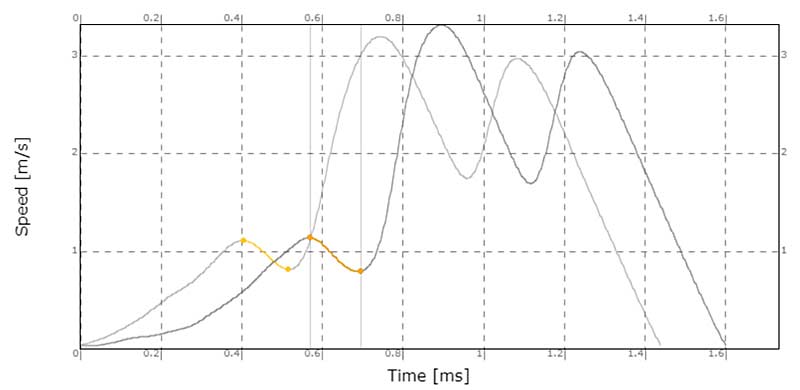
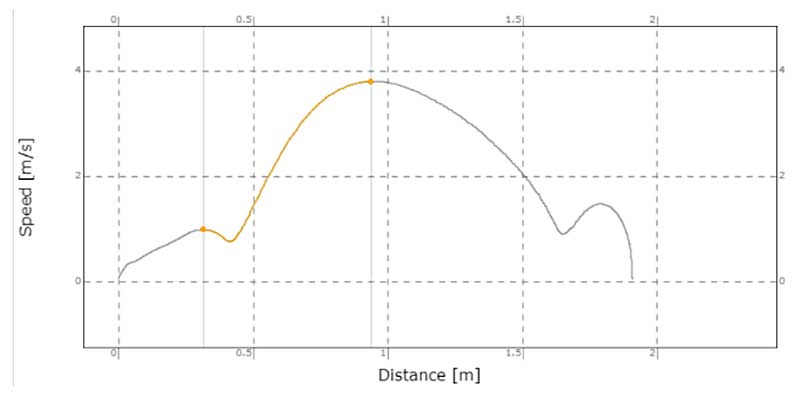
I want to explain how I see the forward skating stride during the maximal skating phase and which elements and phases are involved when discussing skating speed. The initial part of the propulsion phase, called the gliding phase, is where the most joint flexion of the lower limb joints occurs (“deepest position”) during the skating cycle. During the gliding phase, most muscles of the gliding leg seem to work isometrically (vertical force production) to hold the proper skating position and steer the movement (straight forward versus Z skating) created by opposite limb extension. From these quite deep joint angles, extension of the limb begins, and a lot of power needs to be produced horizontally.

Based on relevant research, it seems that ROM of the lower limb is the main factor behind higher maximal skating speed. Consequently, it is important that an S&C program includes exercises that support force production from quite deep joint angles to the complete extension of the limb. Even though maximal extension velocity is essential, the contact time in skating is quite long (0.35 seconds) compared to sprinting (0.1–0.15 seconds), which coaches should also take into account when deciding on exercises and their intensity.

It is important that an S&C program for an ice hockey player includes exercises that support force production from quite deep joint angles to the complete extension of the limb. Share on X

Following powerful extension and abduction (concentric contraction), the player should have suitable capacity to stop the extension motion with eccentric muscle force of the lower limb flexors and adductor muscles. This is the part of the skating cycle where I see a lot of problems and limitations and which causes a lot of injuries to the hip/groin area. A lack of eccentric contraction force in the flexors and adductors makes it very difficult to stop the extension/adduction quickly without limiting the ROM of the extension. Just based on my own experience, I would recommend adding two lower limb flexor exercises per one extension exercise in most cases. In contrast, to return the skate back under the body, extremely fast flexion of the lower limb (concentric work of the flexors and adductors) is a vital element. This enables a new propulsion phase to start as soon as possible.

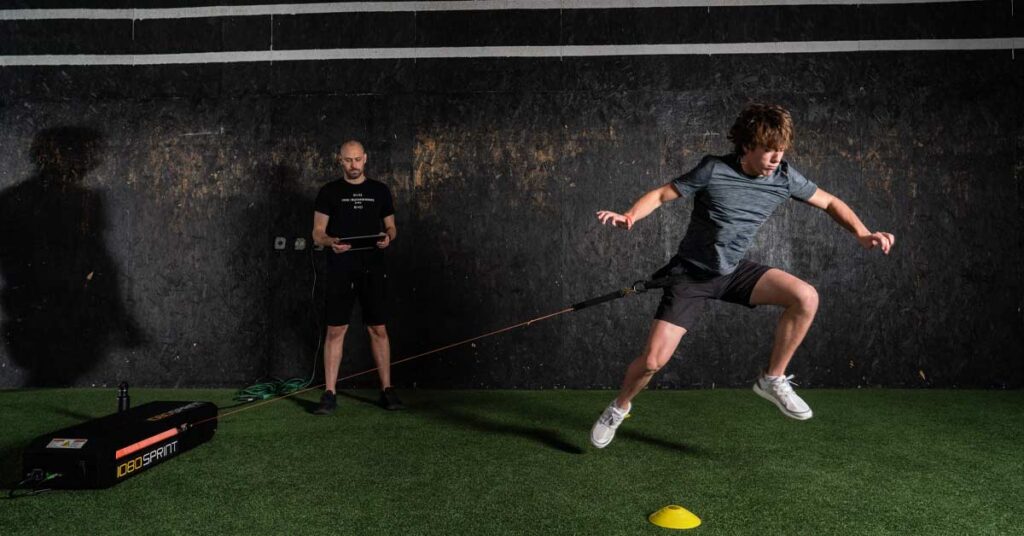
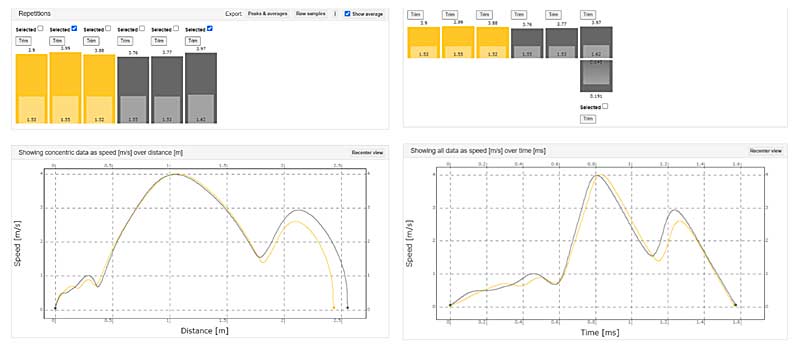
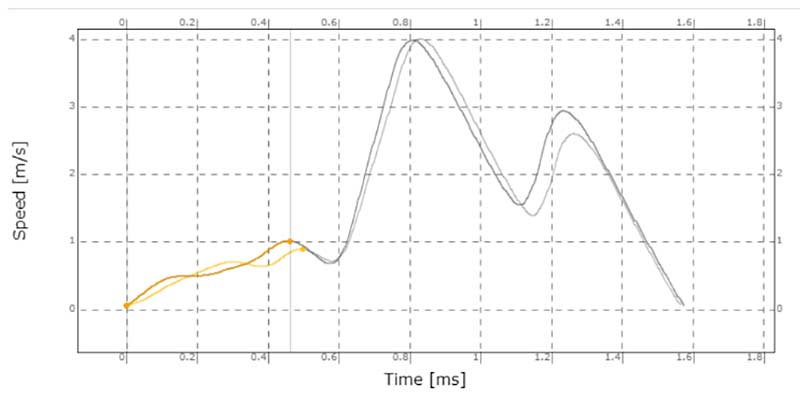
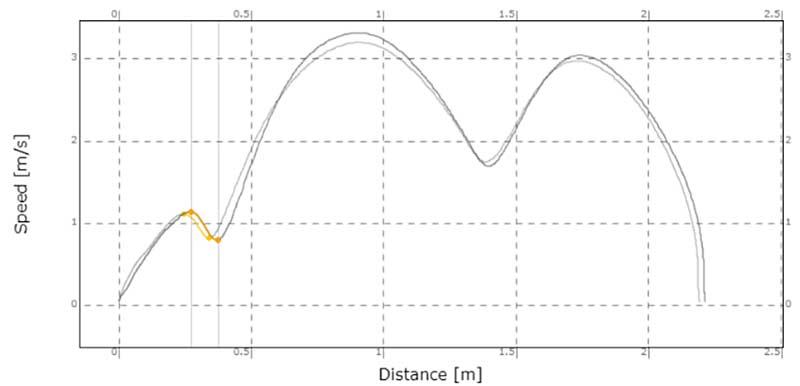
Of course, there also have to be physiological changes to improve skating speed, but as it is not my core knowledge, I’ll keep this part shorter. In general, increasing speed in ice hockey is based on the same exercise physiology facts as in other sports, where increased muscle force production with enhanced neural drive makes players move faster. Analysis should be done to establish this rate of force development (RFD). I prefer RFD analysis in sport-specific circumstances (on the ice in ice hockey), and there are already methods that could be used to make such analysis on the ice. Of course, off-ice analysis is very useful as well.

Depending on RFD analysis, a decision can be to focus on force production or/and neural drive parts. It should also be decided whether the main target is to develop skating acceleration or maximal skating speed because force-time characteristics are different (0.25 seconds versus 0.35 seconds). Based on these facts, coaches can decide which methods, exercises, intensity, periodization, etc., would work the best.

Freelap USA: In your research, you found that the recovery phase played an important role in achieving a faster skating speed. How would you go about training and improving this quality off-ice? 

Sami Kaartinen: I like to say that the recovery phase is a totally underrated and insufficiently focused part of the skating cycle—hence, including significant elements to increase skating speed. It can make a huge difference between skaters since the recovery phase covers approximately 40% of the skating cycle duration. If a player can execute it well, it significantly impacts their skating speed; in contrast, it could limit their skating speed and break their skating rhythm when done poorly. There are numerous ways a poor recovery phase disturbs skating (e.g., short ROM, improper skate position, duration of the phase is too long) and limits skating speed.

The recovery phrase is a totally underrated and insufficiently focused part of the skating cycle—hence, including significant elements to increase skating speed. Share on X

The recovery phase includes two main points:

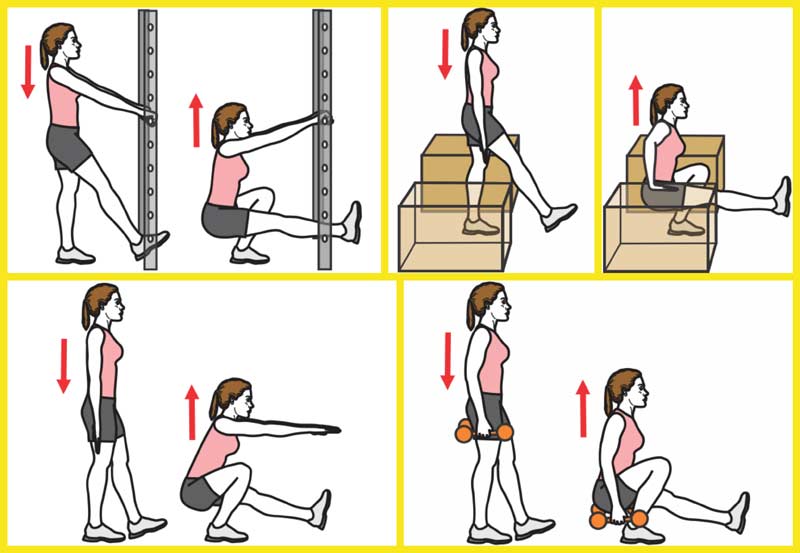
  1. The “change of direction” point, where the direction of the motion should be changed as fast as possible. To be able to execute this phase efficiently, the lower limb flexor muscles need to produce a lot of eccentric force. The first physiological thing that could limit performance is the excessive imbalance between lower limb extensor/abductor muscles, concentric force production, and eccentric force production of the flexor/adductor muscles. To minimize the imbalance, many specific exercises for lower limb flexors should be done because most “traditional” strength exercises don’t offer the needed load for this motion (two flexion per one extension).
    Assisted band exercises work well here—in these, the concentric phase (flexion) is done against the band (as quickly as possible with maximal ROM). During the eccentric phase (extension), the rubber band is pulled by other players to create more resistance during leg extension (eccentric force). Similar results could also be reached with flywheel devices.
  1. Another important action during the recovery phase is quick hip flexion. I have used “overspeed” methods and exercises to improve this phase. The principle behind the method is to create circumstances where the flexion movement is executed faster than it could be done voluntarily. Different exercises with Bosu balls or other equipment that can create a bounce effect are suitable, including an exercise where an athlete “kicks” the Bosu (which is set on the floor behind the athlete), and the Bosu flings the leg to flexion motion.

Freelap USA: There seems to be a debate among hockey strength coaches on the merits of strength training on one versus two legs, for example, rear foot elevated split squats versus barbell back squats. What are your thoughts on lower-body strength development for hockey players as it relates to skating speed?

Sami Kaartinen: I think both are useful, and it is not an “either/or” thing. In all cases, regardless of the exercise, good technique is the first target, and we, as coaches, should choose the exercises that the athlete can execute with good technique. I also think it’s more what we want to achieve from the exercises than which exercise we use.

Concerning unilateral versus bilateral exercises, more demands on the synergist muscles are needed to control the motion in unilateral exercises. In my opinion, it is easier to create more exercise variations and aim the exercise more specifically to support skating when utilizing unilateral exercises. I also prefer to use unilateral exercises when less overall physical load exists. Bilateral exercise might work better in heavy resistance training during the hockey season to avoid overload of the stabilizer muscles and reduce the risk of injuries. Of course, it is not so simple, but to address the topic, such a guideline could work.

I also like to use unilateral exercises more regularly in all types of strength training when a player has achieved a decent strength level, when they have sufficient ability to control unilateral exercises (fast motion or heavy load), and/or when there are clear target muscle groups (weak link) that should especially be improved. I also prefer exercises where the force production is clearly horizontal.

To work horizontally, all lower limb joints are involved to produce a motion. Both rear foot elevated split squats and barbell back squats (vertical direction movements) activate the movement of the ankle joint a little. My own experience is that the ankle joint is very often the weak link (strength or mobility of the ankle); thus, exercises that offer horizontal force production are recommended.

Bilateral exercises quite often produce linear motion, but as mentioned earlier, with leg extension during the forward skating stride, external rotation exists (demands of the lower limb abductors and other stabilizer muscles) to offer the proper grip on the ice, making such exercises also necessary. Without suitable support from the stabilizer muscles, the force production of the quadriceps and glutes is not fully delivered to the ice; thus, optimal performance will not be achieved.

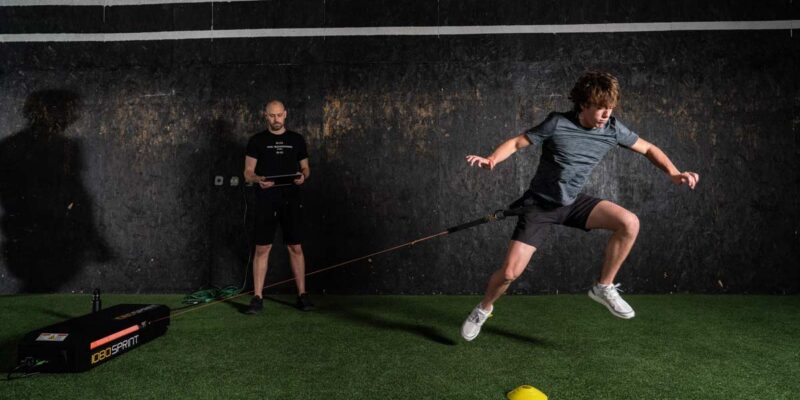
To summarize my answer, both unilateral and bilateral exercises are helpful in developing strength capacity. In addition, a very useful tool to develop skating-specific strength is to do it on the ice. When possible, I always prefer to use the method of skating against resistance (e.g., a band) on the ice. I have found it also a critical part of an on-ice rehab program after injuries to get players to return to the games in optimal shape.

Freelap USA: Many S&C coaches implement sprint training in their athletes’ off-ice programs. Can you explain the biomechanical similarities and/or differences between the skating stride and linear sprinting? Moreover, do you think sprint training can have a beneficial impact on on-ice skating performance?

Sami Kaartinen: I think—and studies have shown—that if you are a fast runner, you are likely also a fast skater. But improving skating speed by running may not be straightforward. The reason comes down to the differences in muscle actions and neural control required by the two actions.

Ground contact time (GCT) during sprinting acceleration is about 0.18 seconds, and it decreases close to 0.1 seconds or less during the subsequent steps. Meanwhile, in ice hockey, the contact time moves in the opposite direction, starting from 0.25 seconds while accelerating and being about 0.35 seconds at the maximal skating phase. The short contact time in running allows for the storage and utilization of elastic energy and using that energy to power the running. In contrast, stride GCT lasts longer during ice hockey, which limits the potential of elastic energy utilization and requires power to be generated with concentric muscle contraction. These differences are reflected in the effective training strategies that, in running, include more plyometric training, and in skating, include more exercises to improve concentric force generation ability.

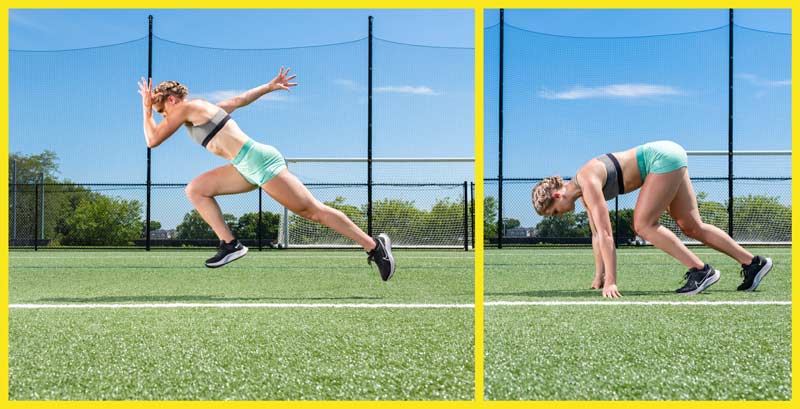
There are also noticeable differences in kinematics while sprinting and skating. First, the lower limb range of motion during ground contact is generally significantly greater while skating. Additionally, in skating, the hip and knee ROM increase, going from the acceleration phase to maximal speed skating, whereas in sprinting, the opposite change occurs.

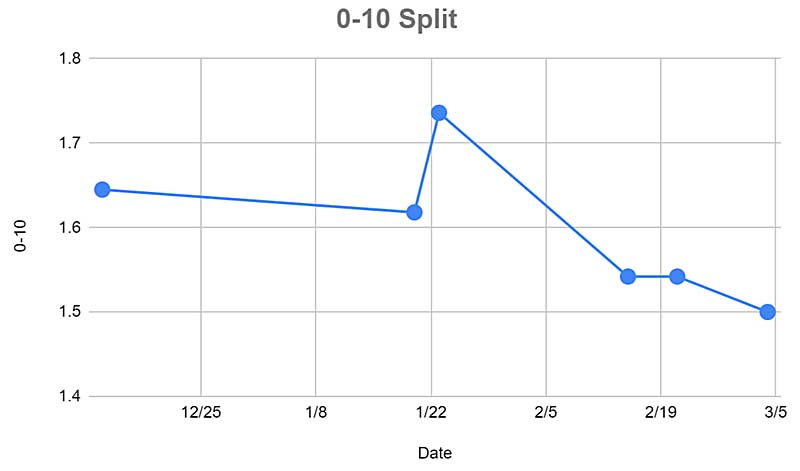
So, to answer the question, I find linear sprinting a valuable method to develop skating speed. But I use short sprints (0–10/15 meters)—basically the phase before the maximal sprinting phase—because short sprints better mimic the maximal skating phase kinematics in shorter GCT as on the ice. To better match the GCT and kinematics seen in skating, I often use either uphill sprints or resisted sprints. These are methods that I have also found very safe for hockey players.

To better match the GCT and kinematics seen in skating, I often use either uphill or resisted sprints. These are methods I have also found very safe for hockey players. Share on X

Sprint training is a useful tool to develop skating speed, but it has to be well-designed as part of training, and the purpose of the training needs to be clear. To avoid unnecessary injuries, I would be careful about making ice hockey players run full-speed sprints where maximal sprinting biomechanics occur, as there are more safe methods to use that are more linked to skating performance and biomechanics.

Since you’re here…
…we have a small favor to ask. More people are reading SimpliFaster than ever, and each week we bring you compelling content from coaches, sport scientists, and physiotherapists who are devoted to building better athletes. Please take a moment to share the articles on social media, engage the authors with questions and comments below, and link to articles when appropriate if you have a blog or participate on forums of related topics. — SF


K-Push Handheld Dynamometer

Kinvent K-Push Review: An Impressive New Handheld Dynamometer

Blog| ByVien Vu

K-Push Handheld Dynamometer

The handheld dynamometer (HHD) market has exploded as strength coaches and rehab professionals have adapted the evidence from taking objective measurements to use for the monitoring and safe return to sport. Not only have sales of classic dynamometers such as the MicroFET and Lafyette HHD increased, but newly developed app-based dynamometers have emerged (figure 1 below). One of the new arrivals is Kinvent’s K-Push.

Kinvent sells a separate K-Pull pull-type dynamometer, and readers should also check out this article to determine what HHD to purchase. This particular review only focuses on the K-Push.

Technical Specifications

Push dynamometers generally have less load capacity than pull dynamometers, and the K-Push is advertised with a 90-kilogram load capacity. However, its true load capacity is 135 kilograms, and users can feel confident consistently hitting that threshold. This makes it ideal for testing the common muscle groups, such as the hip complex, hamstrings, shoulders, quadriceps, and neck.

Rate of force development (RFD) at different time points has been a metric that users increasingly want, but accurate RFD requires a high sampling rate. The device is the top in the market with 1,000 Hz, which is recommended for RFD testing. This means the device records 1,000 data points per second.

The K-Push’s advertised sampling rate is 250 Hz, and the default is set at 125 Hz in-app, but users can go into the app to select the 1,000 Hz option if they want to acquire more accurate RFD metrics. Share on X

The K-Push’s advertised sampling rate is 250 Hz, and the default sampling rate is set at 125 Hz in-app, but users can go into the app to select the 1,000 Hz option if they want to begin acquiring more accurate RFD metrics. The engineers state that the sensors can handle up to 2,000 Hz, but at this time, the settings only allow it to be set to 1,000 Hz. As a reference, gold-standard isokinetic dynamometers, such as the HUMAC Norm, have sampling rates up to 2,500 Hz.1

Handheld Dynamometer Market
Figure 1. Comparison of select app-based push dynamometers.

As with many of Kinvent’s products, the K-Push’s battery life is very impressive, and its charge time remains short. With multiple uses per work hour, the tested device only required charging twice over the four months I used it. It also utilizes USB type C to charge, which is convenient since that is what charges most devices nowadays—no excessive cords around the office/desk. Connectivity issues have been reported in Kinvent’s smaller K-Force force plates; however, those issues are not present with the K-Push. The device quickly synced every time within seconds.

Hardware

The entire hardware and design have received updates from its second-generation iteration. The silicon pad is robust, flexible, and comfortable, whereas the generation 2 pad was flimsy and connected by weak magnets (figure 2). The cover has resisted drops, punctures, and any kind of damage over heavy usage (and a few drops—whoops!).

K-Push Silicone
Figure 2. The silicon pad attached to the K-Push is flexible, durable, and comfortable to push against during testing. You can easily remove the pad to clean it.

The most welcome change is the addition of a strong magnet on the back. Gone is a slide-and-click attachment system, replaced by a magnet that mounts to useful attachments such as handles, straps, clamps, and anything metal (figure 3). This makes standardizing and choosing good fixation easy and accessible (figure 4).

The addition of a strong magnet on the back is easily the best feature of the Kinvent K-Push, as fixation is often challenging yet so important for accuracy and reliability, says @MuyVienDPT. Share on X

The magnet itself is strong. It took 20 pounds of force before I pulled it off. (Yes, I tested it five times with a pull dynamometer.) This is easily the best feature of the device, as fixation is often challenging yet so important in accuracy and reliability.

K-Push Attachments
Figure 3. Available attachments for the K-Push.
k-Push Magnet
Figure 4. The ease and versatility of fixation with the K-Push magnet. Users will find it easy to set up fixation as long as there are metal objects around. The possibilities are endless.

Lastly, the rigid button has been replaced with a rubberized one. Although it lacks the tactile stiffness of the generation 2 K-Push, it is more responsive than the buttons on other Kinvent gen 3 devices.

There is now also a “button start” feature: once the test is set up, users do not need to push “Start” on the app but can just press the button on the device to begin the test. This change was made to save users time, but it doesn’t improve user experience as it just avoids one extra button push. Additionally, the button push function does not also work as a “Next” function: this would be an extremely useful add when clinicians are going through protocols of bundle tests. It’s a great idea but not fully utilized, given where the software is currently.

Overall, the generation 2 K-Push was impressive and great to use, and the engineers somehow improved the hardware even more.

The Software

A short time before the generation 3 release, Kinvent released the K-Physio app and discontinued support for their K-Force app. The K-Physio app is a significant upgrade, and it’s what all users will want. This K-Physio app now gives users access to a lot more data, such as RFD, impulse, and fatigue (figure 6).

The visualization is great and defaults with peak force symmetry as the main metric displayed. It also gives you the average peak force of each rep as you scroll farther, but it does not give you the average of the three. Some people may want the average symmetry, but I think peak force among all reps is the way to go. Users can also delete the reps they do not want to keep. Lastly, a recent update now publishes normative data with standard deviations for popular tests.

Not only can users make any test they want with their own custom picture and description, but they can also build their own protocols, says @MuyVienDPT. Share on X

Another great feature of the software is its customization. Not only can users make any test they want with their own custom picture and description, but they can also build their own protocols. For example, users can string together eight different hip tests to efficiently analyze the hip complex without manually selecting each test separately. This saves an incredible amount of time, especially when the actual tester memorizes the sequence. For the pre-programmed assortment of tests, you can customize many settings, such as the number of reps, length of tests, and prep time between reps. The number of limbs can also be customized (figure 5).

Standard Testing Parameters
Figure 5. Users can customize a host of parameters to standardize prep, test, and rest times.

PDF reports can be customized and generated on the app, which can then be directly emailed to patients and stakeholders.

As I mentioned in other reviews, Kinvent has a desktop platform—however, it is lacking (figure 7). Users who access their data on their desktop computer will miss out on 90% of the mobile app’s functionality. Among the missing features on the desktop app at the time of this review are the ability to:

  • Delete test sessions.
  • Edit users.
  • See advanced metrics (for jumps).
  • Customize reports.
  • Make/sort groups.
  • Administer a test (the most important one).

The desktop app does not pick up or allow you to enter the demographic info of participants. For rehab specialists who need to document and multi-task on their laptop, this hinders their daily operations.

As usual, Kinvent’s training modes are what makes their software great. These are really simple games that include Karl the Kangaroo scuba, catching fruit, and playing bubble blaster (see figure 8). As the level gets more challenging, users have to use more force and power to accomplish their goal. There’s also more feedback-driven training, such as isometric training that users can precisely set for 1RM-based force (figure 8).

Most people who only have the dynamometer will do well with the $350 starter package (tables 1 and 2), but those who also have the Kinvent force plate should upgrade to the Premium or Excellence packages.

Software Features
Table 1. Features based on the software package purchased.
Reporting Features
Table 2. Reporting features based on package purchased.
Advanced Metrics
Figure 6. Advanced metrics viewable on the tablet/mobile app. For squat and push-up analysis, the visuals and resulting data are identical.
Testing Visualizations
Figure 7. Strength testing visualization differences on the mobile versus desktop app.
Training Games
Figure 8. Training modes and customizable parameters.

Overall Score

Score: 9.5/10

Kinvent K-Push is the best handheld dynamometer on the market, with a slick mobile app and top-of-the-line technical specs. The build quality, easy fixation, customizability, battery, training modes, and visualizations will make people want to use it often for testing and as an intervention. If an updated desktop application comes out, consider this a 10/10.

Since you’re here…
…we have a small favor to ask. More people are reading SimpliFaster than ever, and each week we bring you compelling content from coaches, sport scientists, and physiotherapists who are devoted to building better athletes. Please take a moment to share the articles on social media, engage the authors with questions and comments below, and link to articles when appropriate if you have a blog or participate on forums of related topics. — SF


References

1. Maffiuletti NA, Aagaard P, Blazevich AJ, Folland J, Tillin N, and Duchateau J. “Rate of force development: physiological and methodological considerations.” European Journal of Applied Physiology. 2016 Jun;116(6):1091–116. doi: 10.1007/s00421-016-3346-6. Epub 2016 Mar 3. PMID: 26941023; PMCID: PMC4875063.

Core Dilemmas

Hold on a Minute: 3 Dilemmas in Our Understanding of Core Stability

Blog| ByNick Gies

Core Dilemmas

Despite the popularity of core training in fitness, rehab, and performance spheres, I have a sneaking suspicion that we aren’t all talking about the same thing. I’m not even sure we all agree on what the core even is, and maybe more importantly, how to best monitor and train it to reduce injuries or improve performance.

Let me explain.

You often hear coaches talk about training the “core,” but what does that even mean? I liken it to someone saying they trained their “legs.” What specifically did you train? What muscle groups? What contraction types and speeds? Endurance, max strength, or power? Which planes of motion? It’s such a vague descriptor that it’s essentially meaningless.

I’m not even sure we all agree on what the core even is, and maybe more importantly, how to best monitor and train it to reduce injuries or improve performance, says @CoachGies. Share on X

The term “core training” is often used as a catch-all for low-intensity exercises that isolate certain trunk muscles, but not always. Coaches will lump together rotational medicine ball throws, crawls, carries, loaded trunk movements, and other exercises under the singular banner of core stability.

Despite decades of related research on the topic, three distinct dilemmas have emerged that I believe are holding back our industry’s understanding and implementation of core training in both the S&C and rehab professions:

  1. No universal understanding of what core stability even is.
  2. Inadequate testing methods.
  3. No clear training framework.

But before we explore my justification for this hot take, it would be worthwhile to review how people can hold such differing opinions from one another. There are two cognitive biases that may help illuminate these problems (they might also help you understand the never-ending source of S&C Twitter conflicts):

  1. The Anchoring Bias.
  2. The False Consensus Effect.

The anchoring bias is the tendency to be overly influenced by the first piece of information we hear (for example, “Core training can prevent back injuries” or “The best core training involves anti-extension/rotation exercises”). All future information is then processed through this reference point rather than being objectively viewed.

It’s also very difficult to counteract this bias if you aren’t actively trying to challenge your priors (echo chambers, anyone?). Think of it this way: if you are a young intern and the facility you begin your career at is adamant that barbell squats and deadlifts are all an athlete needs for core development, you will view all future core stability information through that lens. Similarly, if you are a physiotherapy student and are told every patient needs isolated motor control exercises to engage the core properly, you are more likely to continue with those views going forward.

The false consensus effect is the tendency to overestimate how much others agree with your beliefs, behaviors, attitudes, and values. You overestimate the number of individuals that think like you and believe the vast majority of people share your training beliefs. Most coaches likely believe the rest of the industry thinks like them, and those who disagree are just outliers (or idiots). If you think most people think like you, you will be less likely to seek out differing opinions to challenge your beliefs because, well, why would you if you’ve got things figured out?

In an industry that loves to dichotomize anything and everything, core training is no exception. Some coaches preach the need to include isolated and specific exercises to target the core, or else this area will become underdeveloped and expose you to injury or poor performance. Others are confident that no direct training is needed and that barbell exercises and athletic movements will train the core just fine. Some think the spine shouldn’t move and be trained in static positions or with bodyweight movements only; others believe the spine should move freely and be loaded, sometimes in extreme positions.

It seems that many coaches hold strong beliefs on this topic, with many believing their views on core training are right while others are wrong.

The Three Dilemmas Holding Us Back

As I present the rest of the article, try to keep both the anchoring bias and false consensus effect in mind. Perhaps you will start to reflect on how you’ve fallen for both of these, not just around core training but with other training concepts as well.

1. The Definition Dilemma

In 1964, Justice Potter Stewart was famously quoted as saying, “I know it when I see it” when attempting to define pornography. The same could be said about the core and core training. Most people would largely know what those terms mean and what a core exercise is if they saw one performed.

But does everyone have the same understanding of what the core or core training is despite using the same terms?

Are we really speaking the same language?

The muscles attaching to the spine are often referred to as the “core”; however, the exact anatomical makeup of the core is not unanimously agreed upon among coaches and researchers.1 The functional capacity of these muscles is often termed “core stability” and has been the subject of extensive scientific investigation over the last 30 years. However, despite extensive research, there is still considerable confusion as to the exact definition of core stability.2–4

Without clear definitions in place, the interpretation of research data depends on the reader’s CURRENT conceptual understanding of core stability. We see this play out all the time on social media. Share on X

Without a clear series of definitions in place, the interpretation of research data is dependent on the reader’s current conceptual understanding of core stability. We see this play out all the time on social media. A study comes out, and there are wildly different interpretations of the results and conclusions, which leads to extensive debates, name-calling, and confused bystanders. As such, several researchers have highlighted that research cannot advance on this topic unless there is some definitional consensus.3–5

Many of the definitions in use today are too broad or too vague to provide much practical worth. They do little to inform coaches on which physiological qualities to address. Researchers have suggested that the diversity of definitions in the literature hampers the ability to summarize research findings and draw clear conclusions.6 Some of the definitional differences could be due to the context in which they are viewed.3 For example, in rehabilitation sectors, where treatment goals revolve around decreasing pain and returning to function, the concept of core stability and how to train it may look different than in S&C circles, where the priority is improving highly dynamic sporting movements.

Broadly speaking, there are three common terms used in the literature:7

  1. Core endurance: The ability to maintain a position for an extended period or perform multiple reps.
  2. Core strength: The ability to produce muscular force or intra-abdominal pressure.
  3. Core stability: The capacity of the stabilizing system to maintain intervertebral neutral zones during various activities.

What causes confusion is that these terms are often used interchangeably in the literature. Similarly, there is no agreement on the appropriate use of these terms in practical circles.1

Another term that is becoming more prevalent is “lumbopelvic control” (LPC)—or some variation of this—which is defined as “the ability to actively mobilize or stabilize the lumbopelvic region in response to internally or externally generated perturbations.”8 Other terms commonly used to describe the core include trunk, torso, and fascial slings. Without a clear agreement on what the definitions are and when to best use the terms, it ultimately boils down to the coach’s interpretation and previous experience with using those terms.

2. The Testing Dilemma

There are many established and validated testing procedures that help assess a wide range of functional and athletic capacities. These include muscular strength, muscular endurance, specific energy systems, power, and linear and multidirectional speed. In regard to testing core stability, there seem to be no validated tests capable of assessing the full spectrum of functional capacities of the core.9

For instance, the most commonly used tests for assessing the core consist of timed isometric holds (e.g., prone plank). Although these muscular endurance tests are reliable,10 they do not reflect the force and velocity demands seen during sporting activities and are likely to be inappropriate for athletic populations.9 It’s important to note that many of the most common core stability assessments were originally developed for individuals with low back pain (LBP).11 These tests would obviously be performed at a slower speed or be isometric in nature, rather than generating rapid muscular contractions, yet have seemed to permeate performance spheres and athletic testing batteries.

It’s important to note that many of the most common core stability assessments were originally developed for individuals with low back pain, says @CoachGies. Share on X

Similarly, there are currently no practically viable or validated methods available to assess maximal core strength for S&C coaches, although this quality appears relevant to athletic populations.12,13 Critically, it remains unknown whether—or how—coaches are monitoring core stability in practice. This is an important point because core stability training is a widely used tool in our industry, with nearly every coach implementing some sort of protocol to enhance this area. Yet, without established and validated tests to assess distinct physical qualities associated with core stability (e.g., strength versus endurance versus power), it’s impossible to discern the practical value of various core stability training programs and protocols.

3. The Training Dilemma

There are many widely accepted and validated training frameworks to develop either global physiological capacities (e.g., maximum strength or peak power) or specific morphological adaptations (e.g., eccentric training to increase muscle fascicle length). The same doesn’t seem to be true regarding training the core, as there is no broadly accepted training framework. To make matters worse, most coaches believe their way of training the core is superior or believe most coaches are doing what they are doing already (refer back to the Cognitive Biases section).

As with testing methods, many of the core stability training recommendations in the literature have been developed from research examining rehabilitation methods for chronic LBP.14 These exercises have since spread to training programs designed for athletes but have been heavily criticized as inappropriate for improving physical performance in healthy athletic populations.15 You can see how these rehab-based recommendations have seeped into the industry, as most coaches have at least heard concepts relating to “activate your core” prior to doing some sort of movement or even, more popularly, Dr. Stuart McGill’s “Big 3” exercises to prevent LBP.

Due to the absence of clear and robust training frameworks, current practical applications seem to vary extensively.1 There is considerable debate as to whether core stability should be trained using isolated exercises, classical barbell movements, and/or athletic movement drills.4,15,16 I’m sure every coach has heard people debate the merits of specific exercises or methods for developing the core.

Several attempts at creating more complete and well-rounded training frameworks have been proposed in the literature.3,17 However, whether these models improve performance or prevent injury has not been rigorously tested or validated. This bears repeating: There are currently no validated—or thoroughly tested—training frameworks for developing the core.

This bears repeating: There are currently no validated—or thoroughly tested—training frameworks for developing the core, says @CoachGies. Share on X

Either the science is sparse or inadequate (e.g., training interventions with too few subjects or too short a duration), or the programs are based more on theory or practical coaching experience. This is not to say training methods designed from coaching experience aren’t valid or useful, but we may need to temper the strength of our beliefs if the scientific backing just isn’t there. This lack of guidance, coupled with opposing opinions on best practices, leaves S&C coaches with a confusing diversity of mixed messages.

So, What Do We Do Now?

While it’s beyond the scope of this article to solve any of these dilemmas, that doesn’t mean all is lost. There are two areas of improvement that we can work on from both a scientific and practical perspective.

1. Say What You Mean, and Mean What You Say!

First, there needs to be an alignment of terminology. Precision of speech is critical if we are to effectively convey our thoughts to athletes and other coaches. Using similar-sounding—yet fundamentally different—terms does little to advance our understanding or application of core training.

Look, I get it; when talking to an athlete or someone who isn’t a coach, using some terms interchangeably might not make much difference in the quality of training received. But as a profession, the more precise and aligned we can be in our terminology, the better. I would urge you—the reader—to be aware of how these terms are being used in both academic and practical contexts.

Academically

When reading a paper on core stability training, dig into the methods section and see how the authors actually define these terms and what exercise interventions they use. I bet you’d be surprised at what you find!

Many research papers that assess or implement “core strength” methods (as specified by their titles, introductions, and conclusions) often use muscle endurance exercises and protocols (e.g., planks, sit-ups, or other high-rep bodyweight exercises). For argument’s sake, this would be akin to a research paper examining “lower body strength training” and concluding it doesn’t have an impact on vertical jump ability in high school athletes. But if the training intervention only utilized wall sits as their strength training exercise, I’m sure many coaches would take issue with people saying that lower-body strength training isn’t useful for athletes because this doesn’t look at the whole spectrum of lower-body strength training exercises or methods.

I would also assume that wall sits weren’t the first exercise you thought of when you read “lower body strength training.” You would probably define it as a muscular endurance exercise or a long-duration-yielding isometric, and that’s my point. From a methodology standpoint, understanding precisely what a research paper is investigating will allow you to determine the merits of the exercises investigated rather than assuming their worth based on the general terms used by the authors had you not dug a little deeper.

Practically

Nearly all coaches will have assumptions and personal preferences about what constitutes “core training.” It’s almost so general of a term as not to really mean much. If a coach says they did core training with an athlete, you might have an assumption of what they did, but you really have no idea what exercises were used or what physical qualities were developed. Some coaches might be more biased toward dynamic spinal movements with external loads, some might only implement isometric bodyweight holds, and others might view the classical barbell exercises as sufficient.

Consider how Alex Natera has improved our practical understanding of isometric training by breaking the concept into several distinct categories to target specific qualities for field sport and track athletes. Or how Lachlan Wilmot’s Plyometric Continuum caught fire because it categorized jump-based exercises into distinct and specific categories to improve exercise selection. Rather than falling back on umbrella terms like “isometric training” or “plyometrics,” they expanded those concepts and brought specific terminology to the forefront so everyone spoke a similar language.

Without a clear set of terms to describe the complexity of core training, it will be tough to determine exactly what other coaches mean when they say ‘core training,’ says @CoachGies. Share on X

Without a clear set of terms to describe the complexity of core training, it will be tough to determine exactly what other coaches mean when they say “core training.” Again, I would urge you to think deeply about which terms you use and if they make the most sense for the physiological adaptations you are looking to develop or the phase of training for the athlete. A non-exhaustive list of possible terms you can use to describe core exercises more precisely includes:

  • Core strength (e.g., 5–8RM weighted decline sit-up)
  • Core endurance (e.g., bodyweight sit-ups to volitional exhaustion)
  • Core power (e.g., split stance rotational medball throw)
  • Trunk flexion (e.g., sit-up), hip flexion (e.g., hanging leg raise), lateral trunk flexion (e.g., side bend), trunk/hip extension (e.g., 45° back extension), trunk rotation (e.g., Russian twist)
  • Prone (e.g., front plank) or supine (e.g., deadbug)
  • Dynamic (pro-movement, e.g., sit-up) or static (anti-movement, e.g., Pallof hold)
  • Isolated (e.g., crunch or side plank) or global (e.g., back squat or Turkish get-up)
  • Low load (e.g., bodyweight front plank for max time) or high load (e.g., front plank with 45-pound plate on hips for 20 seconds)
  • Lumbopelvic stability (e.g., bird dog with minimal movement in the lumbopelvic region)

The more precise your terminology, the more easily coaches can understand what you are actually implementing. You will also be able to assess whether your “core training” program checks off all the boxes you want it to or if there is a quality you might be neglecting.

2. Utilize a More Comprehensive Core Training Framework

Finally, the development of a more comprehensive core training framework for athletic performance is needed.  Often, core training can be an afterthought, programmed haphazardly at the end of sessions or, even worse, utilized as a “filler” to check a box.

Like many coaches, I was intrigued by Lachlan Wilmot’s Plyometric Continuum, as it opened my eyes to how poorly I was prescribing jump training with my athletes. I decided the way I implemented core training could benefit from a similar framework of simple and clear progressions for the beginner to the advanced athlete. This way, I could more easily slot an athlete into the progression streams that make the most sense or select the best exercises for the sport or time of year.

Thus was born my version of a Core Training Continuum.

Core Continuum
Figure 1. Core Training Continuum.
This Core Training Continuum breaks down core training into the big rocks coaches need to consider when progressing athletes or selecting the most appropriate stimulus for the time of the year. Share on X

This breaks down core training into what I feel are the big rocks coaches need to consider when progressing athletes or selecting the most appropriate stimulus for the time of the year. It also provides guidelines on how to prescribe the volume and loading for each category to ensure the actual adaptation you are after is properly developed. The key categories I identified in regard to developing a well-rounded trunk consist of:

  1. Endurance – Static (long-duration submaximal holds)
  2. Endurance – Dynamic (high-repetition submaximal movements)
  3. Strength – Static (short-duration maximal holds)
  4. Strength – Dynamic (low-repetition maximal movements)
  5. Power (high rate of force development movements)

All five of these categories are further divided into four subcategories pertaining to the location of the torso being trained.

  1. Anterior trunk (trunk/hip flexion or anti-extension, prone or supine)
  2. Lateral trunk (lateral flexion or anti-lateral flexion)
  3. Posterior trunk (extension or anti-flexion)
  4. Rotational (rotation or anti-rotation)

Core Examples
Figure 2. Core Training Continuum—Exercise Examples.*

*Notes:

  • Strength – Dynamic – Posterior could be lumped into the hip extension movement category rather than a specific core training category.
  • Power – Lateral trunk would likely be too difficult to perform; the Rotational category would likely be sufficient.
  • Power – Anterior and Posterior trunk may be considered full-body power drills and not strictly a core training category.

Nearly all core exercises can be categorized under this framework to create a menu of possible training options when programming for specific athletes. This continuum can have applications in long-term athlete development, rehabilitation, or performance settings and be used to select individual exercises based on the needs of an athlete or to create core circuits targeting a specific quality in several torso locations.

The problem with making a training model like this too detailed or all-encompassing is that it becomes too rigid to work in the real world, says @CoachGies. Share on X

I made this framework as simple and straightforward as possible. The problem with making a training model like this too detailed or all-encompassing is that it becomes too rigid to work in the real world. Obviously, these guidelines can be broken in the right context, but these guidelines will be suitable for the majority of situations.

Is it perfect? No. But no training model is. The more coaches can implement similar types of frameworks for implementing core training, while using clear terminology on what they are doing, the more effective their training interventions will be.

Final Thoughts

Outliers aside, there doesn’t seem to be a widely accepted method for developing all facets of core function over the long term. Some facilities or coaches may have developed systems like this in isolation, but to move our industry forward, these ideas need to reach a broader audience, with more rigorous and long-term studies performed to improve our confidence in their worth.

The goal is that this article helps shine a light on some of the dilemmas surrounding our industry’s current assumptions on core training, as well as some of the underlying cognitive biases responsible. Finally, it’s my hope that the Core Training Continuum can help coaches develop their own framework for developing better core training programs.

The preceding article is based on Nick’s master’s thesis, “Current Perspectives around Core Stability Training in the Sports Performance Domain.” To read the full text, click here.

Since you’re here…
…we have a small favor to ask. More people are reading SimpliFaster than ever, and each week we bring you compelling content from coaches, sport scientists, and physiotherapists who are devoted to building better athletes. Please take a moment to share the articles on social media, engage the authors with questions and comments below, and link to articles when appropriate if you have a blog or participate on forums of related topics. — SF


References

1. Clark DR, Lambert MI, and Hunter AM. “Contemporary perspectives of core stability training for dynamic athletic performance: A survey of athletes, coaches, sports science and sports medicine practitioners.” Sports Medicine – Open. 2018;4(1):32.

2. Borghuis J, Hof AL, and Lemmink KAPM. “The Importance of Sensory-Motor Control in Providing Core Stability.” Sports Medicine. 2008;38(11):893–916.

3. Hibbs AE, Thompson KG, French D, Wrigley A, and Spears I. “Optimizing performance by improving core stability and core strength.” Sports Medicine. 2008;38(12):995–1008.

4. Wirth K, Hartmann H, Mickel C, Szilvas E, Keiner M, and Sander A. “Core Stability in Athletes: A Critical Analysis of Current Guidelines.” Sports Medicine. 2017;47(3);401–414.

5. Martuscello JM, Nuzzo JL, Ashley CD, Campbell BI, Orriola JJ, and Mayer JM. “Systematic review of core muscle activity during physical fitness exercises.” Journal of Strength and Conditioning Research/National Strength & Conditioning Association. 2013;27(6):1684–1698.

6. Silfies SP, Ebaugh D, Pontillo M, and Butowicz CM. “Critical review of the impact of core stability on upper extremity athletic injury and performance.” Brazilian Journal of Physical Therapy. 2015;19(5):360–368.

7. Saeterbakken AH. “Muscle activity, and the association between core strength, core endurance and core stability.” Journal of Novel Physiotherapy and Physical Rehabilitation.” 2015;2(2):028–034.

8. Chaudhari AMW, McKenzie CS, Pan X, and Oñate JA. “Lumbopelvic control and days missed because of injury in professional baseball pitchers.” The American Journal of Sports Medicine. 2014;42(11):2734–2740.

9. Prieske O, Muehlbauer T, and Granacher U. “The Role of Trunk Muscle Strength for Physical Fitness and Athletic Performance in Trained Individuals: A Systematic Review and Meta-Analysis.” Sports Medicine. 2016;46(3):401–419.

10. Waldhelm A and Li L. “Endurance tests are the most reliable core stability related measurements.” Journal of Sport and Health Science. 2012;1(2):121–128.

11. Shinkle J, Nesser TW, Demchak TJ, and McMannus DM. “Effect of core strength on the measure of power in the extremities.” Journal of Strength and Conditioning Research/National Strength & Conditioning Association. 2012;26(2):373–380.

12. Park J-H, Kim J-E, Yoo J-I, Kim Y-P, Kim E-H, and Seo T-B. “Comparison of maximum muscle strength and isokinetic knee and core muscle functions according to pedaling power difference of racing cyclist candidates.” Journal of Exercise Rehabilitation. 2019;15(3):401–406.

13. Raschner C, Platzer H-P, Patterson C, Werner I, Huber R, and Hildebrandt C. “The relationship between ACL injuries and physical fitness in young competitive ski racers: a 10-year longitudinal study.” British Journal of Sports Medicine. 2012;46(15):1065–1071.

14. Huxel Bliven KC and Anderson BE. “Core stability training for injury prevention.” Sports Health. 2013;5(6):514–522.

15. Lederman E. “The myth of core stability.” Journal of Bodywork and Movement Therapies. 2010;14(1):84–98.

16. Behm DG, Drinkwater EJ, Willardson JM, and Cowley PM. “The use of instability to train the core musculature.” Applied Physiology, Nutrition, and Metabolism. 2010;35(1):91–108.

17. McGill S. “Core Training: Evidence Translating to Better Performance and Injury Prevention.” Strength & Conditioning Journal. 2010;32(3):33.

Gainesville High School Building

Facility Finders: Gainesville High School

Blog| ByJohn Delf-Montgomery

Gainesville High School Building

The state of Georgia has joined the nationwide surge of high schools investing in strength and conditioning and their athletes. Gainesville High School is the first location in Georgia I have seen in this new era of high school strength and conditioning, and it will be tough to beat! This facility is overseen by Taylor Williams, Director of Strength and Conditioning, and Nate Mathis, Director of Optimal Performance/Wellness. The duo is implementing training for injury rehabilitation (Mathis) all the way to training the potential next Heisman trophy winner (Williams) for the Red Elephants.


Video 1. Virtual tour of the Gainesville High School weight room.

Garage Door Access
Image 1. The garage door access point from the new weight room to the field/track at Gainesville High School.

Design

Coach Williams—who was at Gainesville during the renovation of the 10,000-square-foot facility—mentioned there were a lot of things that needed to change with the new $1.5 million space. Before that, the space held 32 racks and felt very cramped, so they decided to switch to 28 racks to allow for a better flow and spacing for their room.

One unique element is the garage door addition for the program and the facility, which I love.

“One of the major renovations to this room consisted of adding two garage doors, which are functional,” Williams said. “This allows our athletes to quickly transition from being inside the weight room to continuing their training sessions outside on the track/turf field area.”

I have said this many times; space is king, and especially for a high school strength coach, it’s everything. Gainesville chose Rogers and Pendulum Strength equipment because of their knowledge of using Rogers football equipment. I think this was the first time I had ever heard that Rogers made weight room equipment—the logo is burned into my brain after years of pushing a five-man sled as an offensive lineman, so I was also surprised to see that same brand on incredible weight room equipment.

I think a “new generation” shift between coaches choosing a full, high-density flooring throughout the space over the wood overlay is something that will stay, and it really does allow for a sharp-looking room. The space has a large middle opening with seven double-sided racks on each side. Coach Williams has the room split up into three areas:

  • Lower body
  • Upper body
  • Explosive/plyometric area

Like many Division I football weight rooms, you see the adoption of the “pod rack method” here at Gainesville. The pod method creates an all-in-one-area training space for the athletes to come and complete the entire lift in that pod.

Power Racks
Image 2. A view of the racks and all of the attachments.

Purchasing

The hardest part of a weight room renovation project is deciding between all the best companies in the world to pick which one should outfit your place. The smallest detail can be what makes or breaks it for one company or another. The biggest decision-making factor for Gainesville was their familiarity with Rogers/Pendulum products, as well as the vision that the coaches needed to best outfit their athletes—small things like the bumper plates being suspended in a trough-type setup (instead of the traditional weight pegs) and the fact that the DC Blocks they bought can be stored under the racks to save space.

The hardest part of a weight room renovation project is deciding between all the best companies in the world to pick which one should outfit your place, says @johndelf99. Share on X

These are the tiny details that schools, facilities, and home gyms look for when purchasing, and I find it fascinating.

Another piece for Coach Williams was that the companies were trusted by places he trusted. “Their work speaks for itself,” Williams said. “Some of their best projects include Arkansas baseball and Michigan football.”

For all things sports science and wellness, Coach Mathis is in charge. The Gainesville weight room has it all, including:

  • Massive TV screens to help with the delivery of the program.
  • Perch VBT system for their racks to help track bar speed and bar path during lifting.
  • Catapult, which they use for GPS data during field sessions or practice.

Seeing a high school invest not only in the equipment but also in the two coaches heading this charge is truly impressive. I know I’m just the facility and equipment guy, but I also wanted to highlight how special these two coaches are in this whole process. I always find it interesting to look deeper at incredible facilities, but full-time leaders in those spaces are what makes the equipment really special.

“The technology helps drive decision-making to ensure our athletes are provided with training that fits their individual needs and is transferable to their sport,” Coach Mathis said when I asked him why they wanted to include all the sports science tools in this project instead of buying more benches, bars, bands, etc.

Open Space
Image 3. The open space splits the 14 racks into seven on each side of the room.

Specialty Equipment

What else can you add to a place that has already thought of everything?

Coach Williams mentions some cool extra pieces they bought to really take their training to the next level. These pieces include DC Blocks, safety bars, neutral bars, flywheels, and finally, the nutrition station. I like to include DC Blocks in the specialty category because of how versatile they can be, and as a strength coach, that’s what we demand. How many different ways can I use this piece of equipment? Coach Williams does just that with them, between step-ups, block cleans, and injury prevention tools.

The specialty bar category is near and dear to my heart because I am such an advocate for them, especially for special population athletes and injured folks. Safety bars can be beneficial for upper extremity injured athletes to be able to do more than just leg press all day, every day. The trap bar is a staple for me because of all the uses a coach can get out of it; most importantly, it’s the safest and best way mechanically to deadlift.

They also designed a cardio/rehab area in the weight room that the coach can use to service the recovering athletes before they are released back into the herd…of Red Elephants. Finally, a key “specialty” piece—especially at the high school level—is the awesome nutrition station (seen in the virtual tour video).

The nutrition station will be the differentiator for what makes the Gainesville H.S. facility probably a top 10 facility in the state, no matter the sector—high school, college, pro, or private. Share on X

This is another piece that Coach Mathis oversees, and it’s really going to be the differentiator for what makes the Gainesville High School facility probably a top 10 facility in the state, no matter the sector—high school, college, pro, or private. This has been the first facility in this series with a comprehensive station to fuel and refuel athletes pre/post practice or workout. Coach Mathis uses it to start the conversation about how nutrition is a lifelong skill that these athletes will be learning from 14 years old and on, which is really special.

Coaches
Image 4. The guys making use of this incredible facility (Coach Williams on the left and Coach Mathis on the right).

Coaches’ Tips

Coaches Williams and Mathis did a great job deciding on the pieces that would drive training at Gainesville High School for decades to come, not leaving a single rock unturned, from the flooring and space-saving decisions to the extra pieces and flair. I didn’t mention enough about branding for the place because of how much else was important—but they truly have their brand and culture installed with every new screw and bolt.

The last thoughts will be from both Coach Williams and Coach Mathis when asked about their tips for coaches looking for equipment.

“I would say establishing your goals for the renovation is the most important part,” Coach Williams replied. “Once those are set, then you can begin to reach out to the company that you would like to partner with for the project.”

“When deciding on technology equipment, it is important to consider the program that will be implemented,” Coach Mathis added. “We considered the exercise selection, grouping, transitioning, time, etc. The equipment needs to be user-friendly and easy to navigate for players and assistant coaches. We also looked for companies that provide not only reliable data but also relevant data that can be used to better program training for our athletes.”

Since you’re here…
…we have a small favor to ask. More people are reading SimpliFaster than ever, and each week we bring you compelling content from coaches, sport scientists, and physiotherapists who are devoted to building better athletes. Please take a moment to share the articles on social media, engage the authors with questions and comments below, and link to articles when appropriate if you have a blog or participate on forums of related topics. — SF


Women's Water Polo

Creating Pathways Beyond Sport with Christina Kouvousis

Freelap Friday Five| ByChristina Kouvousis, ByElisabeth Oehler

Women's Water Polo

Christina Kouvousis is the Head Coach at Water Polo West Provincial Training Centre and the Team BC programs. She is the Program Associate at the University of British Columbia Aquatic Centre and was previously the Head Coach of a grassroots program, Vancouver Vipers Water Polo Club, for nine years. Christina graduated from the University of British Columbia with a degree in kinesiology and a minor in psychology. She is an advocate for coach development, creating healthy sports environments, and empowering athlete and coach mental health to drive performance.

Freelap USA: As a water polo coach passionate about long-term athlete development, what are your principles for LTAD, and how would you describe your coaching philosophy?

Christina Kouvousis: My coaching philosophy is athlete-centered above all else. For me, coaching must always come from a place of empathy, respect, and patience. Prioritizing building trust and rapport with my athletes creates the foundation to begin working toward high performance and excellence in sport.

I always want my athletes to feel they can share what they are excited about, frustrated with, discouraged by, etc. It’s important for me to coach in a way that demonstrates I am there to help them achieve their goals and support them in and out of the pool.

I love the long-term athlete development model because it allows coaches to understand and embrace that athletes will grow and develop differently, especially youth athletes who are approaching or going through puberty. I think this is where patience is essential because keeping LTAD in mind leaves space for us to support athletes who might develop earlier or later compared to their peers.

It’s an excellent resource to refer to while coaching because it can help guide performance planning to meet the needs of athletes at each stage of the pathway, ideally prioritizing physical and mental health as they invest more into their sport.

Freelap USA: Water polo is a demanding sport that requires the players to tread water or swim for the duration of the match. What does an athletic development program for water polo players look like, and which physical qualities do you want S&C coaches to focus on in particular? 

Christina Kouvousis: Water polo is such a dynamic and demanding sport, using both aerobic and anaerobic systems and requiring athletes to constantly exert energy in the field of play. One paper broke it down to around 50%–60% of athletes’ energy is aerobic, 30%–35% is anaerobic, and 10%–15% is anaerobic-lactic pathways. As an athlete, I did not have much experience with an S&C or athlete development program outside of the pool, and this is something I’m working to change for the athletes I coach.

All athletes should build the knowledge of what their body and mind need to perform and recover and have the resources to explore what helps them be their best, says @chris_kouv. Share on X

All athletes should build the knowledge of what their body and mind need to perform and recover and have the resources to explore what helps them be their best. Outside of aerobic conditioning through swim sets or game-speed drills that focus on pushing athletes out of their cardio comfort zones to prepare for competition, I would love to see more water polo athletes build strength and prioritize mobility and recovery (especially to prevent injury). As a sport-specific coach, I’m still learning so much of this as I continue to dive deeper into the research on my sport!

Mobility in the shoulders, thoracic spine, hips, and ankles are all areas where athletes can improve their flexibility and range of motion and see an impact on something like their shooting performance in the pool and swimming strength/speed. Core strength is another area that can help athletes improve their shooting, as we generate a lot of power through the core and torso rotation while shooting and create stability while treading water and moving in all directions.

Some other keys are:

  • Exercises that help develop throwing power—and those that help athletes engage their entire body in the process—as athletes in the water don’t have the ground to draw stability from.
  • Strength programs that focus on protecting the shoulders, as overuse from swimming and throwing motions often leads to injury for many athletes.
  • Leg strength development is essential for creating a strong and stable eggbeater base that drives power and explosivity into shooting and jumping movements.
  • The ability to cover space effectively is huge in our sport, so helping athletes develop strength and power to move more explosively in the pool is tremendously helpful.

I have also always been curious about how improving grip strength can help athletes with throwing speed/release in their shots!

Freelap USA: You’re mainly a sports coach—what does a good relationship with an S&C coach in your sport look like?

Christina Kouvousis: When I was training, especially as a younger athlete, there wasn’t much discussion around S&C or working with S&C coaches, and that’s something I think should be prioritized for athletes across sports.

A good relationship with an S&C coach involves plenty of communication, collaboration, and a willingness to try something and adapt as necessary. I feel like one of the biggest obstacles in coaching can be ego, so the sooner we let go of needing to be right and collectively focus on finding the most effective systems for our athletes, we all win. That’s the way I envision an excellent relationship/environment between all coaches, S&C coaches, mental performance consultants, physical therapists, psychologists, etc. We all want to achieve the same goals and must recognize and respect the unique strengths and gifts we each bring to the table to make it happen. 

Freelap USA: You are involved in a project called the “Female Athlete Resilience Project.” Can you tell us about this undertaking and why you became a part of it?

Christina Kouvousis: The Female Athlete Resilience Project wasn’t something that I started; however, I did speak at the conference, and it was an incredible experience to connect with female high-performance athletes and discuss subjects critical to their development, well-being, and performance.

I spoke about the power dynamics that exist in sports, especially between coaches and athletes. This is a topic that I care about deeply, as it relates to athletes’ mental health and creating a safe environment for athletes. My goal was for athletes to recognize and understand the imbalance of power that exists between them and a coach to help them trust themselves if they feel that a coach’s behaviors have been harmful or inappropriate.

The goal of this area of my work is to help build confidence and the ability for athletes to trust themselves so that they can share what they need or speak up when things are not okay. My hope is that through more discussion and more coaches (or other sports staff) focusing on building trust and open communication with athletes, there may be more opportunities for athletes to speak up if something negative or harmful occurs.

Freelap USA: Another project of yours was the Junior Coach Development Program, which was created to encourage youth athletes to become involved in a leadership role within their community water polo club. What can coaches do to engage youth athletes beyond sports participation?

Christina Kouvousis: The Junior Coach Development Program was wonderful because it allowed us to work with athletes who are so enthusiastic about water polo and show them that they can be involved in sport in a different capacity—more importantly, using coaching as an opportunity to build leadership and interpersonal skills that are transferable to so many roles/careers. Providing opportunities or at least a pathway that shows athletes what they can do in their sport beyond participating as an athlete is huge. We know that not all athletes will reach high-performance or international competition levels, and too often, we lose many kids early on because they don’t feel as though they are one of the strongest kids in the pool.

Providing opportunities or at least a pathway that shows athletes what they can do in their sport beyond participating as an athlete is huge, says @chris_kouv. Share on X

The Junior Coach Development program really retained athletes in the club/team setting because it took the pressure off only having to be great as a player. Kids who knew they might not want to train or compete at a competitive level loved engaging in coaching and giving back to younger athletes.

I’m now working at the Provincial Sport Organization level in British Columbia, building a similar program for coaches and referees. The goal is to create a program that provides teaching and mentorship to help young people build competence in leadership, interpersonal skills, time management, planning, etc., to help them achieve their future goals! I see it as an opportunity to keep youth engaged in their own growth and development, which can certainly help them in their sport but will ultimately help them excel in life.

Since you’re here…
…we have a small favor to ask. More people are reading SimpliFaster than ever, and each week we bring you compelling content from coaches, sport scientists, and physiotherapists who are devoted to building better athletes. Please take a moment to share the articles on social media, engage the authors with questions and comments below, and link to articles when appropriate if you have a blog or participate on forums of related topics. — SF


Lacrosse FTC

Mistakes Lacrosse Coaches Make During Conditioning

Blog| ByBrennan Sweeney

Lacrosse FTC

If only coaches knew how much damage they were doing by lining up their athletes to run as a consequence for poor performance. I’ve played my fair share of lacrosse, and nothing tightened up a group more than when a coach gripped his whistle a little too tightly, launching into a soapbox memoir about being the most conditioned team. Echoes of Miracle on Ice would ring throughout the practice field as we were pushed to the furthest extent of human aerobic capacity.

The worst part was…I don’t think any of those hardcore sessions made a difference in a final score in my high school and college career. Most old school sport coaches end up using various workouts they’ve found online, or their metric for a good conditioning workout was how many kids ended up neck deep in a trash can.

I don’t think any of those hardcore sessions made a difference in a final score in my high school and college career, says @Coachbsweeney. Share on X

The best college coaches that have a well-balanced strength and conditioning program and the best high schools that host a recruiting class full of multi-sport athletes have found what truly makes a difference in the sport: speed.

Lacrosse Speed

I played college lacrosse for five years (COVID year for super senior) and I was never the fastest player on the field. As an attackman, you can become crafty and still be very successful; but now that I’ve begun working with a nationally respected track program, damn do I regret not taking speed training far more seriously. I, much like many other victims, thought quick feet and impressive weight room numbers would propel me to an unprecedented lacrosse season and help me achieve any goal that I set.

Now, I didn’t have a horrible career in college—my twin and I were fourth and fifth in the country in scoring before the season was shut down. But in terms of being effective on the field and what a proper sprint program could have provided for myself and my team along the way, we could’ve done a lot better.

When Skill Levels, Speed Wins

In large part, lacrosse is a game of fine skill and lesser teams often fall prey to opponents that are not only faster, but much higher in skill. This is where I think the difference in the final score lies.

Lacrosse is a game of fine skill and lesser teams often fall prey to opponents that are not only faster, but much higher in skill, says @Coachbsweeney. Share on X

Once you get up to a high level of college lacrosse, skill is almost always equal. It could come down to something as simple as the team with a more dominant faceoff man getting more opportunities and outlasting their opponent. So, how do we raise the level of play without overhauling the skills component and blaming the coaches for kids not being good enough at the sport?

We raise the overall speed of the program.

A big reason a team may be wrung out over the course of a game is not just because an opponent is better; but because these athletes have an innate ability to make faster decisions, read and complete a schematic representation of an oncoming play, and utilize less energy.

Techno-Tactical Model for Lacrosse

  • Attackman: Dodge, get open, ride, create contact
    • Major KPI: Acceleration, COD testing, strength, problem solving
  • Midfield: Highest run volume, dodge, clear the ball, defend
    • Major KPI: Short- to mid-distance sprints, aerobic capacity, strength
  • Defense: Provide coverage, clear the ball, ground ball, withhold and create contact
    • Major KPI: Strength, reactive COD, short sprints
  • Goalie: Fast decision-making, clear the ball
    • Major KPI: Hand-eye coordination, hand speed, general aerobic shape, explosiveness, reaction time
  • Defensive midfield: Coverage, clear the ball, push transition, big ground ball emphasis
    • Major KPI: Repeat sprint, strength, COD, IQ, power
  • LSM: Defend dodgers, clear the ball, push transition, big ground ball emphasis
    • Major KPI: Combo of defender and defensive mid
  • Faceoff: Get out quick from low positions, use physicality, ground balls, transition
    • Major KPI: Explosive, strongest position, mental strength, short fast bouts

So, given all of this, what’s the solution?

The rapidly growing phenomenon of Tony Holler’s Feed the Cats has been introduced into lacrosse and has made a great impact on how coaches see the game. It’s essentially microdosing sprint volume in a digestible format where coaches can fit sprint training into warm-ups and solve everybody’s issues of getting faster and getting “conditioned.”

It’s essentially microdosing sprint volume in a digestible format, says @Coachbsweeney. Share on X

The old school coach is under the impression that running ten 300-yard gassers (totaling 3,000 yards of low intensity sprinting) or several mile runs (another way to build a submaximal aerobic base) will fully prepare their players to outrun the opponent in a given game. Sadly, the players walk away disgruntled more often than not, assuming the coach is just out to get them with this absurd amount of volume that just adds to the wear and tear of the season. It may surprise some folks to find out you can sprint a total of 100 to 400 yards with maximal rest and improve both sprint speed and repeat sprint ability, all while increasing player morale!

Practical Applications

You can split this up into a high speed 40- to 50-yard competition workout or keep it short and high rep with a 10×10 workout (which I’ll detail fully later). The issue is that kids don’t know how to pace themselves, and during these shuttle workouts, they destroy themselves on the first rep and become way too tired to reach a high enough velocity to elicit change on any of the other sprints. Or you have the savvy veteran who sandbags the first couple sprints, only to show effort on the last. Now, if you want to build up a bigger endurance base before the season starts, I recommend using drills as conditioning with little rest in between or starting off with 1,000 yards in a given day and then slowly building up throughout the season to an actual game load.

When I look at a general practice plan, I start by evaluating the daily running volume. It doesn’t have to be exact, but I’m trying to figure out if the kids are running a lot, a little, or if they’re just standing around. You can then look at your book of drills and categorize those into high running drills or low running drills.

When I look at a general practice plan, I start by evaluating the daily running volume, says @Coachbsweeney. Share on X

The last—and most important—piece is splitting up your week between high days and low days. On the high days, it makes sense to do more full field work and have a focus on longer sprints during warm-ups in a 10- to 20-minute block. Even providing your athletes with three to five 30- to 50-yard sprints with three to five minutes in between would be enough to elicit a speed adaptation, as long as the sprints are at true max velocity. This accomplishes the goal of sprinting the players when they’re at their freshest and building a good relationship with coaches regarding the importance of sprinting.

The low days can be focused more on small-sided games and tons of skill work. The velocities are lower during these days, so using acceleration as the basis combined with COD complexes that are close to the drills you’re doing that day should be the focus of the plan. Throughout the week, the players will be refreshed and recovered because the running volume is giving their bodies a chance to compensate and replenish over-utilized energy sources.

My main advice is to start sprinting early and often. I promise there’s benefit in terms of injury rates and speed development with proper sprint training, and kids will genuinely enjoy watching themselves get faster and having time come off the clock.

My main advice is to start sprinting early and often, says @Coachbsweeney. Share on X


Video 1. Reactive speed and agility games.

In the off season, I love running Derek Hanson’s 10×10 plan, building up acceleration volume and then slowly building up total volume and vertical forces as the season advances:

  • Take a 10×10 box, set your kids up in a line, have them sprint the 10-yard length then walk the 10-yard width.
  • Repeat this process until you get to 10 reps, then you can rest for three to four minutes in between before you repeat the drill.

Take away meaningless conditioning tests and recreate game-like environments in drills and practice, and use that as your conditioning. You can also build up the volumes and reps in those drills and, look at that, your players are working on skills as well as practicing skill development. Lastly, make running a fun game and play around with how to make the kids become competitive with it.

Make running a fun game and play around with how to make the kids become competitive with it, says @Coachbsweeney. Share on X

When my athletes are given a small-sided game like “trash can ball” or different games I come up with, they have a ton of fun and still walk away out of breath…but actually wanting to play more. Even if you run sprints, time them, and decide on a winning person/team, players light up and start to really buy into the process and the progress. In the end, they’ll further their buy-in and you will finally achieve your goal of kids not walking through the conditioning, but looking forward to it.

Since you’re here…
…we have a small favor to ask. More people are reading SimpliFaster than ever, and each week we bring you compelling content from coaches, sport scientists, and physiotherapists who are devoted to building better athletes. Please take a moment to share the articles on social media, engage the authors with questions and comments below, and link to articles when appropriate if you have a blog or participate on forums of related topics. — SF


Baseball Velo

Strength Velocity Training for Baseball

Blog| ByDrew Hill

Baseball Velo

September 7, 1974 —It was a warm late-summer day in Anaheim, California, and the Angels were playing the Chicago White Sox. A young pitcher, Nolan Ryan, toed the mound. Wiping the sweat from his brow, he nodded for the fastball and began his windup. In the blink of an eye, the ball left Ryan’s hand and thwacked into the catcher’s glove—the world’s first recorded 100-mph pitch.

Thirty-six years later, in 2010, Aroldis Chapman blew the hats off of spectators when he launched a pitch clocked at 105.1 mph—the fastest recorded in the modern era. Over the past 13 years, the speed of the average pitch has gone up by more than 3 mph. Although that may not seem like much to the average person, it is a remarkable feat at the MLB level. Spectators might show up for overpriced hot dogs and concessions, but they stay for the speed—and the athletes have noticed.

This made me concoct a theory—not about hot dogs, but about the potential to add pitching speed to a ball player in the pre-season. If the game is faster than ever, how do I fill in each player’s gaps to help them keep up? Or, in other words, can I make fast athletes stronger, strong athletes faster, and once balanced, improve both instead of only focusing on one quality?

What We Did

Every pre-season in our facility, we host dozens of high school and college baseball players looking to improve their mound performance. Our program has always had fantastic results, but I wanted to quantify the most valuable KPI (key performance indicator) to any baseball player—mph. I’ve had this theory on how to get the most speed out of each athlete for years, but I finally invested the resources to test my hypothesis.

I’ve had this theory on how to get the most speed out of each baseball player’s throw for years, but I finally invested the resources to test my hypothesis, says @endunamoo_sc. Share on X

To do this, we hard-mounted a Pocket Radar and a tablet and regularly tracked throwing velocities. If I was correct, then focusing on the differences and deficits of each athlete would yield better results than a standard pre-season program. Within 12 weeks, most of our players were throwing 5.2 mph faster.

How did we do it?

Aside from traditional strength and power training, our program evaluated each player based on two attributes (strength-speed and velocity), categorized them, and then modified their training. Not all athletes start with the same biases and deficits, and once we understood those gaps, we were able to break some plateaus and get some results. To capture the deficits within our population, we implemented two tests and created a ratio score based on these:

    1. Three-step kickback medball shotput. This was how we evaluated the strength-speed of each athlete. By implementing a familiar load that was much heavier than a baseball, we could capture peak power that was more force than velocity. Athletes who were high performers in the weight room or on non/low countermovement actions excelled at this.


  1. Three-step kickback baseball throw. This test leaned more toward the velocity side of performance and gave us a glimpse at the number everyone truly cared about. Having a low medball shotput speed did not mean that there would be an equally low throw speed. Athletes who struggled in the weight room but excelled in aspects like jumps or sprints had higher-than-expected throw velocities.
Speed Wall
Image 1. Our speed wall was another way to get the most out of each athlete. If they broke a milestone, they got to autograph the sign.

Once both metrics were collected, we created a ratio and used group means to determine the “ideal” score—which we called a speed-strength ratio (SSR). We had a group of players who’d been in our program for several years and were multi-year varsity and/or college players—we will call them the “Goon-Gang” (IFYKYK)—who all shared an SSR within 0.2 of each other, regardless of their baseball or shotput throw speeds. Some were higher performers than others, but they were all at the top of our competitive food chain. It was like the Red Sea parted, and the optimal ratio was right there in front of me.

Medball Shotput
Image 2. The medball shotput throw was a huge eye-opener for most athletes.

Once I had that goal ratio in sight to get our athletes to reach, we got to work on modifying sessions to build their deficits before strengthening their strengths. Before we can dive into the fun and practical side of this approach, however, we have to get our reading glasses on and pencils out and start doing some graphing.

Once I had the goal speed-strength ratio in sight to get our athletes to reach, we got to work on modifying sessions to build their deficits before strengthening their strengths, says @endunamoo_sc. Share on X

Force-Velocity Curve Remodeled

The force-velocity curve is one of the first things taught to aspiring strength coaches. In most textbooks, this is a simple curve with a 1:1 relationship between force (F) and velocity (V). This chart would suggest that as force increases, velocity must decrease (and vice versa). It would be nice if the entire universe followed black-and-white rules like this, but as in many cases, the truth has more gray to it.

Force Velocity
Figure 1. This is the standard FV curve you will find in a textbook.

If you asked most baseball coaches which is harder, adding pitching velocity or improving a deadlift, they would say the former. That being said, an increase in absolute strength will sometimes lead to an increase in velocity (up to an extent). This means that getting stronger increases the length of the curve while also increasing the speed (V) at which we can move certain loads (F). This is because athletes are not uniform in nature but can use greater stretch loads from the stretch-shortening cycle to throw even harder.

If we were robots, the FV curve would make complete sense, but since our body is designed to utilize the kinetic chain, we can generate high levels of force without losing velocity (at least for a little bit). During advanced movements, the entire body acts like links in a chain, transferring the force generated by one link to the following link while amplifying it through its own additional segmented forces. By improving the efficiency of transfer or the strength of links, we can maximize performance! Humans have a very complex fascial system that we have used since the beginning of human movement to throw, jump, and run faster. Many vertebrates also share these characteristics, but it’s not a universal superpower seen in the animal kingdom.

If we were robots, the FV curve would make sense, but our body is designed to utilize the kinetic chain, so we can generate high levels of force without losing velocity (at least for a little bit. Share on X

Full-grown chimpanzees are 1.5–2 times stronger per pound of body weight than humans, but the average chimp can only throw a ball at 30 mph…which would be impressive if it was faster than the average prepubescent 11-year-old could throw. Meanwhile, the Goon-Gang all have mound velocities between 85 mph and 90+ mph. They might lose to a chimp in a deadlift competition, but that monkey can’t keep up when it comes to arm speed.

Force Velocity Realistic
Figure 2. Due to the stretch-shortening cycle, titan filament, and fascial system, many trained individuals can maintain more velocity at higher loads than the original graph would suggest.

The complexity doesn’t stop there. We should also consider adding a second parabola to the Force Velocity chart demonstrating how power plays into all of this. If you can reach back in your mind to the last time you ran a physics calculation, you might remember that Power (P) = Force (F) * Velocity (V). Increasing peak power in athletes is associated with many other performance benefits. As a coach, we can target when force and velocity are at their peak, creating the sweet spot for power training. Although this will vary between athletes, most research suggests traditional strength exercises have peak power at 70%–80% 1RM, whereas their plyometric/ballistic counterparts peak at 35%–45% 1RM.

Peak Power
Figure 3. It’s important to note that power is a key focus of training for any athlete.

Now that we understand the complex relationship humans have with load, speed, and power and how we can uniquely use the SSC and fascial network to maximize the speed at heavier loads, we should be able to get everyone throwing 100+ mph, right?

Probably not—but at least we can try. Not everyone has the same genetic makeup, which means they come with their own predispositions, deficits, and potential. To get the most out of everyone, we have to figure out their FV curve and then go from there. Easier said than done, though, right?

Determine Whether Your Athlete Is a Rhino, Cheetah, or Tiger

There are many ways to describe an athlete’s “natural” type, and once you determine their strengths and weaknesses, you can build a program to fix their weaknesses and take advantage of their strengths. In the deep off-season, we want to address the gaps in an athlete’s portfolio, but once it’s game time, we should be peaking their strengths.

The simplest way to peak a player’s strengths without an SSR is to determine which of these three categories they fall into: endomorphs, mesomorphs, or ectomorphs, says @endunamoo_sc. Share on X

You don’t need an SSR to start doing this with your athletes (though it does help). There are many ways to do this, with some being more “science-heavy” than others. To start at the simplest option, you can look at a player and determine which of these three categories they fall into. Endomorphs are heavier set and more strength dominant (think shot-putter). Mesomorphs are lean but muscular, with a balanced athletic ability (think football running back). Ectomorphs are naturally skinny and do well in more dynamic situations (think basketball players).

Human Body Types
Figure 4. The eyeball test may not be the most “scientific,” but it can do a lot to get things started.

If you’re like me, you might find this style of assessment underwhelming. The next step in the evaluation is to determine whether they are eccentrically or concentrically dominant. Another way to look at this evaluation is to say whether they move elastically or muscularly. Athletes who are more eccentric-elastic (EE) can generate more power from dynamic movements, while concentric-muscular (CM) athletes can produce large force with little assistance. Between these two groups are the muscular-elastic (ME), who have a balance of concentric abilities but still can produce large amounts of power with additional eccentric load.

There are many ways to evaluate each athlete within your group. For example, you could compare a standard countermovement vertical jump with a more dynamic approach jump. More EE athletes will see 15%–20%+ differences between the two, while more CM will have a 0–10% difference. You will also find that a CM will have better 10-yard to 40-yard ratios compared to an EE. It’s not uncommon for a CM to have a comparable or even better 0–10-yard time than an EE. It’s also not uncommon for a CM to struggle with seeing their times improve between 20–30 and 30–40, whereas an EE will have significant changes at those distances.

For our purposes, we looked at the difference between the 4-pound shotput throw and the standard plyo baseball throw. Those with a smaller difference were dubbed CM, while those with a much greater difference were EE. Our goal was to get everyone to a standard difference (working on their gaps) while still improving them in total (peaking their strengths).

Abilities
Figure 5. The next step is to evaluate each athlete and categorize them based on general performance metrics.

If all else fails, you can put on your safari hat and decide what kind of animal your athletes are. Are they like a rhino (strong and powerful in short distances)? Are they a tiger (explosive and strong without being too heavy)? Or are they a cheetah (lean and fast with bouncy movements)?

Let’s look at our Goon-Gang for an example. Although they were all built differently (heights ranging from 5’6” to 6’4”), they moved similarly. They had creative, explosive abilities from both static and dynamic situations while also being some of the strongest per-pound-of-bodyweight athletes in the weight room. None of them moved heavy but lacked bounce like a rhino, nor did they move weakly but quickly like a cheetah. They were all tigers—strong and powerful, with a pop when needed.

Athlete Animals
Figure 6. At the least, you can compare how each athlete moves to animals.

How We Built Velocity Regardless of the Athlete’s “Type”

Now that we’ve made it through the “boring” logistics, we can get to practical application. For starters, we still worked on building strength (unilaterally and bilaterally), and everyone sprinted weekly and hammered rotational movement qualities as a group—after that, however, things got a bit squirrelly.

Each session included medball throws to some degree and lower/upper plyometrics as a supplement. To work on weaknesses at the beginning of the season, we created a few rules. Those who were CM used 2–4-pound medballs exclusively, and most of their throws included a greater dynamic effect: steps, wind-ups, catches, etc. Likewise, they performed fewer static plyometrics and sprinted longer distances throughout the program. Those who were EE were forced to use 6–8-pound medballs exclusively from more static positions: full kneeling, half kneeling, standing, etc. When they performed plyometrics, we focused on non/low countermovement jumps, and they trained at a higher intensity in the weight room—2.5% to 5% 1RM heavier each session.

Medball Overhead
Image 3. Throwing medballs of different weights from different positions was one of the primary ways we manipulated training between different athlete types.

The Goon-Gang had a more diverse training experience throughout the pre-season. They were able to use weighted throws of 2 to 8 pounds while also performing movements and throws from both static and more dynamic approaches. Not to waste a good Pocket Radar, we also recorded rep by rep to get every drop out of these guys each session.

And it worked.

Those with the greatest increases in pitch velocity resolidified my original theory—make fast athletes strong and strong athletes fast, and once balanced, improve both, says @endunamoo_sc. Share on X

Lifetime throw PRs were seen from every rhino, cheetah, and tiger in the group. Those who went from EE or CM to more ME had the greatest increases in pitch velocity, which resolidified my original theory—making fast athletes strong and strong athletes fast, and once balanced, improving both was the way to go.

Weighted Balls
Image 4. Incorporating throws at different weights was another way we could manipulate training based on athlete type.

The Perfect Balance

Every sport has its unique landmark of athletic success. For gym bros, it’s the answer to the question, how much can you bench? For basketball, it’s can you dunk? And even if they’ll never be able to bring it over triple digits like Nolan Ryan or Aroldis Chapman, for baseball pitchers, it’s can you top 90 mph?

Working in the private sector, I get approached by a lot of baseball parents and athletes asking how to improve their pitching velocity. I have a personal rule to stay in my own lane when it comes to my profession: I am in no way a pitching coach, so modifying their technique is out of the question. What my resume does have on it, however, are a few degrees, certifications, and studies I’ve gotten in sports performance and exercise physiology. And despite my limitations, we added an average of 5.2 mph to our group’s pitching velocities.

Establishing which animals we were working with was the key to getting those gains. The entire performance community has accepted barbell velocity-based training as a great tool for building “athletic” strength. It’s only time we get beyond the weight room and onto the field with this science.

The entire performance community has accepted barbell VBT as a great tool to build “athletic” strength. It’s only time we get beyond the weight room and onto the field with this science. Share on X

It is no longer the gold standard to track the speed of movement but rather to determine which athlete needs more speed, more strength, or the right amount of both. This can be done with a radar, as we did. This can also be done by comparing non-countermovement jumps to more dynamic jumps. And this can be done by comparing 10-yard split and 40-yard split times. The list goes on of ways to evaluate CM- and EE-dominant athletes.

Ultimately, it is up to what you have available at your disposal. And, one day, you might find yourself eating that overpriced hot dog in a ballpark somewhere in America as you watch one of your kids throwing gas on the big stage.

Since you’re here…
…we have a small favor to ask. More people are reading SimpliFaster than ever, and each week we bring you compelling content from coaches, sport scientists, and physiotherapists who are devoted to building better athletes. Please take a moment to share the articles on social media, engage the authors with questions and comments below, and link to articles when appropriate if you have a blog or participate on forums of related topics. — SF

Athlete Sprint

Maintaining Clarity and Consistency in a Training Program with Paul Pearce

Freelap Friday Five| ByPaul Pearce, ByDavid Maris

Athlete Sprint

Paul Pearce is a sprints coach aligned with the Queensland Academy of Sport in Brisbane, Australia, while also working as Athlete Development Manager at Brisbane Girls Grammar School. He represented Australia in 100m, 200m, 400m, and relays from World Juniors to World Championship events. Paul has previously held the Australian National Junior Coaching Coordinator role, working with the country’s best emerging athletes and their coaches. He has also had national coaching roles as the Australian WU20 Head Coach, Commonwealth Games Team Sprints coach, and Australian 4x100m and 4x400m coach at World Relays.

Paul is very passionate about collaborative coaching and sharing ideas. Training philosophies include coaching the athlete you have in front of you, not over-complicating it, and getting the basics right consistently.

Freelap USA: Australian sprinting seems to have become a lot more competitive over the past few years on both the men’s and women’s sides. Do you have any theories as to why that might be the case?

Paul Pearce: I think over the last three or four years, Australian 100m and 200m sprinting has had somewhat of a renaissance, with some hungry young sprinters coming through. The reasons for this are multifactorial.

First, there are some great young coaches in Australia, and the approach toward developing our athletes has been very collaborative. During the pandemic, a lot of the coaches came together in a Zoom group, and we connected regularly and discussed a variety of topics. Sometimes it was hugely analytical and trying to find solutions to challenges we were having with our athletes; other times, it was simply a case of checking in with each other and seeing how everyone was doing.

In 2012, Sally Pearson won the 100m hurdles at the London Olympics—many of the athletes who are having success now were in the 12–16 age range when that happened, and I think would likely have drawn inspiration from seeing this and the buzz it created in Australia. Added to that, we had a home Commonwealth Games on the Gold Coast in 2018, which also generated a lot of media attention and popularized athletics. That year, Riley Day won the national 100m and 200m titles as an 18-year-old, and Rohan Browning made the Commonwealth team. I think that because these athletes were so young at the time, it made their performances very relatable to their peers (more so than would have been the case if Riley and Rohan were 30 years old, for example).

This fostered a very competitive environment in Australia, where a lot of young sprinters were pushing each other regularly in domestic competitions and challenging each other to make teams to represent Australia. We have another Commonwealth Games coming up in Victoria in 2026, followed by the Olympics in Brisbane in 2032, so I think it’s an exciting prospect that the recent momentum we have will continue over the next few years.

Finally, having Fred Kerley out in Australia recently has been very exciting and, again, built a lot of interest from the media. As an athlete myself, I remember Linford Christie and Colin Jackson being out in Australia, the inspiration I drew from that, and the way it helped bridge the gap between the top Australian athletes and the world scene. I hope and believe that having the likes of Fred here this season can do the same thing for this generation of Australian sprinters.

Freelap USA: Riley had a sensational 2021 season and started 2022 in a promising fashion before, unfortunately, encountering an injury issue. Were there any qualities/indicators that improved significantly heading into that season compared with previous years? Was this due to anything that you and Riley did differently in training, or was it more due to an accumulation of training and being cognizant of her natural development, with her having turned 21 only a few months before Tokyo? 

Paul Pearce: One of the most important factors in training is consistency. Generally, when I have had athletes perform well, they have been able to train consistently for months at a time without injury niggles and time away from the track, both of which I think are probably the biggest killers to athletes running fast and reaching their goals.

I think my training reflects the extent to which I value consistency, as what I have athletes do on the track doesn’t change too much from year to year; for that to be the case, I try to keep my training very simple. A personal motto of mine is: keep it simple. It’s very important to have it clear in your own mind as a coach what you believe the fundamentals to successful performance are and make sure you never get too far away from that with your athletes.

This being the case, I think social media can be a double-edged sword because, while it allows you to connect with other great coaches and learn about what other athletes and coaches are doing, it also means there’s a lot of “noise” that can be challenging to filter through—and too many external influences can muddle the message that you receive as a coach, which then gets passed on to the athlete.

It’s worth noting that the athlete can also become confused by what they see on social media, so it really is important that, as coaches, we provide them with clarity. A clear, concise coaching message is essential.

An athlete can become confused by what they see on social media, so it’s really important that we provide them with clarity. A clear, concise coaching message is essential, says @paulcoachpearce. Share on X

I think the majority of athletes can only think about one or two things at a time while they’re sprinting—and at times, I can be guilty of giving too many verbal cues—but luckily, I have an athlete, Georgia Harris, who will tell me when I’m speaking too much! I try to consider, therefore, what training interventions will provide the athletes with the biggest bang for their buck and focus my time on really hammering home those messages.

Social media may be able to enhance the message you’re sending to your athletes, but I think it’s really important to consider where this information fits. If it allows you to make subtle adjustments to the training you provide your athletes with—because once large overhauls start taking place, the consistency I just mentioned becomes jeopardized.

This all being said, I think our consistency was displayed when Riley ran 22.56 in Tokyo, and various factors fed into her being able to be as consistent as she was. Up here in Brisbane, the weather is rarely a constraint to what we want to do. It’s pretty warm all year round, so we can train as we would like without much concern for the cold, etc.

While some parts of Australia were hit pretty hard by the pandemic, and the associated restrictions caused lots of limitations, Brisbane was not as badly affected. We had a couple of two-week or so periods when we had to train at home, but outside of that, we could get to the track and train pretty much as usual.

This meant that by the time we got to Cairns prior to departing for Tokyo, Riley’s speed was the best I’d ever seen from her. Her power and strength were at all-time highs, as were her plyometrics and her range and flexibility. So, everything came together, and all the major boxes were ticked, culminating in her being in great shape and performing as she did. One of the last sessions I witnessed in the Olympic holding camp had her running so fast that I genuinely thought she’d have broken the national 100m record if she had raced that day.


Freelap USA: Do you do much in the way of testing in your training program?

Paul Pearce: It’s really important to have a good understanding of why a test is being implemented, and I like the athletes to be clear on this as well. If I had to guess, I would say I probably incorporate fewer tests into my training plan than many other coaches because I need to be very clear about the benefit of the testing before I’m willing to implement it.

We do things like flying runs as a part of the training process. These are often timed, so they provide me with data and insight on whether training is progressing in the right direction. In that sense, testing is largely woven into the training process and used to guide my decision-making. That being said, out of season, we may do standalone “testing” sessions that are geared toward replicating a racing environment. They also provide me with data and information to assess how training is going and allow me to decide if any interventions are required and, if so, what they may be.

We are also lucky enough to have access to a biomechanist and a laser to give us data regarding instantaneous velocities, which has provided some great quality feedback. This tracking highlighted that a decathlete of mine, Dan Golubovic, has a little “flat patch” at the same point in an acceleration where the first hurdle would be in the 110m hurdles. We have therefore been able to identify an area to target development that may benefit his flat events, such as the 100m and 400m, and his long jump.

Freelap USA: What are some of the key technical positions you look for with your sprinters? What are some of the strategies you use to encourage athletes to hit these positions?

Paul Pearce: Positions are a big focus of mine, but it’s important to recognize that some degree of mobility and/or strength may be required to hit some positions, so cueing may only work to a certain extent.

It’s important to recognize that some degree of mobility and/or strength may be required to hit some positions, so cueing may only work to a certain extent, says @paulcoachpearce. Share on X

One of the positions and concepts I look for with my athletes is having the swing leg knee at least level with the stance knee at ground contact. I also want to see a broad chest during acceleration, as opposed to a rounded back.

Sprinting is about lines of posture; related to this, I’m always looking for a straight line from the feet through the hips, shoulders, and head. The posture remains the same in maximum velocity; it’s merely the angle at which that posture is oriented with respect to the ground that changes.

When transitioning from an acceleration position to maximum velocity, the adjustments should be so subtle and gradual that I barely notice them taking place—and there’s often the analogy used that it’s like a plane taking off and gradually going up, as opposed to a helicopter or a rocket, which takes off vertically. Should there be any breaking of this position or anything that impacts this long posture—such as bending at the waist—then the force applied will be suboptimal, meaning that a lot of the strength training and plyometric training that we’ve done will be far less effective than it otherwise could have been.

Finally, I look for ground contacts to be as close to underneath the center of mass as possible and behind it during early acceleration to avoid unnecessarily large braking forces. It is important to recognize that not all athletes will hit a conceptual, technical model. Therefore, I cannot be too rigid regarding what I want or expect to see, and I need to cater to the nuances and idiosyncrasies of the athletes. Without this flexibility, a lot of time and energy may be wasted trying to get them to meet positions that, realistically, they will never be able to find.

To teach these positions to my athletes, I typically start by getting them to watch good and bad examples and asking them what they notice. This achieves two things:

  1. It gives them a visual reference.
  2. It empowers them and involves them in the learning process.

From there, I try to give them the opportunity to connect a feeling with that visual reference, and I actually believe there’s value here in performing a skill badly, so they know what a poor execution feels like and are, therefore, better able to independently assess whether or not they’ve performed that skill well. After this point, it’s obviously a good idea to guide them away from what they’ve just felt to a more successful execution.

While I see value in visual feedback, it’s possible to be too reliant on it when it can be immediate, thanks to smartphones. Athletes must be able to feel what a good rep is, says @paulcoachpearce. Share on X

While I’ve mentioned that I see value in visual feedback, I think it’s possible to be too reliant on this, especially today, when the feedback can be immediate, thanks to smartphones. It’s very important for the athletes to be able to feel what a good rep is, as again, they can better assess whether or not they have executed a skill well, and this gives them some further ownership of the learning process.

Freelap USA: What does a typical training week look like for Riley?

Paul Pearce: My training doesn’t change a great deal throughout the year, and all training elements are present each fortnight: such as acceleration, maximum velocity, speed endurance, and the related technical components. I use a lot of contrast work, like resisted sprinting with unresisted accelerations and mini hurdle work or weighted vest work with maximum speed runs.

My 100m and 200m runners do the majority of their work at intensities above 90% or 95% and rarely run beyond 150 meters in a repetition. I don’t tend to prescribe longer runs to avoid mechanical breakdown and the stress this may place on their hamstrings and other tissues, which may increase the injury risk.

I’m also an advocate of quality over quantity. So, for example, I’d much rather have my athletes complete three near-perfect sets instead of a fourth set where the quality of execution is subpar, and I see their hips dragging along the ground and their contact times going through the roof in a bad way.

    Sunday – Off

    Monday – Rhythm/tempo runs. 8x80m on the grass at around 75% intensity, with about 4–5 minutes of recovery, but I give the athletes a good degree of autonomy during these recovery periods.

    The intent of this session is to get the body ready and prepped for the week ahead. How has the body pulled up after a big session on Saturday? What possible physio work needs to be done prior to a fast session on Tuesday? I don’t want to turn up Tuesday and not be prepared.

    Gym.

    Tuesday – Maximum velocity day. I often contrast 4–5 sets of a technical component, such as mini hurdle runs, progressive ankling, banded runs to promote toe-off and quicker heel recovery (video below), or runs with a weighted vest to help emphasize vertical projection, with something like a 40-meter build-up plus a 30-meter fly at above 95% intensity. The athletes rest 8–10 minutes between sets and 3–4 minutes between the technical element and the flys.

    Wednesday – Gym.

    Thursday – Acceleration day. Similar to Tuesday, this may be a complex. For example, using the 1080 Sprint, 3–4 sets of high resistance pull to 20m, medium resistance pull to 30m, and unresisted acceleration to 40m.

    Friday – Gym.

    Saturday – Speed endurance. Four to five sets of 120m, 30 seconds, 80m, or 4–5 sets of 80m, turn around, 80m, turn around, 80m. The athletes take 8–10 minutes of recovery between each set.

As with all planning, you need to adapt sessions and stimulus to what you saw in the previous training days, as well as how each athlete moves in their warm-ups.

Since you’re here…
…we have a small favor to ask. More people are reading SimpliFaster than ever, and each week we bring you compelling content from coaches, sport scientists, and physiotherapists who are devoted to building better athletes. Please take a moment to share the articles on social media, engage the authors with questions and comments below, and link to articles when appropriate if you have a blog or participate on forums of related topics. — SF


NFL Combine

Tracking Athletes Through the NFL Combine Training Experience

Blog| BySteve Haggerty

NFL Combine

The NFL Combine is the most notable combine for professional athletes when compared to the NBA, MLB, and NHL. As soon as the Super Bowl concludes in mid-February, this is the event all football fans look forward to. For the players participating, the NFL Combine is a weeklong experience filled with meetings, interviews, medical evaluations, and on-the-field drills and performance testing. The performance testing includes the 5-10-5 and three-cone drills to assess change of direction, the broad and vertical jumps to evaluate lower body power, the 225 bench press test for upper body strength/strength endurance, and everyone’s favorite: the 40-yard dash to measure speed.

We will dive into what the training is like in this process at Bommarito Performance Systems (BPS)—one of the premier training facilities for this process, led by Pete Bommarito. This past year was my fourth year assisting Pete with NFL Combine prep. I will look more specifically at one unidentified wide receiver (athlete E) who trained with us during this process and his results at the Combine.

I chose this athlete because he did a great job recording his weight on every set and rep in the weight room, never had any significant injuries that altered his training, and participated in the three major performance tests I wanted to discuss. (More performance tests take place at the Combine, but the six major ones I mentioned earlier are more popular and shared with the fans.)

Where It Begins

When athletes first show up to start training with us for the Combine, they are evaluated by the medical staff to ensure they are healthy and cleared for training. Athlete E was, so we tested him on all Combine performance tests.

The pre-testing results can humble a lot of athletes: not everyone runs a 4.4 or jumps 32 inches as they think they will, especially after a football season, said @steve20haggerty. Share on X

Before looking at his pre-testing numbers, remember that he just finished a college football season in a Power 5 conference. He was not training for the 40-yard dash and vertical jump; he was playing the extremely physical sport of football. The pre-testing results can humble a lot of athletes: not everyone runs a 4.4 or jumps 32 inches as they think they will, especially after a football season. For playing wide receiver in the NFL at his size (6’3” and 235 pounds), we knew he needed to run in the 4.5 range and jump at least 10 feet in the broad jump and 32 inches in the vertical.

Pre-Test
Figure 1. Athlete E’s pre-test 40-yard dash times, including all of the 10-yard splits.
Jump Pre-Test
Figure 2. Athlete E’s pre-test broad and vertical jumps.

We will look into the training for the 40-yard dash, vertical jump, and broad jump. Athlete E trained speed two days a week and for the agility drills and position work two days per week. A typical schedule for athlete E on a speed day was:

  • 6:30 a.m. – Arrive for breakfast
  • 7–8 a.m. – Physical therapy, acupuncture, chiropractor, massage, etc.
  • 8:15 a.m. – Speed session
  • 10 a.m. – Boots or massage
  • 11 a.m. – Lunch
  • 12:30 p.m. – Film review
  • 1:15 p.m. – Lower-body lift
  • Ice bath

He arrived at the facility in mid-December. For athletes like E, Bommarito Performance serves as a second home, where they will eat, train, and sometimes sleep (naps) for the next two and a half months. Athlete E arrived two weeks earlier than most other players, giving him a head start on learning some of the movements and getting healthy from his football season.

His main focus in December was to get healthy and start building strength and power in the weight room. In the tables below, I include the workout date, the main movement or superset, and the hamstring accessory exercises. There were, of course, other exercises in the workout, but I only included the hamstring-dominant accessory movements. I also included each exercise’s volume and intensity (load, distance, height, etc.).

December Lifting
Figure 3. December lifting program for athlete E.

January Training

Once we got into January, athlete E was in a very good position health-wise—he already had had no major injuries, but now he was more or less completely recovered from the football season. Our focus in the weight room shifted more to explosive power. The speed training sessions consisted of more drills to build an overall training volume and capacity. We timed sprints six days in January; in three of them, we only sprinted up to 20 yards. The longer the sprint, the more stress put on the hamstring—which is the No. 1 injury everyone is worried about during this process.

Again, this is a football player, not a track sprinter, so we typically are cautious with sprinting distance until later in the process. Athlete E was also invited to the Senior Bowl, so in the last few days of January, we really pulled back on his training volume just to ensure he felt fresh and recovered for the week of practices ahead.

Again, this is a football player, not a track sprinter, so we typically are cautious with sprinting distance until later in the process, said @steve20haggerty. Share on X

As you will see in both the speed workouts and the weight room lifts, athlete E utilized supersets or complexes in his training (many refer to this as post-activation potentiation). For example, a common approach in the weight room is to speed squat with accommodating resistance and then jump—whether on a box, using a Vertimax, or with something measurable like a Vertec. Our goal was to raise the muscle’s capacity to produce force and the nervous system’s ability to produce force quickly and then apply it in the fashion in which he would be tested, like a vertical jump.

In January, we utilized more weighted movements like squats and a higher volume of them. As we progress, the movements we utilize change to lighter/faster movements and lower volume. On the field for speed training, he would utilize a drill that we would program to improve the technical components of his sprint, then hit a timed sprint.

Athlete E is a strong and muscular athlete. We knew we needed to maximize the start (or first 10 yards) of his run and get his upper body to relax during the last 20 yards of the run. For this, we worked a lot on his starting stance, projecting out, and being very aggressive in his start. We utilized basic kneeling arm swing drills to teach him how to swing fast while keeping his hands, shoulders, and neck relaxed.

I always want to see if we can enhance sprinting mechanics with a drill and then get it to carry over to a full-speed sprint. In early January, we started with slower acceleration-based movements such as sled sprints. As February approached, athlete E spent more time doing max velocity-based drills, like overspeed bounds and sprints.

After doing a heavy sled push sprint, athlete E and everyone in the world will run slower on a timed sprint. That’s okay. Did we get the improved technical components to carry over to the sprint? That’s what we’re looking for.

January Lifting
Figure 4. January lifting and speed program. Speed work was done in the morning on Tuesday and Friday. Lower body lifting was typically on Tuesday afternoon and Saturday morning.
Sprint Splits
Figure 5. Sprinting split times for December and January: 0–10, 0–20, and 0–40 are all from a three-point stance. Most of the other 10-yard split times are from a two-point stance.
Jump Results
Figure 6. Broad and vertical jumps from December and January. Athlete E performed the January 10 and January 17 jumps during his lifting workout.

February Training

Once athlete E was back from the Senior Bowl, the focus was on getting him recovered and healthy from the week of intense practices and the game itself. The strength and power established in December and January set a good foundation for the peaking process needed in February. The weight room consisted of more jumps and less squatting, while the speed work consisted of fewer drills, less volume, more rest, and longer distance sprints.

February Lifting
Figure 7. February lifting and speed program.

Drop-Off in Performance

Measurable numbers will decline at some point—I have heard the coaches at Spellman Performance refer to this as “the valley”—it pretty much happens to everyone. Training for the NFL Combine is a long, tiring process, and athletes are rarely completely fresh and recovered, so we can’t expect them to break personal records every day. The biggest thing to look for during this time of decreased performance is their technical performance. When watching them run or reviewing film of the athletes running…are they running with the proper technique? If they are and their performance is down, they simply need to recover and for their legs to feel fresh again.

The biggest thing to look for during this time of decreased performance is their technical performance…are they running with the proper technique?, said @steve20haggerty. Share on X

During training, when they are sprinting four times per week, plus working on agility drills twice a week, doing position work, and lifting four times per week, we expect decreased performance. Needless to say, athlete E was often sore, and his legs never felt great. If they are running technically sound—which to me is being in the proper positions to direct force into the ground in the proper direction—then there shouldn’t be anything to worry about. If his legs are sore as we still push him to improve his physical qualities, such as strength and power, once we begin to taper, that power can be expressed. Athlete E had performance drops at times, as we accepted.

Again, he was training intensely six days per week with multiple workouts per day—this is not ideal for breaking personal records daily. Yet he and all of our athletes want to see faster times every day, which does not always happen. That is a tough part of this process for many guys to understand. As a coach, it is my job to get him to understand that performance will sometimes decrease. When reviewing athlete E’s sprinting film with him, it was easier to show him how much he has improved technically and get him to understand that once he begins to taper, we would see significant time improvements.

The biggest dips in sprint performance seemed to occur on January 13 and January 23, and the only drop in performance on jumps was on January 10. January 10 was a Tuesday, and January 13 was a Friday of the same week. This was athlete E’s deload week—he had been training hard for a few weeks prior, and it was time to pull back on overall training volume. A deload for athlete E on the field looked like almost no drills on the feet—no sled pushes, A-skips, or anything like that. He did some traditional arm swing drills from a kneeling position and still hit full-speed sprints, but less distance and fewer reps than the rest of his group.

Two things could have occurred here, or maybe even a combination of the two—he was slightly overreached or over-trained, which led to a decrease in performance, and we did a good job of giving him a deload week. Or what I have noticed with deload weeks is that guys tend to relax and let off the gas a bit. Some guys celebrate the deload week because they are constantly sore and want to feel fresh again. Athlete E is the type of guy who always wanted to do more and get extra work, so I don’t know if I saw him pull off the gas much. My guess is he was overreaching, which is a good thing—we want to push the athletes over the edge slightly and in a controlled manner. We want the super-compensation effect that comes with it.

Sprint Performance
Figure 8. Line graph for a visual of the trend over time of athlete E’s 10–20-yard sprinting split.

The other date of decreased performance was on January 23 and even a little on January 24. This was a Monday and Tuesday of the week leading to him leaving for the Senior Bowl. Again, a couple of things could be at play here.

  1. On the previous Friday (January 20), only a few days prior to the decreased sprint times, athlete E had a higher training volume on the field of overspeed sprints and long-distance sprints that he had not completely recovered from. Overspeed sprints are the highest stress we place on the athletes from a central nervous system standpoint. It is very common for guys to feel sluggish the day after these.
  2. He may also have been feeling some stress and anxiety about the upcoming Senior Bowl. This is a week of intense practices, meetings, and interviews, and really getting in front of scouts and coaches for the first time. Many guys will ask us if they can do extra position work in the week leading up to their All-Star games or even do less in their weight room lifts in an attempt to avoid being sore.
Acceleration graph
Figure 9. Line graph illustrating the trend of athlete E’s 10-yard start over time.
It’s important to consider both the physical and mental factors that could lead to improved or decreased performance, said @steve20haggerty. Share on X

I think it’s important to consider both the physical and mental factors that could lead to improved or decreased performance. My guess for athlete E for this drop in performance is that the overspeed sprints definitely played a factor (many others ran slower sprint times on January 23 and 24, whether they were going to the Senior Bowl or not), but the stress of the upcoming All-Star game may have had an impact as well.

Sprint Segments
Figure 10. All sprinting splits from the pre-test to the Combine. The 10–20-yard split was our most recorded time—note the initial improvement in January, the performance drop, and then the peak leading to the Combine.
Final Jumps
Figure 11. All broad and vertical jumps—again, notice the decrease in jump distance in the broad jump and then the peak leading to the Combine.

The NFL Combine

I’m not sure how many readers are aware of this, but the 40-yard dash times you see on TV for the Combine are not connected to the laser timing lights on the field. Even when NFL.com publishes “official times,” those are not the times from the timing lights on the field. Why doesn’t the NFL release the actual times, as you see for the Olympic track events? I don’t know the answer.

NFL teams receive an Official Combine Report about one week after the Combine concludes. This has the official measurements for all the performance tests, specifically the times for the 10, 20, and 40. I used the times from the Official Combine Report for this article.

At the Combine, athletes get up to two 40-yard dash sprints with a long rest in between. I was texting athlete E at the time of his first sprint and during this rest as well, trying to keep him focused. Something interesting to note is that he mentioned how strange he felt, referring to sprinting in a dead silent stadium with everyone staring at and evaluating him. These football players are used to loud, intense, and chaotic environments. The Combine is intense, but there is not the same energy as a football game—yes, there is a crowd in one corner of the stadium, but rarely does any cheering occur. There is almost no noise.

He mentioned how strange he felt sprinting in a dead silent stadium with everyone staring at and evaluating him. These football players are used to loud, intense, and chaotic environments. Share on X
Text Messages
Figure 12. Texts between me and athlete E between runs at the Combine.

Takeaway

Final Sprint Results
Figure 13. Pre-test and NFL Combine 40-yard dash times and 10-yard splits.

My biggest takeaway from the NFL Combine training this year was simply a reminder of the performance drop-offs that occur. As long as the technical mechanics of the sprint are improving, the power outputs in the weight room are improving, and you have the ability to assess the need for a deload week or much-needed recovery, there is nothing to worry about. This is all part of the process. Athlete E was able not only to hit all of the target numbers we looked at for the 40, broad jump, and vertical jump but surpass our goals.

Lead photo by Zach Bolinger/Icon Sportswire

Since you’re here…
…we have a small favor to ask. More people are reading SimpliFaster than ever, and each week we bring you compelling content from coaches, sport scientists, and physiotherapists who are devoted to building better athletes. Please take a moment to share the articles on social media, engage the authors with questions and comments below, and link to articles when appropriate if you have a blog or participate on forums of related topics. — SF


Football Testing

Rethinking Athletic Fitness Testing

Blog| ByKim Goss

Football Testing

Strength coaches are obsessed with how fast athletes run, how high they jump, and how much they lift. After all, these numbers determine the ceiling of athletic potential…or do they? Consider the perplexing NFL Combine results of running back Chris Johnson and quarterback Tom Brady.

In the 2008 NFL Combine, Johnson ran the 40-yard dash in 4.24 seconds, tying the NFL’s all-time best, and soared 35 inches in the vertical jump. The Tennessee Titans drafted him in the first round. The payoff? Johnson rushed for over 1,000 yards in six seasons, racking up 2,006 yards in 2009. He was also the first player to reach 1,900 rushing yards and 400 receiving yards in the same season.

In the 2000 NFL Combine, Brady ran the 40 in 5.28 seconds and vertical jumped 24.5 inches. The New England Patriots drafted him in the sixth round. The payoff? Brady threw for 89,214 yards with 649 passing touchdowns, was voted the NFL’s Most Valuable Player three times, and won the Super Bowl seven times.

Combine Testing
Images 1. Tom Brady and Chris Johnson are Pro Football Hall of Fame recipients with radically different NFL Combine results.

Are Tom Brady’s pedestrian numbers an odd exception and not the rule? Perhaps, but consider the results of one study involving 1,155 athletes who participated in the NFL Combine between 2005 and 2009. The researchers found that “regardless of position, the current battery of physical tests undertaken at the combine holds little value in predicting draft order.”

With such diverse results, it’s understandable that many sports coaches, not just football coaches, are skeptical about the value of testing. But perhaps it’s not so much that testing is worthless, but more that the tests used to measure athletic potential are often irrelevant.

A Closer Look at Speed

The 40-yard dash is considered the ultimate measure of a football player’s speed, but why? How often has anyone ever run 40 yards in a straight line in an NFL football game? Further, between 2010 and 2019, the average number of total rushing yards per game was 117, and the total passing yards was 234. Let’s consider another popular measurement of speed, the 100-meter sprint.

The 40-yard dash is considered the ultimate measure of a football player’s speed, but why? How often has anyone ever run 40 yards in a straight line in an NFL football game? Share on X

The title of “The Fastest Man in the World” is given to the winner of the 100 meters in the Olympic Games. However, sometimes it’s not the sprinters with the highest top speed who win in sprinting. Consider the controversial 100-meter finals at the 1988 Olympics featuring Carl Lewis and Ben Johnson.

Johnson won with a world record time of 9.79, even raising his arms before the finish, which may have slowed him down. Lewis was close behind at 9.92 but was later declared the gold medalist when Johnson was disqualified for doping. Surprisingly, the fastest 10-meter split for both athletes was .83 seconds. Johnson’s superior reaction time and rocket start gave him a huge .8-second advantage over Lewis for the first 20 meters, but both had the same lowest time for a 10-meter split.

Another unique aspect of the 100m is that most sprinters don’t reach top speed until about 65 meters. In his world-record 100m sprints in 2008 (9.69) and 2009 (9.58), Usain Bolt reached his top speed when he passed the 60-meter mark. Further, his time for the first 10 meters during his 9.58 record was .6 seconds slower than Johnson’s.

How could this data apply to football?

Although elite 100m sprinters are undoubtedly fast for the first 10 meters, the average run from scrimmage in the NFL in recent years is 5 yards. From these numbers, the wide receiver position might be best for sprinters such as Bolt and Lewis. Based on Johnson’s faster start (and being able to bench press 407 pounds for two reps!), the running back position might be best for Johnson. But hold on—a football coach should also consider focusing their recruiting efforts on hurdlers.

A hurdler must make minute adjustments during a race and be able to absorb, store, and redirect higher levels of force with each landing without sacrificing speed. Thus, the enhanced kinesthetic abilities from hurdling may transfer better to the gridiron than the ability to cover ground more quickly during a 100-meter sprint. But hold on again—there may be even better cross-training sports for football.

I joined the Air Force Academy as a strength coach in 1987. The head athletic trainer told me that in the early days of Air Force football, off-season conditioning consisted of the “skill” athletes playing basketball and the “linemen” wrestling. Perhaps this was not such a bad idea?

In the early days of Air Force football, off-season conditioning consisted of the ‘skill’ athletes playing basketball and the ‘linemen’ wrestling. Perhaps this wasn’t such a bad idea? Share on X

Basketball players must not only be able to move and change directions quickly over short distances, but they must also react to the movements of others. In the 60m–100m events in sprinting, athletes stay in their lanes so they don’t interfere with the movement of their competitors. (Other than being a groovy-looking conditioning method, the lack of reaction to an opponent’s movements questions the value of many cone and ladder drills for football players.)

Wrestling, and many other forms of martial arts, make sense for linemen. At the Academy, I introduced the coaching staff to a martial artist who worked with NFL teams. He showed the coaches several hand movements to break holds and footwork techniques to move more effectively—we even made a video of these techniques to pass on to our current and future players. (By the way, one of this martial artist’s sales pitches to football teams was to have linemen try to tackle his girlfriend, an elite martial artist who often embarrassed them.)

Now that I’ve got you thinking, what resources are available for coaches to determine the best athletic fitness tests for your athletes? One innovative book that sparked my interest in sports-specific testing is Sportselection by Dr. Robert Arnot and Charles Gaines (1984).

The authors developed three major categories of sports-specific testing: The control (nervous) system, the heart-lung package, and body composition. Arnot and Gaines applied these categories to seven sports: alpine skiing, cross-country skiing, cycling, running, swimming, tennis, and windsurfing. Using their assessments, a parent can determine which of these sports their child is most likely to succeed in (and enjoy, as those with a physical advantage are often prone to enjoy a sport more).

Sprinter
Image 2. Sports testing may help determine where an athlete can excel. After tearing her ACL in high school while playing soccer, Maddie Frey focused on track and field. Last year she broke the 32-year-old 200m record at Brown University. (Photo by Karim Ghonem, Frey’s hair and makeup by Day Shimmer Spa)

One problem with Sportselection is that it only addressed the requirements of a few individual sports. However, there’s no stopping a coach from developing a method to assess other individual sports or even team sports. Let me show you how I did it with football.

The Football Equation

In the case of football players Johnson and Brady, their positions required different skill sets. The question I had to answer as a strength coach was, “What tests are most relevant for each position?”

Before answering, it’s necessary to distinguish between testing for run-oriented and throwing-oriented teams. The Academy had a “4 yards and a cloud of dust” offense, and the skill requirements for many offensive positions differ from a passing team.

Our wide receivers needed to be able to block, our offensive linemen needed exceptional lateral speed to pull, and our quarterbacks needed to scramble. In the season where we upset Ohio State in the Liberty Bowl, our quarterback averaged only 30 yards a game passing and didn’t throw a single touchdown pass all year. We actually had one game where the kicker threw for more yards than our quarterback when he fumbled the snap from center and passed the ball! My favorite slogan to describe our approach to football is: “Passing is for cowards!”

To determine the best predictor lifts and field tests for our football team, I enlisted the services of the Air Force Academy’s math department. My data included our primary lifts in the weight room, our field tests (such as the 40-yard dash and vertical jump), and our military fitness tests (such as sit-ups and the standing board jump). I only used data from the top three athletes in each position because these athletes were most likely to see playing time in a game. Thus, if our top three linebackers had exceptional results in the back squat, the back squat represented a strong correlation.

To determine the best predictor lifts and field tests for our football team, I enlisted the services of the Air Force Academy’s math department. Share on X

An example of the data we used is summarized in image 3, an Athletic Fitness Player Profile Report of one of our centers on the AFA football team. One feature of this report was that a coach not only sees each athlete’s current testing results but the progression of their testing results throughout their entire athletic career.

Player Profile
Image 3. An Athletic Fitness Player Profile Report used by the Air Force Academy Football Team.

With the help of our math consultants, I could determine which lifts or field tests an athlete needed to focus on. (By the way, the math department was thrilled to help. I wonder how many Linear Algebra classes ended with the professors telling their students, “I need to release you 10 minutes early—the Falcon football team needs me!”)

Using data collected over three years, our number crunchers came up with some interesting results, not just in transferring athletic fitness testing to performance but correlations of one field test to another. For example, they found a strong correlation between the 40-yard dash and a two-leg triple jump. Let me explain.

We found that those who excelled in the triple jump also excelled in the 40. With athletes who did not possess good elastic strength (and thus the ability to accelerate in the 40), the results of each of the three jumps varied little. You might see a sequence of 8 feet, 8 feet, 8 feet. Athletes possessing exceptional elastic strength might display patterns of 8 feet, 10 feet, and 11 feet. Again, both athletes achieved the same result in the first jump, but exceptional elastic strength enabled the second athlete to jump farther on the second jump and even further on the third.

One of the issues with 40-yard dash testing is that athletes would (perhaps subconsciously?) hold back in the intensity of their weight workouts the week before testing to ensure they were not fatigued going into the test. Athletes were not so concerned about fatigue or soreness going into a jump test, so we could assess their ability to accelerate more frequently.

Although you would expect that improving all the field results would be good, there are cases in football when failing to make progress in sprinting speed and jumping ability is acceptable—case in point: the Lewis Formula.

Power Factor Testing: The Lewis Formula

There is no question that Saquon Barkley is a powerful runner. In his rookie season with the New York Giants, he rushed for 1,307 yards with a 5-yards-per-run average. He also performed remarkably in tests of strength and jumping ability. You can watch a YouTube video of Saquon Barkley cleaning 405 pounds in college, and in the 2018 NFL Combine, he vertical jumped 41 inches. But which test is better, the clean or the vertical jump? The answer is both.

At the AFA, our math consultants determined that the No. 1 test for determining the physical abilities of a lineman was the Lewis Formula. We also found that the formula was more relevant to fullbacks and linebackers than wide receivers and cornerbacks.

I first read about the Lewis Formula from sports scientists Mike Stone, Ph.D., and Harold O’Bryant, Ph.D., in their classic exercise science textbook, Weight Training: A Scientific Approach. They said, “The vertical jump is not a valid indication of leg and hip power unless mass and time are taken into consideration.” They followed this comment by introducing the Lewis Formula, a power index that solves this dilemma by using the vertical jump and body weight.

The Lewis Formula is represented by a nomogram containing three parallel vertical lines. On the left is body weight, on the right is the vertical jump, and where they intersect in the middle represents power. Using a straight ruler, a strength coach could determine if an athlete could generate more power by increasing their vertical jump (plyometrics) by 2 inches or increasing their body weight (higher-rep bodybuilding training) by 10 pounds.


Video 1: Weightlifter Christian Rivera demonstrates his vertical jumping ability and single-leg strength.

A practical example of applying the Lewis Formula is with Air Force Academy graduate Steve Russ. As a freshman, Russ recorded one of the fastest 40s, not just for the freshmen but for the entire team. He was 6-feet-4 and probably would have been a tight end on just about any other college team, but a more pressing need for us was a big body on defense (again, passing is for cowards). For Russ, the best way to increase his Lewis Formula was to increase his body weight, as he already had an excellent vertical jump.

Over the next four years, Russ improved his vertical jump from 31 to 35 inches but made minimal improvements in his 40- and 10-yard sprint times. But that was okay because Russ packed on approximately 50 pounds of muscle while maintaining a body fat of 10%. Also, during his four years with us, his clean went from 220 pounds to 335, and his bench press from 260 to 370. He thus became an irresistible force to compete against the immovable objects on our opponent’s offensive lines. Further, the Denver Broncos drafted Russ in the seventh round in 1997. He played for three years, including in 1999 when the Broncos won the Super Bowl, and he is now the Linebacker Coach for the Washington Commanders.

Fine-Tuning Performance with the Athletic Index

For strength assessments, we relied on the results of three lifts: clean, bench press, and back squat; we also considered body weight to assess relative strength. By the way, I wasn’t a fan of in-season “maintenance workouts.” Instead, I followed the in-season volume/intensity recommendations of legendary strength coach Charles R. Poliquin, which enabled many of our athletes to break personal records, even in the clean and squat, during the season.

We kept the coaches abreast of each athlete’s progress, and the best performances were recognized on large record boards posted throughout the gym. Awards such as “Mr. Intensity” were given to athletes who stood out for their work ethic and leadership in the weight room. One recipient of the Mr. Intensity award was Chris Gizzi.

In his first year with us, Gizzi increased his clean from 280 to 325, his vertical jump from 33 inches to 36, and his body weight from 195 to 221 at 8% body fat. Gizzi eventually cleaned 379 pounds and vertical jumped 39 inches at a body weight of 233. Gizzi played in the NFL and is currently the Strength and Conditioning Coordinator for the Green Bay Packers.

For the “skilled” players, I developed an “Athletic Index” that assessed the overall athletic ability of a football player. Rather than relying on one test, I took five field tests representing the basic athletic skills of running, jumping, and muscular endurance. (A comprehensive resource on tests to assess athletic performance is Physiological Tests for Elite Athletes, 2nd Edition (2012) by the Australian Sports Commission. It was first published in 2000. It was updated in 2012 and contains assessments for 18 sports; unfortunately, not American football.)

I developed an Athletic Index that assessed a football player’s overall athletic ability. It relies on five field tests representing the basic skills of running, jumping, and muscular endurance. Share on X

For each test on the Athletic Index, I established a point value, up to 20 points, based on the best performances on the team. For example, let’s say the best vertical jump on the team was 40 inches. The point value would be distributed as follows:

Jump Height           Points

40                                20

39.5                             19

39                                18

…and so on

I used 20 points as the max value because 20×5 equals 100, so one athlete may have an Athletic Index of 90 points and another 85 points. Working on an athlete’s weakness is the fastest way to improve an overall score. Let’s look at one variable considered vital for nearly every position in football: lateral speed.

Because you briefly support yourself primarily on one leg when you change directions, single-leg squats are one strength training exercise to improve lateral speed. I like to start with assisted single-leg squats followed by non-assisted single-leg squats. Image 4 shows a progression of four single-leg squats, going from assisted squats to an unassisted version using weights.

Exercises
Image 4. Progression of single-leg squats: Top left to top right, assisted; bottom left to right, non-assisted and with dumbbells. (Drawings by Sylvain Lemaire, HexFit.com)

On the field, you can perform many challenging exercises to increase the work of the muscles involved in lower body stability. Video 2 shows one exercise that involves fast eccentrics of muscles involved in lateral movement.


Video 2. In-and-out squat hops on an incline is a challenging exercise using fast eccentrics to enhance lateral speed.

I found the Athletic Index was most applicable to our “skill” players. For this reason, we had two basic workouts. The linemen would lift four days a week and do running and plyometrics once a week, and the skill players would lift three days a week and do running and plyometrics twice a week. If a lineman’s Athletic Index score was particularly low, he could briefly switch to the skill position workout to become an overall better athlete. Likewise, a physically weak skill player could briefly do the lineman workout to add strength and muscle.

Of course, you can expand an Athletic Index with additional tests. You could have 10 tests with a maximum value of 10 points per test. I also made an index that incorporated several core lifts, calling it the Football Index.

Today, considerable technology is available to take athletic fitness testing to the next level (certainly far exceeding what I did 30 years ago), precisely measuring physical qualities that could not be adequately measured before. Force plate technology is now being used at Brown University, where I’ve been coaching for several years. And my colleague Paul Gagné, a strength coach and posturologist, has been using force plates with his elite athletes to test their athletic preparedness for many years (video 3).


Video 3. Force plate technology can take athletic fitness to higher levels. Here Coach Paul Gagné uses a force plate to assess and train body awareness with Chloé Dufour-Lapointe, Olympic silver medalist in freestyle mogul skiing at the 2014 Olympic Games.

Moving on, in addition to individual testing reports, we would give the coaching staff team reports with the cooperation of our exercise science lab and sports medicine staff.

Team Reports

As with any sports medicine department, the AFA tracked every injury they treated. In 1992, they gave me a report summarizing the number of injuries they treated on the football team from 1988 to 1992. Over these five years, the number of injuries decreased linearly by 60%! Such results helped us earn the support of our sports coaches.

As a bonus, our sports medicine staff could determine approximately when an injury occurred during practice or a game. Falcon Head Football Coach Fisher DeBerry was known for his inspirational (and rather lengthy) post-practice reviews. We found that an exceptionally high percentage of injuries occur in the last 15 minutes of football practice, so we suggested that Coach DeBerry give part of his review in the middle of practice to allow the athletes to rest and recover. Although many variables are associated with injuries, the decrease in visits to the trainers during the first full year after we made this change was 18.75% (again, with a 60% decrease over five years).

Body composition testing was also crucial at the Academy. Let’s say an athlete needs to improve their running speed or jumping ability. Because you can’t flex fat, you want your athletes to have low body fat levels. Want proof? Have an athlete run several 20-, 30-, or 40-yard sprints, alternating between wearing a 5- or 10-pound weight vest and running without one. Or have them perform several vertical jumps with and without additional weight. You may be surprised at how much just 5 pounds can affect running speed and jumping ability.

Speed is a primary concern in football, but it’s more challenging for lighter athletes to block and tackle heavier athletes. Share on X

Speed is a primary concern in football, but it’s more challenging for lighter athletes to block and tackle heavier athletes (in fact, we had one game in which the opposing team’s quarterback weighed more than any of our defensive linemen!). As such, our linemen needed exceptional stamina when faced with larger opponents (which was pretty much everybody we played).

How did we do at the AFA for turning our athletes into lean, mean football machines? Consider image 5, a team report showing our football players’ average body fat levels, including linemen, during a three-year period. Note that these are averages, and the percentage decreased each year. By the way, Jack Braley, the head strength coach at the AFA, was a master at skin calipers for determining body fat. He frequently compared his results to athletes who did hydrostatic (underwater) weighing in our exercise science lab and was usually spot on. 

Body Comp
Image 5. The team reports reflect trends in athletic performance indicators, such as this one showing body fat levels of Air Force Academy football players

While putting this much work into testing may seem extreme, most colleges (and many high schools) have sufficient resources to enact a comprehensive testing program with their athletes. Assign a team manager or intern to evaluate testing results and get the school’s math, computer science, exercise science, and sports medicine departments involved. From there, see how you can use that data to help your athletes reach higher levels of athletic superiority.

Takeaways

  1. Determine what lifts and field tests are most relevant to your sport. Use current testing research and experiment with tests you believe are important.
  2. Share the results of your tests with sports coaches to encourage them to promote your program. Provide them with individual and team testing data.
  3. Use testing results to monitor the effectiveness of your program. If your athletes are not getting better during testing periods, change your program.
  4. Consider that many tests to determine athletic preparedness are inexpensive and require little or no equipment. If you have the budget for new testing technology, go for it!

Since you’re here…
…we have a small favor to ask. More people are reading SimpliFaster than ever, and each week we bring you compelling content from coaches, sport scientists, and physiotherapists who are devoted to building better athletes. Please take a moment to share the articles on social media, engage the authors with questions and comments below, and link to articles when appropriate if you have a blog or participate on forums of related topics. — SF


References

“Chris Johnson Prospect Info.”

“Tom Brady NFL Combine Highlights.”

Robbins, Daniel W. “The National Football League (NFL) combine: Does Normalized Data Better Predict Performance in the NFL Draft?” Journal of Strength and Conditioning Research. 2010;24(11):2888–2899.

“Development of average offensive yards per game (rushing/passing) in the NFL from 1950 to 2021.”

Lee, Jimson. “Add Up the Fastest 10 meter Splits and You Get…”

Royal, Darrell. Quote: “People call the split-T the ‘four-yards-and-cloud-of-dust’ offense.” Hickman, Herman. Sports Illustrated, September 23, 1957. (Note: There is insufficient evidence that this was the first reference to this quote.)

Arnot, R. and Gaines, R. Sportselection, Penguin Books. 1984. (Note: Title was later changed to Sportstalent.)

Poliquin, Charles R. Personnel communication, 1988.

Boly, Jake. “Penn State Running Back Saquon Barkley Just Cleaned 405 Lbs.” BarBend, 6/30/17.

Stone, Michael and O’Bryant, Harold. Weight Training: A Scientific Approach, Burgess International Group, Inc. 1984, pp. 166­–168.

Goss, Kim. “They Call Him Mr. Intensity.” Bigger Faster Stronger, Winter 1977.

Physiological Tests for Elite Athletes, 2nd Edition, Australian Sports Commission. Human Kinetics, 2012.

1080 Lateral Jump

Quantifying Peak Velocity Quotient in Multiplanar Jumping with 1080 Sprint

Blog| ByDeRick O'Connell

1080 Lateral Jump

There’s fast, and there’s fast, fast! When creating testing procedures, we should always strive to be as specific to the sport as possible—and when the sport demands the need for speed, we should follow suit with Dominic Toretto, buckle our racing harnesses, hit the redline on the tachometer, and get there as quickly as possible. Along with specificity comes efficiency. Specificity and efficiency are the name of the game when conducting tests in the team environment, especially during intense times such as training camp, when numbers are enormously high and time is tremendously low.

Another cornerstone of testing is that it should also be used as a training mechanism throughout the year in the performance end as well as helping in the return to play and reconditioning spectrums. Ensuring that tests are consistently performed enables us to collect and monitor data at a more precise rate. This also allows the athlete to perform the test without a learning curve and with the understanding that it translates to sport. This saves us time convincing athletes why we perform the test and increases enthusiasm and buy-in. Bottom line: any time we can bring together transferability and efficiency within the testing curriculum, that’s a win-win for the coach and the athlete.

We should always aim to deviate as little as possible in the training stresses the athlete experiences in the weight room and their sport, says @DeRickOConnell. Share on X

We should always aim to deviate as little as possible in the training stresses the athlete experiences in the weight room and their sport. A great goal to strive for is a synchronized simulation from training to sport. By doing this, we can provide the athlete with an environment that allows maximal transfer, reduction of injury, and easier return to play transitions—the popular slogan “training is testing, testing is training” carries much validity.

Flying Leaps and Braking Demands

For birds, “jumping to takeoff is an explosive behavior with the goal of providing a rapid transition from ground to airborne locomotion. An effective jump is predicated on the need to maintain dynamic stability through the acceleration phase.”1 Parslew et al. defines a generic jumping system as comprising three functional components: body, leg, and foot.

  • The body refers to the mass group, including the head and trunk.
  • The leg is an extensible member that can do mechanical work through linear and rotational displacements of the body and foot.
  • The functional foot provides a distributed mechanical interface between the end of the leg and the ground.

The term “foot,” chosen here for brevity, encompasses the front and rear digits in the context of avian morphology. The functional leg in a jumping system is characterized primarily by its stroke length, i.e., the maximum length it can extend, and the general force and power characteristics of the actuation system as a function of displacement and velocity.1

While sequential rationality may appear to be abstract, the concept described through avian takeoff theory does illuminate an interesting juxtaposition as to the importance of dynamic stabilization in humans. I found the work done in the article to be interestingly outside of the box yet applicable when thinking about the jump takeoff of our athletes. The goal of our athletes when jumping is to display the ability to reciprocate massive eccentric braking forces with the ability to achieve maximum velocity as quickly as possible.

Movement, in the final analysis, comes only from muscle contraction. Muscle contraction is completely controlled by the alpha motoneurons in the spinal cord. When the alpha motoneurons are active, there will be movement. The activity of the alpha motoneurons is a product of the different synaptic events on their dendrites and cell bodies. There is a complex summation of EPSPs and IPSPs, and when the threshold for an action potential is crossed, the cell fires. There are a large number of important inputs, and one of the most important is from the corticospinal tract, which conveys a large part of the cortical control.

Such a situation likely holds also for the motor cortex and the cells of origin of the corticospinal tract. Their firing depends on their synaptic inputs. And a similar situation must hold for all the principal regions giving input to the motor cortex. The activity of any cortical region will depend on its synaptic inputs. Some cortical motor inputs come via only a few synapses from sensory cortices, and such influences on motor output are clear. Some inputs will come from regions, such as the limbic areas, many synapses away from primary sensory and motor cortices. At any one time, the activity of the motor cortex, and its commands to the spinal cord, will reflect virtually all the activity in the entire brain.2

Along with this massive demand for braking, a component of stability is necessary. When assessing the mechanistic deficiency, we tend to see that the instability comes from a tipping phenomenon. Share on X

Along with this massive demand for braking, a component of stability is necessary. When assessing the mechanistic deficiency, we tend to see that the instability comes from a tipping phenomenon. This is witnessed through a deviation in the center of gravity when the knee travels outside the optimal functional range of the foot. The athlete’s foot and ankle structure efficiency plays a massive role during this preflight phase of movement. Along with this comes a demand for the athlete to be able to push through the ground and own the movement. For more information, feel free to refer to “Triphasic Speed Training Manual for Elite Performance: Part 1 The Spring Ankle Model” (which I wrote along with Cal Dietz and Chris Korfist).

The stabilization demanded during this preflight phase is different from traditional stability training, which may involve athletes training on unstable surfaces with the goal of activating stabilizers in the core and trunk that focus on low-velocity co-contraction. While this variation of training has a list of benefits, especially for athletes returning to play, the largest deficiency in applying training types like this is that classic stability training does not elicit a significant enough stress force factor to allow the athlete to handle the mechanical tension they will undoubtedly face. After all, “Stress is the language of the cell.” The body must be able to communicate with and transduce force and then maintain structural integrity throughout the mechanotransduction process.

Athletes participating in team sports must cut, sprint, and jump in multiple directions. Dynamic stability and leg power are two elements that influence an athlete’s ability to do this effectively. With regard to dynamic stability, this is the ability to maintain balance while transitioning between static and dynamic movement states. Athletes with good dynamic stability should be able to maintain a stable center of gravity during sport-specific movements, such as multidirectional sprinting.3 With this in mind, it is essential to identify and define an appropriate dynamic stability assessment for use in team sport athletes.

The stress applied—coupled with the higher co-contraction rates—makes it clear that high-force braking must be accomplished through high-velocity/high-force training. To gain increases in dynamic stability (typically calculated from the diminishing oscillations of ground reaction force mechanisms over time), we need to enhance the body’s ability to handle high force and increase synaptic transmission, allowing for larger impulse and a larger joint integrity. Analysis of the problem shows that the stability margins during jumping are actually very small, and stability considerations play a significant role in the selection of appropriate jumping kinematics.1

Let’s keep in mind that transitioning through the propulsion phases of a single jump is the most energetically demanding phase of takeoff—this is where the largest amount of acceleration forces are placed on a single limb. These energy forces are altered when tasked with performing repetitive jumps, but in this scenario, we are looking at one maximal effort jump.

The goal of the testing process is to help coaches not only quantify maximum velocity achieved right versus left but also to dive into the athlete’s ability to create this impulse. In a high-velocity-based sport where athletes need to hit 80% of max velocity incredibly quickly—but rarely touch top speed—it is vital that we dig into the quotient that this situation creates. Max velocity is essential and the most exciting component to discuss, but it is the time it takes to achieve max velocity that is even more central, especially in high-velocity sports such as hockey or within position-specific roles in football, track and field events, and other sports. The demands of the sport dictate that you don’t have to get to top speed; you need to get to max velocity as quickly as you can on a repetitive basis: It’s not how fast you are; it’s how fast you get to how fast you are that sets a player apart.

It’s not how fast you are; it’s how fast you get to how fast you are that sets a player apart, says @DeRickOConnell. Share on X

Within the fastest sports in the world, there are still variables of speed frequently overlooked by the public. This has become common as broadcasts increase fan interaction by repeatedly displaying top speeds achieved during game play to the viewer at home. To achieve the velocities that the fans see, there are obvious braking components coupled with instantaneous acceleratory demands that must be trained that supersede “functional balance and stabilization” and perturbation work within healthy high-speed populations. Game flow may also play a large role in the top speeds accomplished.

Fast, Fast

When looking at an athlete’s ability to create high velocity in a short time, it’s very useful to be able to do this without planar or movement restrictions. This allows the athlete to perform the movement with maximum intent without having to process a specific landing location. This processing demand can downregulate their ability to create maximum force freely. A prime example of this is having an athlete perform a lateral jump onto a force place, processing the athlete’s ability to transition from a dynamic action to a static position and often reactively out of that given position. This is performed with force plates as a means to closely analyze the athlete’s support basis throughout phases of movement.

While we can, in fact, gather some really great information on the athlete, asking them to land on a precise point after maximally accelerating through the air is nearly impossible and, unfortunately, will lead to a downregulation in dynamic intentions. There are times that landing dynamics can be altered during training, such as when asking the athletes to perform calibrated plyometrics (which are an excellent tool for young developing athletes and an invaluable tool for return to play as a way of allowing athletes to understand how to express maximal output with specific intentions).

Jump performance is often used to indirectly measure leg power, given that power involves the ability to produce force quickly. This is a necessary component of an ideal jump: there is a complex interaction between physiological, biomechanical, and technical factors that interact within multidirectional jumping and power-based actions.

Research has documented how lower-body strength, rate of force development, elastic energy use, leg stiffness, and proper coordination and technique can all contribute to successful jump performance. This would be true for both bilateral and unilateral jumps. However, during a unilateral jump, athletes must rapidly express their strength through force development while in single-leg support. This places greater stress on the capacity to maintain stability while completing the jump.

The relationship between dynamic stability and unilateral jump performance and power has received limited analysis within the literature, however, and the window of dynamic stabilization can influence these elements.3 One of the most important aspects of sport is freedom of movement, thus highlighting the significance of quantifying this expression of force production with as few limitations as possible. This is where the 1080 Sprint can play a crucial role.

Practical Application

The 1080 Sprint allows us to test athletes in all planes of motion with complete freedom of movement. Without getting into specific metrics that the 1080 Sprint can provide, it’s fair to say this feature alone makes the device crucial to performance and reconditioning programs.

The 1080 Sprint allows us to test athletes in all planes of motion with complete freedom of movement. This feature alone makes the device crucial to performance and reconditioning programs. Share on X

To set up for the lateral jump test, the athlete stands lateral to the 1080 Sprint. From here, the athlete is cued to lift the outside foot for approximately one second to allow them to stabilize within the position. This also allows for a clean and clear reading when jump profiling the athlete. We also want to limit any cheating in the position, in which the athlete doesn’t hold the single-leg position long enough to get a clean single-leg effort.

  • You will see this often with younger athletes and athletes with poor structure and function within the foot complex.
  • You’ll sometimes see the athlete lift the foot off at the last second and use the momentum to cheat through the jump.

Once the athlete has stabilized, they initiate performing the jump. To increase safety, always have the athlete land on two feet. With the settings on the 1080 Sprint, the athlete can safely transition through all phases of the jump, land, and simply walk back to the starting line to initiate the next jump. Typically, the athlete will use 1–2 kilograms of concentric and eccentric resistance with maximal speed settings on the concentric. The eccentric speed can be placed at whatever the coach deems appropriate as the athlete walks back to the starting point.

We can begin to quantify and compare differences in multiple planes of motion with lateral and forward jumping, as it is imperative that we assess athletes from all planes of free motion since this is where sport is played. From here, we can also dig into vertical velocity expression versus horizontal and lateral with the use of force plates as a secondary protocol. Reliability, repeatability, and standardization are also important when really digging into the presented data, as there are kinematic, physiological, and structural components to multi-planar high-velocity movement.

Let’s begin by looking at a single-leg broad jump from a general perspective. The two graphics included are the same jump; however, the data is displayed in two different manners: the graphic on the left is displayed in relation to distance and velocity, and the graphic on the right indicates speed over time.

Jump Dissection
Figure 1. The view represented in the graphic is the general jump dissection view on the 1080 web cloud platform. This is followed by the same view, just slightly zoomed in, disregarding repetition labels.

The first image is the primary graphic used when glancing at a jump profile. I have included the second to clarify the noise or general stabilization that occurs when performing a jump. We can see with the primary image that there is a moment where the athlete displays a slow curve trending up, represented by static in the smooth flow of the line. This is where general stabilization occurs in the jump. From a phase of movement perspective, this is when the athlete begins to stand on one foot, starting their “one count” and finding stability and breath control in the static position on a single leg before the explosive effort to follow.

If we zoom in and look closely, we can use our secondary graphic for visual feedback. During this repetition, the athlete appears to have taken approximately half a second to find general stabilization before transitioning into the next phase of the jump.

Trimming Tool
Figure 2. In this image, I have zoomed in and used the trimming tool on the 1080 web platform to illuminate this window of general stabilization as displayed in time.

From here, we can transition into the next phase of the jump profile, the athlete’s window of dynamic stabilization, a product of ground reaction force. With regard to dynamic stability, it is the ability to maintain balance while transitioning between static and dynamic movement states. Athletes with good dynamic stability should be able to maintain a stable center of gravity during sport-specific movements, such as multidirectional sprinting.3 It is important to identify and define an appropriate dynamic stability assessment for use in team sport athletes. This window is crucial to monitor as an athlete progresses through the various stages of return to play and is significantly affected by fatigue.

Dynamic Stabilization
Figure 3. I have trimmed and selected the window of dynamic stabilization of an athlete performing the single-leg lateral jump test. Within this graphic, displayed as speed over distance, we can see the slight natural lean as the athlete pulls themselves down into the jump and preps for the flight phase.
It is important to identify and define an appropriate dynamic stability assessment for use in team sport athletes, says @DeRickOConnell. Share on X

What becomes interesting is that this athlete, a young but very well-trained elite athlete, has performed this test as part of their training over the off-season, so we see very quickly that their left versus right—when comparing positional kinematics, timing, and eccentric distance (distance pulling down into the stabilization window), and velocity—are almost identical. However, we see a much larger discrepancy from left to right when we quickly examine the athlete’s general stabilization window.

Profile phases
Figure 4. Once again, as a positive note, the athlete’s jump profile is nearly identical through these two phases, but the one side has shifted, showing a much larger window of general stabilization while the window of dynamic stabilization remains almost identical.

The next phase of the jump that we can look at can be referred to as the peak velocity quotient. This simple formula encapsulates what is so incredibly important for high-velocity athletes:

    Peak Velocity ÷ Time to Peak Velocity

This is where things become extremely exciting when comparing athletes to each other, and here the work of Rolf Ohman comes into context. Ohman is the inventor of the original 1080 technology and has been an elite track and field coach for many years. For more information on him, check out this podcast on Just Fly Sports. The most important factor in high performance is acceleration—over power and any other metric. According to Ohman, the best athletes in the world are those who are extremely active within the first 100 to 150 milliseconds of an impulse. Therefore, we should train and perform tests that incorporate this perspective and require high coordinative speeds.

The premise of Ohman’s Elastic Index (EI) is that the athlete must store as much elastic energy as possible so that once they hit the stopping point of the movement, the joint serves as a springboard jolting the athlete into the flight phase. The EI is drastically different from athlete to athlete. General joint stiffness can be termed as an athlete’s ability to accelerate maximally during deceleration of the eccentric phase. Through both the eccentric and concentric phases of a movement, slight deviations in acceleration cause enormous changes in the movement.

As Ohman has highlighted in his work, it is crucial that we dive deep into assessing the athlete’s ability to express movement in kilograms of body weight over time. In contrast, standard power protocols focus more on an athlete’s overall ability to move load in comparison to body weight. If an athlete can accelerate faster in a sport that demands repetitive high-velocity movement, they will win every time. This approach can carry over into the weight room through the use of hyper-speed exercises, oscillating exercises, and partial reps—these forms of exercise help to increase coordination of the neuromuscular system. In turn, we expose the athlete to adaptations with the same coupling times they experience in sport.

As Ohman has highlighted in his work, it is crucial that we dive deep into assessing the athlete’s ability to express movement in kilograms of body weight over time, says @DeRickOConnell. Share on X

Power, force, speed, acceleration, and almost any other metric of performance are derivatives of velocity. Normal mass, once accelerated, gets lighter and lighter, making the first millisecond of movement vital to assess. This approach to testing cuts everything else out and looks at the athlete’s ability to create high velocity as quickly as possible.

This is especially important when looking at high-velocity-based sports. There are two ways to approach quantifying this. Both trains of thought are applicable and largely dependent on what the sport scientist and/or strength coach are looking for and their philosophy.

  1. We can quantify this ratio by looking solely at the time spent from the window of dynamic stabilization and braking point into the flight phase to max velocity. Using the trimming tool, figure 5 is what we are looking at if using this approach.
Velocity Vectors
Figure 5. In this graphic, we see that this is an incredibly gifted athlete when analyzing velocity vectors.
    Strangely enough, the athlete has a low training age and was performing the single-leg broad jump test for the first time. As you can see, he achieves a very impressive max velocity of over 5 m/s, and his acceleration curve is impressively steep. You can also see by his general stabilization window that he needed to spend a little extra time getting coached up to allow himself to become stable, as he wanted to bounce and cheat right into the jump.
  1. When dissecting the jump, while velocity is our driving factor in the equation, we still want to consider what it takes for an athlete to create this high impulse of velocity. To do this, we must also consider what is happening prior to reaching max velocity. While flight velocity is king here, reactivity, ground reaction force, and the accumulative window in which these take place are very important. This will tell us a lot about how the athlete needs to train and helps shed light on exactly why this peak velocity quotient is such an essential piece of information within the performance and return to play paradigm.

Stories in the Data

When examining the single-leg broad jump test of two athletes of similar height, weight, and age—both of whom spent extensive time in high-caliber Division 1 hockey programs—we can see some astonishing differences hidden in the data. If we were to look at the power and max velocity achieved from a statistical perspective, we would find that these two athletes are very similar.

SL Broad Jump A
Figure 6. Athlete A’s single-leg broad jump.
SL Broad Jump B
Figure 7. Athlete B’s single-leg broad jump.

In fact, athlete A would register slightly higher in these categories, but it’s incredibly close. But let’s look at the jump profile of athlete B. We can see that while the max velocity achieved by both athletes is pulled out of the raw data as the same, there is a distinguishing, clear difference between the way they both achieve this mark.

If we expand the peak velocity quotient to analyze our window of dynamic stabilization coupled with the peak velocity achieved, these two athletes are not even on the same planet as one another.

The time that accumulates while athlete A reaches peak velocity in the jump is nearly double that of athlete B. This leak in energy impacts not only the acceleration of the flight phase but also athlete A’s inability to dynamically stabilize, create ground reaction force, reciprocate this force into acceleratory trajectories, and achieve max flight velocities. Therefore, it is crucially important that we dissect the entirety of the jump.

The data extracted will quantify and solidify what is happening between the two athletes. Still, the eye test live and in person is undeniable: athlete A possesses very little sharpness to any phase of the jump, while we can quickly see that athlete B produces aggressively rigid and sharp peaks at every phase of movement.

As a side note, this is a perfect time to address the second drop shown in the jump post peak velocity. As the peak velocity quotient of the athlete and freedom of movement are our focus within the test, the athlete is jumping with only one or two kilograms of resistance. The second teardrop within the jump profile signifies a moment of slack as they decelerate, and the machine catches up with them. Coincidentally, we can see how much later in distance this occurs for athlete A, while both athletes jump a similar distance.

Jump Slack
Figure 8. Athlete A displays a delayed moment of slack as they exhibited an exceptionally long duration of time prior to hitting peak velocity. The slack does not hit the athlete until they are basically grounded.
Ferocity of Movement
Figure 9. Athlete B displays a dramatic spike in the second teardrop formation as they hit peak velocity much more quickly, forcing the machine to try and play catch-up with the ferocity of movement.

Additionally, we can examine the left versus right symmetry index and present the information from a data perspective and a visual feedback viewpoint. This is incredibly useful during the return to play and reconditioning phases. In young athletic populations and individuals with compromised joint stability, time to stabilization (TTS) is considered a more functionally relevant stability assessment than static-based measures.4

In the graphic below (figure 10), we can see a left (yellow) versus right (grey) leg comparison of an athlete. Right away, we can see that this athlete has difficulty transitioning through the various phases of the jump, notably possessing an inability to pull themselves down eccentrically and exhibiting poor dynamic stabilization on the right leg.

Strangely enough, if we were to quantify the max velocity achieved on a right leg versus a left leg test, we would find that this athlete produces the exact same max velocity on each side. A quick analysis would indicate that they did extremely well on the test. However, when we look at the window of dynamic stabilization and how that affects the following flight phase, we find that it takes the athlete a longer time to reach peak velocity on the right leg—this is very clear when we look at the peak velocity quotient.

From the data presented in the testing process, we can begin to formulate functional thresholds that an athlete must meet to safely pass beyond the return to play stages of training. Criteria can be put in place on a case-to-case basis or from an organizational approach in which, for example, the athlete is encouraged to achieve 10%–15% symmetry in velocity from left to right as well as possess the ability to be within a window of 10%­–15% of the average velocity production to pass along the return to play protocol (as long as all other criteria are met within the paradigm).

Left Right Compare
Figure 10. A left (yellow) versus right (grey) leg comparison of an athlete.

Next, figure 11 is a quick view of an athlete who possesses a similar profile from left to right when looking at their window of dynamic stabilization. Their peak velocity quotient, however, is very different, as we can see that they take much longer to achieve max velocity.

Assymetry
Figure 11. This is an example of an athlete displaying an asymmetrical peak velocity quotient. We can see this as left (yellow) versus right (grey) demonstrating an excessively long arch within the jump, specifically the left (yellow) side.

Lastly, we briefly examine a classic asymmetrical issue in an athlete (figure 12). As we can see, the athlete’s landing location and distance achieved on the jump are almost dead-on when looking at left versus right. However, almost every other aspect of the jump sequence expresses extreme variance. The general stabilization window shows a lot of static left versus right, and the athlete’s ability to express movement freely and dynamically stabilize is different. Lastly, maximum velocity is achieved, and the peak velocity question is monumentally different from left to right.

Right Left Asymmetry
Figure 12. An athlete with an asymmetry issue between their left (yellow) and right (grey) legs.

Quantifying the Data

While the 1080 does provide real-time numbers on the cloud platform by simply using the trim tool to highlight the area of the jump that you want to look at, the next step is quantifying the data. You can export this trimmed version of a jump; however, there are more ways that you can pull this data:

  1. Go to the top right-hand corner of the web dashboard and click on export.
  2. From there, scroll down and select raw data.
  3. Once this is selected, you can select individuals or do a mass export of the data by clicking on one or all the athletes.
  4. Be sure to select the proper dates and exclude hidden curves and override trim. The “override trim” option applies more to sprinting than jumping, as the raw data export will export all data in the jump and not allow a trimmed section to be exported.

Go through and select the jumps you want to export before hitting the export raw data option. The system will only export the jumps that are selected in the athlete’s profile. If you do not double-check, you may miss jumps or, alternatively, export a massive amount of data that includes poor jumps and general static movement that may have been counted as a rep by the system.

Once you have the raw data exported, you will need to write a script that filters the data to identify the two peaks within the jump. These two peaks symbolize:

  1. The beginning of the window of dynamic stabilization.
  2. The max velocity achieved within the jump.

The 1080 system clips data at a sample of 0.003 per second—so, from here, we have our window that symbolizes the peak velocity quotient. Now we add up the accumulated time within this window by adding up every 0.003. After this is completed, it’s a simple equation, dividing our peak velocity achieved by the accumulated time within that window.

This testing procedure provides us with one of the most specific high-velocity measures possible to quantify a jump, says @DeRickOConnell. Share on X

This testing procedure provides us with one of the most specific high-velocity measures possible to quantify a jump. From the data provided, we can begin to extrapolate which of our athletes possess exceptional dynamic stabilization abilities as well as high-twitch mechanisms, likely enabling them to stand out from a velocity perspective within their sport. This information helps distinguish where our athletes stand compared to their peers while also allowing us to see what traits an athlete may lack.

From here, we can begin to organize training methods that address these weaknesses and allow optimal adaptations for the performance qualities that each athlete requires. As a secondary note, the data provided also gives us incredibly valuable insight to study throughout the return to play phases of training when an athlete is coming off of an injury.

Since you’re here…
…we have a small favor to ask. More people are reading SimpliFaster than ever, and each week we bring you compelling content from coaches, sport scientists, and physiotherapists who are devoted to building better athletes. Please take a moment to share the articles on social media, engage the authors with questions and comments below, and link to articles when appropriate if you have a blog or participate on forums of related topics. — SF

References

1. Parslew B, Sivalingam G, and Crowther W. “A dynamics and stability framework for avian jumping take-off.” Royal Society of Open Science. 2018;5(10). 10.1098/rsos.181544

2. Hallett M. “Volitional control of movement: the physiology of free will.” Clinical Neurophysiology. 2007;118(6):1179–1192. 10.1016/j.clinph.2007.03.019. Epub 2007 Apr 26. PMID: 17466580; PMCID: PMC1950571.

3. Lockie RG, Jordan CA, Callaghan SJ, et al. “The Relationship between Unilateral Dynamic Stability and Multidirectional Jump Performance in Team Sport Athletes.” Sport Science Review. 2015;24(5–6):321–344. 10.1515/ssr-2015-0022.

4. Liu K. and Heise G. “The Effect of Jump-Landing Directions on Dynamic Stability.” Journal of Applied Biomechanics. 2013;29(5): 634–638. 10.1123/jab.29.5.634.

5. Wikstrom EA, Powers ME, and Tillman MD. “Dynamic stabilization time after isokinetic and functional fatigue.” Journal of Athletic Training. 2004;39(3):247–253.

6. Colby SM, Hintermeister RA, Torry MR, and Steadman JR. “Lower limb stability with ACL impairment.” Journal of Orthopaedic & Sports Physical Therapy. 1999;29(8):444–454.

7. Hallett M. “Volitional control of movement: the physiology of free will.” Clinical Neurophysiology. 2007 Jun;118(6):1179–1192. 10.1016/j.clinph.2007.03.019. Epub 2007 Apr 26. PMID: 17466580; PMCID: PMC1950571.

Dan Pfaff

The Evolution of a Successful Track Coach with Dan Pfaff

Freelap Friday Five| ByDan Pfaff, ByDavid Maris

Dan Pfaff

Coach Dan Pfaff has tutored 49 Olympians including nine medalists, 51 World Championship competitors (also nine medalists), and five world-record holders. He has directed athletes to 57 national records across a multitude of events.

Dan has served on five Olympic Games coaching staffs in five different countries and nine World Championships staffs for six different countries. He has lectured in 27 countries and is published in over 20 countries.

He is the former Coaching Education Curriculum Chair for both the United States Track and Field Coaches Education Schools and the NACAC Caribbean Basin Project, as well as being the lead instructor for each organization at the Level I, II, and III schools.

Freelap USA: You have been coaching for a long time and are now heavily involved in educating other coaches. What are some of the key lessons you have learned throughout your career that have impacted your practice, and what are some of the differences you see in coach development now compared to when you were developing as a coach?

Dan Pfaff: Coach Tellez was a huge influence on me when I first started my college coaching career. He valued essentialism and therefore wrote simple programs that you could probably fit on the back of a matchbox! With Coach Tellez, the fundamentals were the fundamentals, and he didn’t waste any time with nonessential items. He didn’t do sprint drills or things that would probably fall under the category of ancillary work. He ranked the most important qualities, and those were the ABCs of his program.

When I was a young coach, education consisted of potentially going to a couple of coaching clinics each year and receiving a couple of journals each year, so the challenge was accessing information. Nowadays, I can open 80 web pages on any topic, and social media has exposed us to much more information from different coaches and practitioners and facilitated interaction with these people. So, the challenge now becomes critical thinking and filtering through the vast amount of information available, and it’s challenging to discern truth from misinformation.

Young coaches now have an endless menu list. How do you prioritize the elements amongst that and rank them in order of importance? After all, it’s not possible to train everything equally. I think it’s a lot more challenging now to identify the essentials and the fundamentals, and therefore coaches need the ability to think critically more than ever. Even if the exercise or concept has some validity, it needs to be cross-referenced against the athlete(s) the coach is working with, their stage of development, and the time of year. Questions need to be asked, such as: Do my athletes need this at the moment? Will adding this exercise be a game changer?

Being a scientist, I like to compile information over time, look at longitudinal trends and patterns, and see what’s working and not working. With social media, I think people fail to use critical thinking and don’t analyze using the scientific process. This leads to people diving into what I call “tribalism” and a polarized approach instead of viewing the training options as points on a spectrum. Most solutions exist at some point on this spectrum, and that point depends upon where you are with your athlete.

You should view training options as points on a spectrum: most solutions exist at some point on this spectrum, and that point depends on where you are with your athlete, says @PfaffSC. Share on X

I think it’s human nature to want to sound educated and well-versed. Because we have access to a lot of technology that can provide us with data and information in our coaching process, we get into the weeds and dive down rabbit holes, measuring all kinds of stuff that may not be necessary. I use the term “granularity” to describe how deep I need to dive to tackle an issue and find solutions. If I have a middle school girl accelerating, by filming the efforts from the side, the front, and behind, I can probably get 80% of the way there—so I don’t need a force platform, etc., and I can keep things relatively simple to make progress. Ultimately, I think this circles back to one of my earlier points on essentialism and what’s required for daily work operation.

Freelap USA: You once told me a story about Obadele Thompson being able to run six near-flat-out 120-meter runs without the pace dropping off, whereas Bruny Surin may struggle after two. This highlighted to me some of the ways in which sprinters are different, even though their event performances may be very similar. What are some of the ways you categorize your sprinters, and how might you coach these sprinters differently?

Dan Pfaff: To start with, I may make a basic judgment of a sprinter based on their anthropometrics. How tall are they? What is the length of their levers like? How muscular are they? From here, I can make some educated guesses about the way they move, such as if they are more muscularly or elastically driven.

So Obadele Thompson was very elastic, he was short, slight, and didn’t lift weights, yet he had the second- or third-longest stride length out of any sprinter on the professional circuit at that time. This enables us to deduce that he covered ground via elastic utilization and connective tissue output. On the other hand, Bruny Surin was taller and more muscular, with a background involving weight training—and previously in his career, he had been a triple jumper—giving him the tools to use a more muscularly driven strategy when sprinting.

When coaching and assessing athletes, I look at zones of the race: blocks, acceleration, speed, special speed endurance, and alactic runs. To clarify, special speed endurance would be classified as 70- to 90-meter efforts at top-end speed, and alactic runs as 120- to 150-meter efforts. So, I have all these categories, and within each category, I look at kinematic data like excursion angles out of the blocks, times, and outputs.

Everybody will address each of these categories, but I look at ranges of individual volumes and what the upper and lower limits of these volumes are for each athlete. What’s the minimum we’ve got to do to get the desired biological and skill effects, and after how many efforts does quality start to become compromised? I like to call these “ceilings” and “basements.” Using my own observations and the research of others and speaking with colleagues, I started to see where these limits were. Most experienced sprinters who have been well coached could do between 15 and 18 block starts to 20 or 30 meters without a big drop-off in performance or alteration in mechanics.

So, this would be the ceiling—but at the same time, I know I probably need to do six to eight of these, or else we will start to see a performance decay over time due to a lack of practice targeted toward improving this skill. Muscular sprinters tend to be better accelerators, whereas elastic sprinters tend to be able to maintain their speed better and handle more volume on the longer distance reps.

Oba would struggle to do 15 block starts, and I think the most he ever did was around 10. But if you put him in speed, special speed endurance, or alactic runs, he could go all day! By contrast, Bruny could do maybe 21 block starts with no performance drop, but if you asked him to do four 150-meter runs, there would be a sharp decay in the times.

If I ever have an athlete who can’t meet the typical minimum required volume for a particular zone of the race, I make a note of that gap, and over time we work on it. An easy mistake to make is to identify a weakness and then go all-in on that while ignoring the strengths. Then the strengths start to become average, and now everything is average!

An easy mistake to make is to identify a weakness and then go all-in on that while ignoring the strengths. Then the strengths start to become average, and now everything is average! Share on X

I think it is possible to shift the genetic expression with training bias. For example, had Oba lifted, he might have become what I would call a hybrid sprinter, muscularly driven at the start and more elastic at the top end. But he didn’t want to explore that, so he remained very elastically biased.

This raises a very important point regarding the emotional tendencies of the athlete and whether they are comfortable stepping a long way outside of their comfort zone. People are naturally drawn to wanting to do what they’re good at, and it’s generally less comfortable attempting things that don’t come as naturally. However, it is crucial to be aware of what effect emphasizing one aspect of the race may have on the other aspects of the race.

For example, what impact does an intervention with the start or early acceleration have on an athlete’s execution later in the race? It’s possible for programs to get out of balance, and I saw this in the UK, where there was a significant emphasis on the 60m, and athletes got pretty good at running fast 60s, yet the 100m results often didn’t equate.

Freelap USA: In the mid to late 1990s, you had an outstanding sprint group including the likes of Donovan Bailey, Bruny Surin, Rohsaan Griffin, Obadele Thompson, Kareem Streete-Thompson, Nobuharu Asahara—the list is almost endless. Is there any technology available now that you wish was available then that you think would have benefited those athletes? Are there any challenges associated with having such easy access to technology nowadays?

Dan Pfaff: I would have loved to have some timing gates and a smartphone/tablet instead of using a stopwatch and a big VHS camera! In this scenario, we could watch the film pretty soon after the workout.

When I first started coaching, though, we’d use an 8mm movie camera, and you’d have to take it to the photography shop and wait two weeks for it to be developed—by the time we got it back, we were likely on to a new problem and had resolved this one. The immediate feedback available with smartphones and tablets is great, but you do have to be careful because it allows for a greater volume of feedback, and the athlete can easily become confused if they receive too much of it after each run.

The immediate feedback available with smartphones and tablets is great, but you have to be careful because it allows for a greater volume of feedback, which can confuse an athlete, says @PfaffSC. Share on X

I think it again operates on a spectrum, and with the Paralympic athletes I’m currently working with remotely, we do a combination of Zoom sessions and delayed video reviews, and the different athletes prefer different styles of feedback. Some like to receive instantaneous feedback, whereas some prefer it to be delayed; some like lots of feedback, and some don’t.

With remote coaching, we have a couple of technical themes that we focus on at any one time, and delayed feedback often allows me to see how they’re progressing in that theme and with any cues with less noise than if there was feedback after each rep. So, while it may seem like a lack of immediate feedback is a limitation, there are some positives to this setup. I like to look at trends and patterns and then consider what the average performance is. If we’re going to do 10 block starts, and I jump in with feedback after the first one, then I’m not reacting to the mean; but if I watch all 10 after the session is complete, then I can base my judgment and feedback on the average trends I see.

When I was in the UK, I wouldn’t provide feedback with some of my jumpers until the jumps portion of the session was complete because if an athlete is in a stadium with 80,000 people, it is nearly impossible to hear the coach! Therefore, some skills relating to autocorrecting are necessary, and this type of approach helped to facilitate that.

The performance feedback from timing gates needs to be managed carefully as well. When I was coaching my sprinters, I very rarely told them their times until after the workout. If they knew their times after each rep, the subsequent rep would likely become a race to beat that time. You’d end up with a session where every rep is a race, and mechanics would become compromised, or the technical focus we had that day would go out the window. Instead, I would give them technical feedback and then marry that with their times and say something like, “When you did this correctly in rep three, look how much better your time was.”

I find assisted sprinting interesting, and Hakan Andersson has years of data with MuscleLab that have led him to progressions he uses so that the overload is very gradual. I think a risk with assisted sprinting is that, again, you can go all-in, and then, in an effort to keep up, the athlete lets their mechanics go out the window. At such high intensities, the risks associated with bad mechanics become heightened, making injuries more likely and more serious. Ineffective patterning can also become an issue—so athletes now hit similar speeds in a race and begin to move with less optimal mechanics. Therefore, I think it’s imperative to implement any form of assisted sprinting systematically and gradually and consider factors like the time of year before doing so.

At the other end of the spectrum, in Austin, at the University of Texas, we used hills for resisted sprinting on acceleration days. With Baton Rouge being so flat, this wasn’t possible at LSU, but we used these things called Accelerators, which was a system developed by a Canadian company using flywheel resistance to provide a similar stimulus.

Related to technology in coaching, and again referring back to my point about Tellez and the essentials, we always tended to be so busy mastering the As, Bs, and Cs that we never got to Ls, Ms, and Ns. Most of my athletes had things like medical/health problems or mechanical issues, so I wasn’t too worried about implementing something like assisted sprinting because I always felt like we had bigger concerns that needed to be addressed.

Freelap USA: What common technical errors do you see with sprinters?

Dan Pfaff: First, I should say I’m not a hard model guy, but I am a bandwidth guy, so I look at the kinematic bandwidths in each phase of the gait within each phase of the race. Once I’ve found the acceptable ranges with regard to the different aspects of technique, I assess whether or not an athlete sits within that range. These ranges can also vary depending on whom you are coaching, so with youngsters, you can have a lot more bandwidth because they’re more resilient, but a 32-year-old world-class veteran has much less wiggle room.

For example, an issue I’ve noticed in maximum velocity mechanics is the lower leg casting out after knee block. Research has shown that the risk of a hamstring injury dramatically increases once the lower leg casts out beyond 30 degrees to the vertical. While a young, elastic athlete may exceed those 30 degrees and come away unscathed, an older, more muscular sprinter is less likely to do so, so your population can determine where to focus some of your efforts, technically, as a coach.

One of the most common issues I see relates to gait control in upright sprinting. By that, I mean controlling the path of the movement as the foot travels from the backside to the frontside, and what happens behind the body is related to what happens in front of the body. For example, if you tend to over-push horizontally, which takes place behind the center of mass, then you also tend to reach out, which takes place ahead of the center of mass, so the path of the movement of the foot becomes more like an elongated ellipsis as opposed to a more circular shape. I’ve noticed this to be common when athletes are under pressure at top speed, so they try and press or push harder, and the ratio of flight time to contact time gets out of whack.

In starting, the front leg shin roll is a big issue. This can have a knock-on effect on what happens later in the race, as it gets an athlete in positions that are very challenging to get out of, says @PfaffSC. Share on X

In starting, one of the biggest issues I see is the front leg shin roll, and this can have a knock-on effect on what happens later in the race, as it gets an athlete in positions that are very challenging to get out of. So, as the athlete moves forward after reacting to the gun, the front knee drops, and they end up with a very acute angle between the shin and the ground. This is often not sustainable, so the athlete has to abruptly alter their posture to avoid falling and therefore break the line of attack and bend at the waist. This leads to another issue I see a lot of, which is hip hinging during acceleration; too often, due to some preconceived notion or through being told to “stay low,” athletes try to accelerate with their head and torso down.

In terms of how to fix a lot of these issues, that comes down to the art of coaching and how cues and concepts are communicated. I would say, though, that once the fundamental technical concepts are in place, many issues are often taken care of.

Freelap USA: Can you take us through a typical weekly training cycle for early specific prep for your “super group” in the late ’90s? How has your training evolved since then, and can you outline some of the thought processes that go into your training design?

Dan Pfaff: We did four main workouts: Monday, Wednesday, Friday, and Saturday, and the days between were largely focused on recovery to enable those main days to be completed with high quality. I structured the Friday and Saturday back-to-back as it mirrored what they may have had to experience at major championships with rounds.

    Monday – Acceleration 3–6x3x10m–30m

    Tuesday – Recovery/Technical refinement

    Wednesday – Speed 3–8 x 40m–60m

    Thursday – Recovery/Technical refinement

    Friday – Acceleration 3–6x3x10m–30m

    Saturday – Special speed endurance 2–4x70m–90m or work capacity 4–6x120m–150m, and the 200m athletes may go out as far as 350m for the first run of a breakdown and complete somewhere between two and four runs depending on the time of year, etc.

Our biological systems don’t operate based on a calendar or a clock, and the time-based guardrails that own us are artificial. I see value in being fluid with my planning to allow for this, says @PfaffSC. Share on X

At this time, I was battling between the ideas I’d learned from the Eastern Bloc systems and what I’d learned from Coach Tellez’s systems and trying to develop a system that made sense to me. Therefore, we probably trained too many days a week and too many weeks before we unloaded.

During this era, we would typically train for three weeks and then unload by pulling some days out of the fourth week. In contrast, during the off-season now, about 50% operate on a two-week loading phase before a one-week unloading phase, while the other 50% operate on the three-day rollover before everybody goes to a three-day rollover during the competitive season.

For example, Monday may be the acceleration workout, and we do not get to the speed workout until Thursday, and then we may run a special speed endurance workout the following Monday before completing the work capacity runs that Thursday. The beauty of it is that it can be expanded or contracted to fit the athlete’s needs.

Back in the ’90s, the Golden League meets were often on a Friday night, so the athletes might have done a block start workout on the Monday, and some who liked to work back to back would do the speed workout the next day. Donovan, however, didn’t like going back to back like that, so he wouldn’t do the speed workout until Wednesday. Thursday would then be a pre-meet, and Friday would be the race, so the work capacity work wouldn’t take place until the following week.

The weekly density pattern was often dictated by health, recovery, access to therapy, etc. Obadele Thompson, Greg Rutherford, and Nobuharu Asahara had large injury histories, so to help manage that, they would have a hard workout day. Then the next day would be complete rest before a pretty big therapy day, and then they could do the next workout the following day. In this situation, the recovery days may be dropped, so some of those days off were literally days where the athlete might lie in bed all day, and some may have been a light warm-up, and I classified these as complete rest or active rest.

It’s important to realize that our biological systems don’t operate based on a calendar or a clock, and the time-based guardrails that own us are artificial. I see value in being fluid with my planning to allow for this. To make that point, many athletes like to train back to back or 48 hours apart, but if Oba had three or four days off between sessions, he was money!

There’s a myth that if an athlete trains harder or more frequently than an opponent, they’ll improve and increase their chances of beating them, says @PfaffSC. Share on X

There’s a myth that if an athlete trains harder or more frequently than an opponent, they’ll improve and increase their chances of beating them. This may work for very young athletes, but eventually, it levels off, and ultimately, this line of thinking can become the enemy. So weekly training cycles must be carefully thought out, and progressions must be moderate and systematic, with segues to higher training loads; otherwise, there will likely be issues developing talent and keeping athletes healthy.

When I was in the UK, the young athletes in the club system typically trained on Tuesday and Thursday evenings and one morning of the weekend. If they were then identified as talented, they were often put straight into a six-day-a-week training program and would end up injured or burned out and out of the sport. Ultimately, I think it pays dividends to take a cautious approach to programming, and keeping the athlete healthy has to be the number one priority!

Since you’re here…
…we have a small favor to ask. More people are reading SimpliFaster than ever, and each week we bring you compelling content from coaches, sport scientists, and physiotherapists who are devoted to building better athletes. Please take a moment to share the articles on social media, engage the authors with questions and comments below, and link to articles when appropriate if you have a blog or participate on forums of related topics. — SF


  • « Go to Previous Page
  • Page 1
  • Interim pages omitted …
  • Page 27
  • Page 28
  • Page 29
  • Page 30
  • Page 31
  • Interim pages omitted …
  • Page 164
  • Go to Next Page »

Primary Sidebar

Latest Posts

  • Building a Better High Jump: A Review of Stride Patterns
  • How We Got Our First Sprint Relays to State in Program History
  • Science, Dogma, and Effective Practice in S&C

Topics

  • Changing with the Game
  • Game On Series
  • Getting Started
  • high jump
  • Misconceptions Series
  • Out of My Lane Series
  • Rapid Fire
  • Summer School with Dan Mullins
  • The Croc Show
  • track and field
  • What I've Added/What I've Dropped Series

Categories

  • Blog
  • Buyer's Guide
  • Freelap Friday Five
  • Podcasts

COMPANY

  • Contact Us
  • Write for SimpliFaster
  • Affiliate Program
  • Terms of Use
  • SimpliFaster Privacy Policy
  • DMCA Policy
  • Return and Refund Policy
  • Disclaimer

Coaches Resources

  • Shop Online
  • SimpliFaster Blog
  • Buyer’s Guide
  • Freelap Friday Five
  • Coaches Job Listing

CONTACT INFORMATION

13100 Tech City Circle Suite 200

Alachua, FL 32615

(925) 461-5990 (office)

(925) 461-5991 (fax)

(800) 634-5990 (toll free in US)

Logo of BuyBoard Purchasing Cooperative. The word Buy is yellow and shaped like a shopping cart, while Board and Purchasing Cooperative are in blue text.
  • Facebook
  • Instagram
  • Twitter
  • YouTube

SIGNUP FOR NEWSLETTER

Loading

Copyright © 2025 SimpliFaster. All Rights Reserved.