There’s fast, and there’s fast, fast! When creating testing procedures, we should always strive to be as specific to the sport as possible—and when the sport demands the need for speed, we should follow suit with Dominic Toretto, buckle our racing harnesses, hit the redline on the tachometer, and get there as quickly as possible. Along with specificity comes efficiency. Specificity and efficiency are the name of the game when conducting tests in the team environment, especially during intense times such as training camp, when numbers are enormously high and time is tremendously low.
Another cornerstone of testing is that it should also be used as a training mechanism throughout the year in the performance end as well as helping in the return to play and reconditioning spectrums. Ensuring that tests are consistently performed enables us to collect and monitor data at a more precise rate. This also allows the athlete to perform the test without a learning curve and with the understanding that it translates to sport. This saves us time convincing athletes why we perform the test and increases enthusiasm and buy-in. Bottom line: any time we can bring together transferability and efficiency within the testing curriculum, that’s a win-win for the coach and the athlete.
We should always aim to deviate as little as possible in the training stresses the athlete experiences in the weight room and their sport, says @DeRickOConnell. Share on XWe should always aim to deviate as little as possible in the training stresses the athlete experiences in the weight room and their sport. A great goal to strive for is a synchronized simulation from training to sport. By doing this, we can provide the athlete with an environment that allows maximal transfer, reduction of injury, and easier return to play transitions—the popular slogan “training is testing, testing is training” carries much validity.
Flying Leaps and Braking Demands
For birds, “jumping to takeoff is an explosive behavior with the goal of providing a rapid transition from ground to airborne locomotion. An effective jump is predicated on the need to maintain dynamic stability through the acceleration phase.”1 Parslew et al. defines a generic jumping system as comprising three functional components: body, leg, and foot.
- The body refers to the mass group, including the head and trunk.
- The leg is an extensible member that can do mechanical work through linear and rotational displacements of the body and foot.
- The functional foot provides a distributed mechanical interface between the end of the leg and the ground.
The term “foot,” chosen here for brevity, encompasses the front and rear digits in the context of avian morphology. The functional leg in a jumping system is characterized primarily by its stroke length, i.e., the maximum length it can extend, and the general force and power characteristics of the actuation system as a function of displacement and velocity.1
While sequential rationality may appear to be abstract, the concept described through avian takeoff theory does illuminate an interesting juxtaposition as to the importance of dynamic stabilization in humans. I found the work done in the article to be interestingly outside of the box yet applicable when thinking about the jump takeoff of our athletes. The goal of our athletes when jumping is to display the ability to reciprocate massive eccentric braking forces with the ability to achieve maximum velocity as quickly as possible.
Movement, in the final analysis, comes only from muscle contraction. Muscle contraction is completely controlled by the alpha motoneurons in the spinal cord. When the alpha motoneurons are active, there will be movement. The activity of the alpha motoneurons is a product of the different synaptic events on their dendrites and cell bodies. There is a complex summation of EPSPs and IPSPs, and when the threshold for an action potential is crossed, the cell fires. There are a large number of important inputs, and one of the most important is from the corticospinal tract, which conveys a large part of the cortical control.
Such a situation likely holds also for the motor cortex and the cells of origin of the corticospinal tract. Their firing depends on their synaptic inputs. And a similar situation must hold for all the principal regions giving input to the motor cortex. The activity of any cortical region will depend on its synaptic inputs. Some cortical motor inputs come via only a few synapses from sensory cortices, and such influences on motor output are clear. Some inputs will come from regions, such as the limbic areas, many synapses away from primary sensory and motor cortices. At any one time, the activity of the motor cortex, and its commands to the spinal cord, will reflect virtually all the activity in the entire brain.2
Along with this massive demand for braking, a component of stability is necessary. When assessing the mechanistic deficiency, we tend to see that the instability comes from a tipping phenomenon. Share on XAlong with this massive demand for braking, a component of stability is necessary. When assessing the mechanistic deficiency, we tend to see that the instability comes from a tipping phenomenon. This is witnessed through a deviation in the center of gravity when the knee travels outside the optimal functional range of the foot. The athlete’s foot and ankle structure efficiency plays a massive role during this preflight phase of movement. Along with this comes a demand for the athlete to be able to push through the ground and own the movement. For more information, feel free to refer to “Triphasic Speed Training Manual for Elite Performance: Part 1 The Spring Ankle Model” (which I wrote along with Cal Dietz and Chris Korfist).
The stabilization demanded during this preflight phase is different from traditional stability training, which may involve athletes training on unstable surfaces with the goal of activating stabilizers in the core and trunk that focus on low-velocity co-contraction. While this variation of training has a list of benefits, especially for athletes returning to play, the largest deficiency in applying training types like this is that classic stability training does not elicit a significant enough stress force factor to allow the athlete to handle the mechanical tension they will undoubtedly face. After all, “Stress is the language of the cell.” The body must be able to communicate with and transduce force and then maintain structural integrity throughout the mechanotransduction process.
Athletes participating in team sports must cut, sprint, and jump in multiple directions. Dynamic stability and leg power are two elements that influence an athlete’s ability to do this effectively. With regard to dynamic stability, this is the ability to maintain balance while transitioning between static and dynamic movement states. Athletes with good dynamic stability should be able to maintain a stable center of gravity during sport-specific movements, such as multidirectional sprinting.3 With this in mind, it is essential to identify and define an appropriate dynamic stability assessment for use in team sport athletes.
The stress applied—coupled with the higher co-contraction rates—makes it clear that high-force braking must be accomplished through high-velocity/high-force training. To gain increases in dynamic stability (typically calculated from the diminishing oscillations of ground reaction force mechanisms over time), we need to enhance the body’s ability to handle high force and increase synaptic transmission, allowing for larger impulse and a larger joint integrity. Analysis of the problem shows that the stability margins during jumping are actually very small, and stability considerations play a significant role in the selection of appropriate jumping kinematics.1
Let’s keep in mind that transitioning through the propulsion phases of a single jump is the most energetically demanding phase of takeoff—this is where the largest amount of acceleration forces are placed on a single limb. These energy forces are altered when tasked with performing repetitive jumps, but in this scenario, we are looking at one maximal effort jump.
The goal of the testing process is to help coaches not only quantify maximum velocity achieved right versus left but also to dive into the athlete’s ability to create this impulse. In a high-velocity-based sport where athletes need to hit 80% of max velocity incredibly quickly—but rarely touch top speed—it is vital that we dig into the quotient that this situation creates. Max velocity is essential and the most exciting component to discuss, but it is the time it takes to achieve max velocity that is even more central, especially in high-velocity sports such as hockey or within position-specific roles in football, track and field events, and other sports. The demands of the sport dictate that you don’t have to get to top speed; you need to get to max velocity as quickly as you can on a repetitive basis: It’s not how fast you are; it’s how fast you get to how fast you are that sets a player apart.
It’s not how fast you are; it’s how fast you get to how fast you are that sets a player apart, says @DeRickOConnell. Share on XWithin the fastest sports in the world, there are still variables of speed frequently overlooked by the public. This has become common as broadcasts increase fan interaction by repeatedly displaying top speeds achieved during game play to the viewer at home. To achieve the velocities that the fans see, there are obvious braking components coupled with instantaneous acceleratory demands that must be trained that supersede “functional balance and stabilization” and perturbation work within healthy high-speed populations. Game flow may also play a large role in the top speeds accomplished.
Fast, Fast
When looking at an athlete’s ability to create high velocity in a short time, it’s very useful to be able to do this without planar or movement restrictions. This allows the athlete to perform the movement with maximum intent without having to process a specific landing location. This processing demand can downregulate their ability to create maximum force freely. A prime example of this is having an athlete perform a lateral jump onto a force place, processing the athlete’s ability to transition from a dynamic action to a static position and often reactively out of that given position. This is performed with force plates as a means to closely analyze the athlete’s support basis throughout phases of movement.
While we can, in fact, gather some really great information on the athlete, asking them to land on a precise point after maximally accelerating through the air is nearly impossible and, unfortunately, will lead to a downregulation in dynamic intentions. There are times that landing dynamics can be altered during training, such as when asking the athletes to perform calibrated plyometrics (which are an excellent tool for young developing athletes and an invaluable tool for return to play as a way of allowing athletes to understand how to express maximal output with specific intentions).
Jump performance is often used to indirectly measure leg power, given that power involves the ability to produce force quickly. This is a necessary component of an ideal jump: there is a complex interaction between physiological, biomechanical, and technical factors that interact within multidirectional jumping and power-based actions.
Research has documented how lower-body strength, rate of force development, elastic energy use, leg stiffness, and proper coordination and technique can all contribute to successful jump performance. This would be true for both bilateral and unilateral jumps. However, during a unilateral jump, athletes must rapidly express their strength through force development while in single-leg support. This places greater stress on the capacity to maintain stability while completing the jump.
The relationship between dynamic stability and unilateral jump performance and power has received limited analysis within the literature, however, and the window of dynamic stabilization can influence these elements.3 One of the most important aspects of sport is freedom of movement, thus highlighting the significance of quantifying this expression of force production with as few limitations as possible. This is where the 1080 Sprint can play a crucial role.
Practical Application
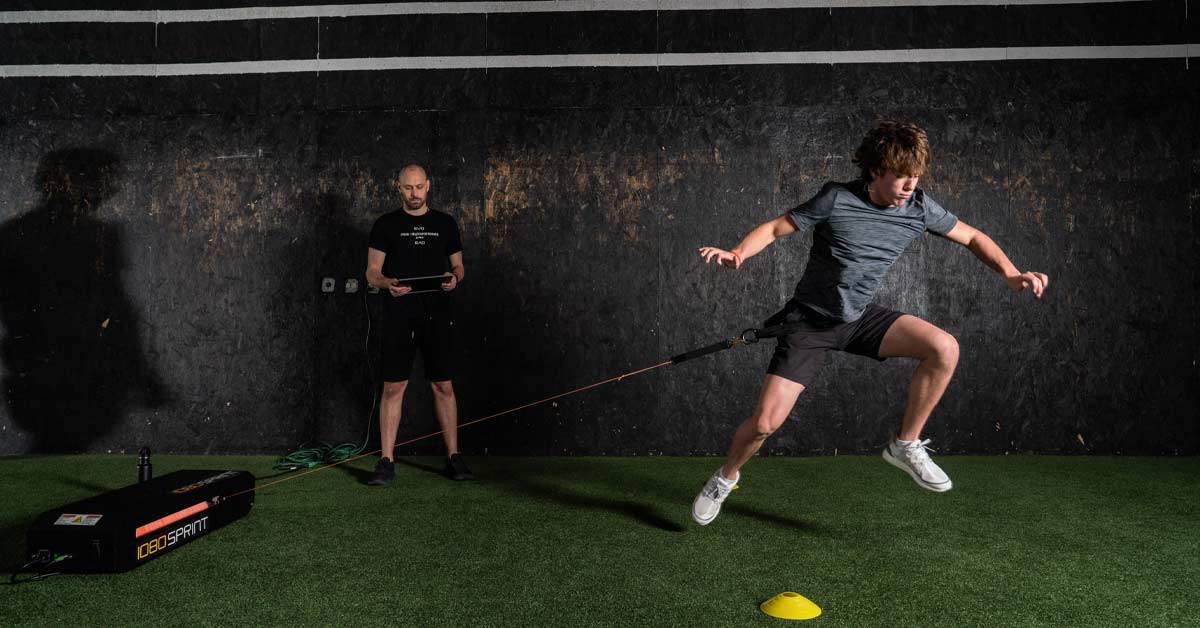
The 1080 Sprint allows us to test athletes in all planes of motion with complete freedom of movement. Without getting into specific metrics that the 1080 Sprint can provide, it’s fair to say this feature alone makes the device crucial to performance and reconditioning programs.
The 1080 Sprint allows us to test athletes in all planes of motion with complete freedom of movement. This feature alone makes the device crucial to performance and reconditioning programs. Share on XTo set up for the lateral jump test, the athlete stands lateral to the 1080 Sprint. From here, the athlete is cued to lift the outside foot for approximately one second to allow them to stabilize within the position. This also allows for a clean and clear reading when jump profiling the athlete. We also want to limit any cheating in the position, in which the athlete doesn’t hold the single-leg position long enough to get a clean single-leg effort.
- You will see this often with younger athletes and athletes with poor structure and function within the foot complex.
- You’ll sometimes see the athlete lift the foot off at the last second and use the momentum to cheat through the jump.
Once the athlete has stabilized, they initiate performing the jump. To increase safety, always have the athlete land on two feet. With the settings on the 1080 Sprint, the athlete can safely transition through all phases of the jump, land, and simply walk back to the starting line to initiate the next jump. Typically, the athlete will use 1–2 kilograms of concentric and eccentric resistance with maximal speed settings on the concentric. The eccentric speed can be placed at whatever the coach deems appropriate as the athlete walks back to the starting point.
We can begin to quantify and compare differences in multiple planes of motion with lateral and forward jumping, as it is imperative that we assess athletes from all planes of free motion since this is where sport is played. From here, we can also dig into vertical velocity expression versus horizontal and lateral with the use of force plates as a secondary protocol. Reliability, repeatability, and standardization are also important when really digging into the presented data, as there are kinematic, physiological, and structural components to multi-planar high-velocity movement.
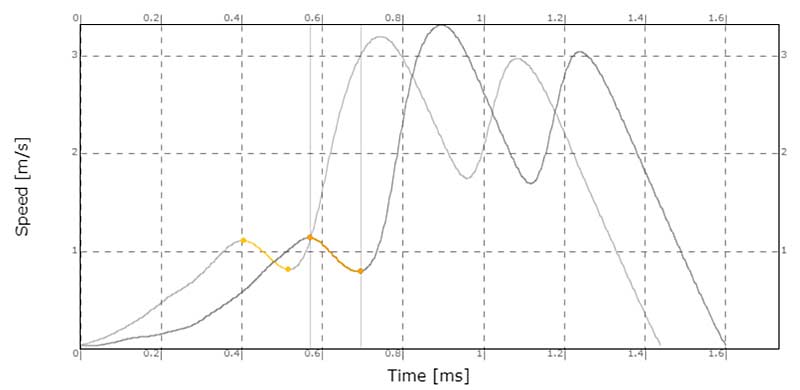
Let’s begin by looking at a single-leg broad jump from a general perspective. The two graphics included are the same jump; however, the data is displayed in two different manners: the graphic on the left is displayed in relation to distance and velocity, and the graphic on the right indicates speed over time.
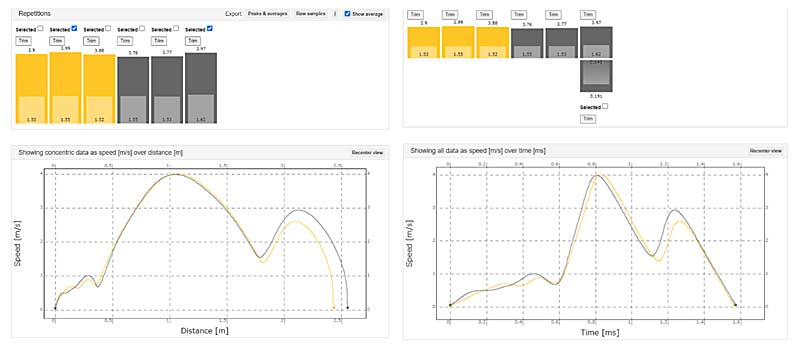
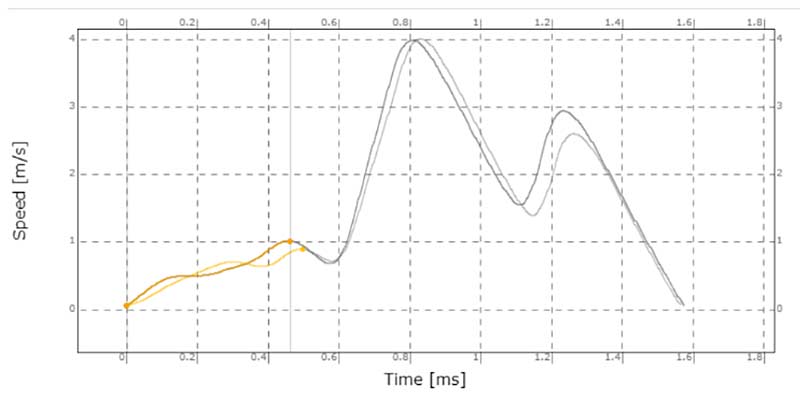
The first image is the primary graphic used when glancing at a jump profile. I have included the second to clarify the noise or general stabilization that occurs when performing a jump. We can see with the primary image that there is a moment where the athlete displays a slow curve trending up, represented by static in the smooth flow of the line. This is where general stabilization occurs in the jump. From a phase of movement perspective, this is when the athlete begins to stand on one foot, starting their “one count” and finding stability and breath control in the static position on a single leg before the explosive effort to follow.
If we zoom in and look closely, we can use our secondary graphic for visual feedback. During this repetition, the athlete appears to have taken approximately half a second to find general stabilization before transitioning into the next phase of the jump.
From here, we can transition into the next phase of the jump profile, the athlete’s window of dynamic stabilization, a product of ground reaction force. With regard to dynamic stability, it is the ability to maintain balance while transitioning between static and dynamic movement states. Athletes with good dynamic stability should be able to maintain a stable center of gravity during sport-specific movements, such as multidirectional sprinting.3 It is important to identify and define an appropriate dynamic stability assessment for use in team sport athletes. This window is crucial to monitor as an athlete progresses through the various stages of return to play and is significantly affected by fatigue.
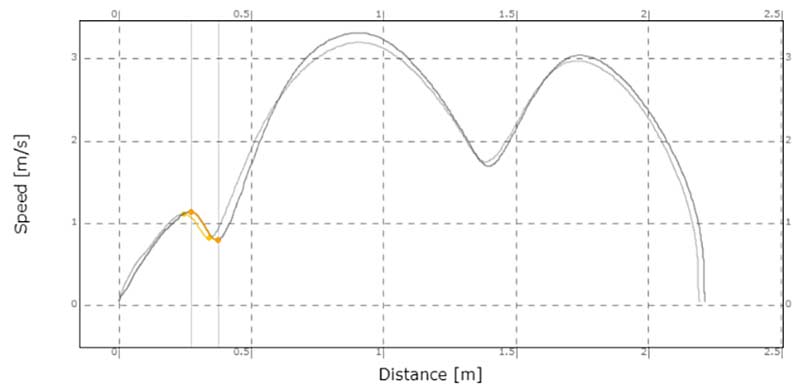
What becomes interesting is that this athlete, a young but very well-trained elite athlete, has performed this test as part of their training over the off-season, so we see very quickly that their left versus right—when comparing positional kinematics, timing, and eccentric distance (distance pulling down into the stabilization window), and velocity—are almost identical. However, we see a much larger discrepancy from left to right when we quickly examine the athlete’s general stabilization window.
The next phase of the jump that we can look at can be referred to as the peak velocity quotient. This simple formula encapsulates what is so incredibly important for high-velocity athletes:
- Peak Velocity ÷ Time to Peak Velocity
This is where things become extremely exciting when comparing athletes to each other, and here the work of Rolf Ohman comes into context. Ohman is the inventor of the original 1080 technology and has been an elite track and field coach for many years. For more information on him, check out this podcast on Just Fly Sports. The most important factor in high performance is acceleration—over power and any other metric. According to Ohman, the best athletes in the world are those who are extremely active within the first 100 to 150 milliseconds of an impulse. Therefore, we should train and perform tests that incorporate this perspective and require high coordinative speeds.
The premise of Ohman’s Elastic Index (EI) is that the athlete must store as much elastic energy as possible so that once they hit the stopping point of the movement, the joint serves as a springboard jolting the athlete into the flight phase. The EI is drastically different from athlete to athlete. General joint stiffness can be termed as an athlete’s ability to accelerate maximally during deceleration of the eccentric phase. Through both the eccentric and concentric phases of a movement, slight deviations in acceleration cause enormous changes in the movement.
As Ohman has highlighted in his work, it is crucial that we dive deep into assessing the athlete’s ability to express movement in kilograms of body weight over time. In contrast, standard power protocols focus more on an athlete’s overall ability to move load in comparison to body weight. If an athlete can accelerate faster in a sport that demands repetitive high-velocity movement, they will win every time. This approach can carry over into the weight room through the use of hyper-speed exercises, oscillating exercises, and partial reps—these forms of exercise help to increase coordination of the neuromuscular system. In turn, we expose the athlete to adaptations with the same coupling times they experience in sport.
As Ohman has highlighted in his work, it is crucial that we dive deep into assessing the athlete’s ability to express movement in kilograms of body weight over time, says @DeRickOConnell. Share on XPower, force, speed, acceleration, and almost any other metric of performance are derivatives of velocity. Normal mass, once accelerated, gets lighter and lighter, making the first millisecond of movement vital to assess. This approach to testing cuts everything else out and looks at the athlete’s ability to create high velocity as quickly as possible.
This is especially important when looking at high-velocity-based sports. There are two ways to approach quantifying this. Both trains of thought are applicable and largely dependent on what the sport scientist and/or strength coach are looking for and their philosophy.
- We can quantify this ratio by looking solely at the time spent from the window of dynamic stabilization and braking point into the flight phase to max velocity. Using the trimming tool, figure 5 is what we are looking at if using this approach.
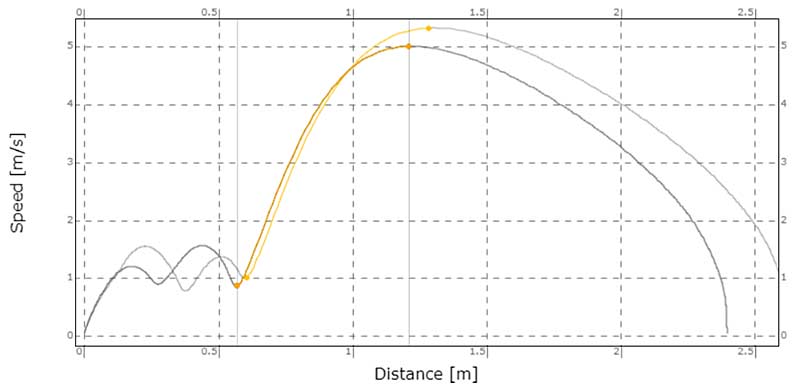
- Strangely enough, the athlete has a low training age and was performing the single-leg broad jump test for the first time. As you can see, he achieves a very impressive max velocity of over 5 m/s, and his acceleration curve is impressively steep. You can also see by his general stabilization window that he needed to spend a little extra time getting coached up to allow himself to become stable, as he wanted to bounce and cheat right into the jump.
- When dissecting the jump, while velocity is our driving factor in the equation, we still want to consider what it takes for an athlete to create this high impulse of velocity. To do this, we must also consider what is happening prior to reaching max velocity. While flight velocity is king here, reactivity, ground reaction force, and the accumulative window in which these take place are very important. This will tell us a lot about how the athlete needs to train and helps shed light on exactly why this peak velocity quotient is such an essential piece of information within the performance and return to play paradigm.
Stories in the Data
When examining the single-leg broad jump test of two athletes of similar height, weight, and age—both of whom spent extensive time in high-caliber Division 1 hockey programs—we can see some astonishing differences hidden in the data. If we were to look at the power and max velocity achieved from a statistical perspective, we would find that these two athletes are very similar.
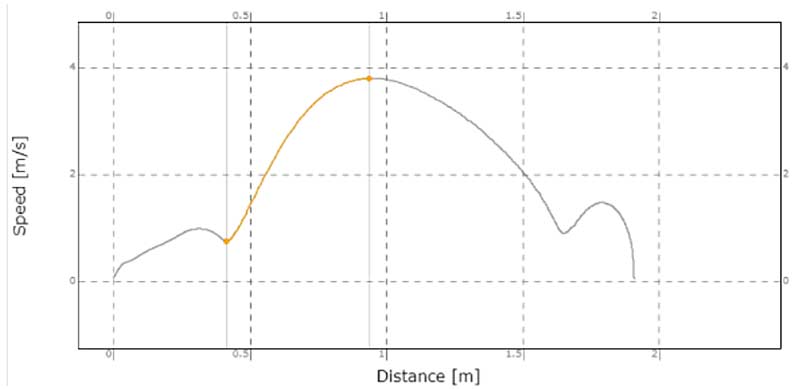
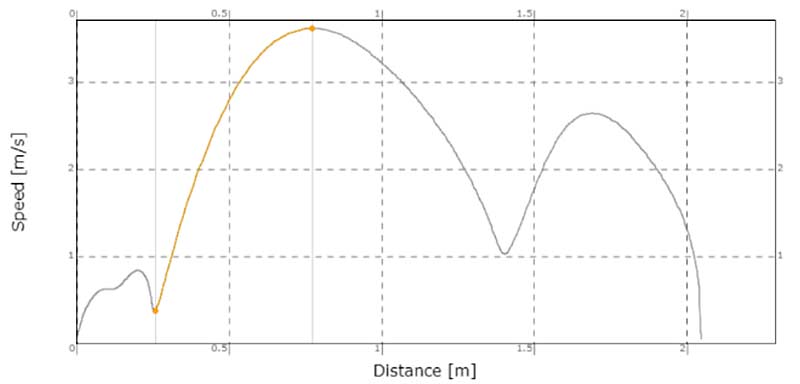
In fact, athlete A would register slightly higher in these categories, but it’s incredibly close. But let’s look at the jump profile of athlete B. We can see that while the max velocity achieved by both athletes is pulled out of the raw data as the same, there is a distinguishing, clear difference between the way they both achieve this mark.
If we expand the peak velocity quotient to analyze our window of dynamic stabilization coupled with the peak velocity achieved, these two athletes are not even on the same planet as one another.
The time that accumulates while athlete A reaches peak velocity in the jump is nearly double that of athlete B. This leak in energy impacts not only the acceleration of the flight phase but also athlete A’s inability to dynamically stabilize, create ground reaction force, reciprocate this force into acceleratory trajectories, and achieve max flight velocities. Therefore, it is crucially important that we dissect the entirety of the jump.
The data extracted will quantify and solidify what is happening between the two athletes. Still, the eye test live and in person is undeniable: athlete A possesses very little sharpness to any phase of the jump, while we can quickly see that athlete B produces aggressively rigid and sharp peaks at every phase of movement.
As a side note, this is a perfect time to address the second drop shown in the jump post peak velocity. As the peak velocity quotient of the athlete and freedom of movement are our focus within the test, the athlete is jumping with only one or two kilograms of resistance. The second teardrop within the jump profile signifies a moment of slack as they decelerate, and the machine catches up with them. Coincidentally, we can see how much later in distance this occurs for athlete A, while both athletes jump a similar distance.
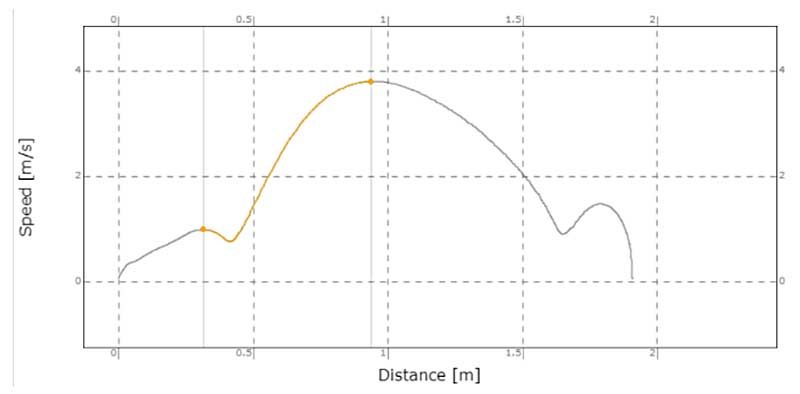
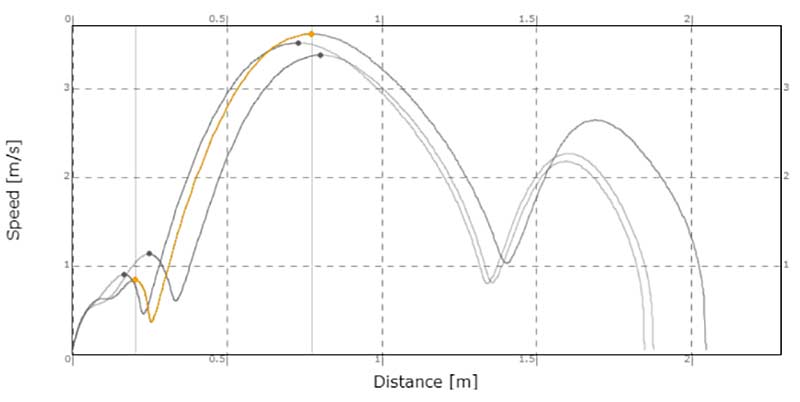
Additionally, we can examine the left versus right symmetry index and present the information from a data perspective and a visual feedback viewpoint. This is incredibly useful during the return to play and reconditioning phases. In young athletic populations and individuals with compromised joint stability, time to stabilization (TTS) is considered a more functionally relevant stability assessment than static-based measures.4
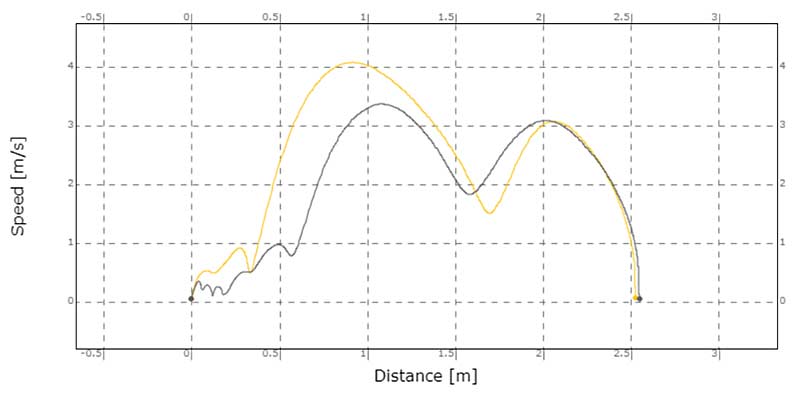
In the graphic below (figure 10), we can see a left (yellow) versus right (grey) leg comparison of an athlete. Right away, we can see that this athlete has difficulty transitioning through the various phases of the jump, notably possessing an inability to pull themselves down eccentrically and exhibiting poor dynamic stabilization on the right leg.
Strangely enough, if we were to quantify the max velocity achieved on a right leg versus a left leg test, we would find that this athlete produces the exact same max velocity on each side. A quick analysis would indicate that they did extremely well on the test. However, when we look at the window of dynamic stabilization and how that affects the following flight phase, we find that it takes the athlete a longer time to reach peak velocity on the right leg—this is very clear when we look at the peak velocity quotient.
From the data presented in the testing process, we can begin to formulate functional thresholds that an athlete must meet to safely pass beyond the return to play stages of training. Criteria can be put in place on a case-to-case basis or from an organizational approach in which, for example, the athlete is encouraged to achieve 10%–15% symmetry in velocity from left to right as well as possess the ability to be within a window of 10%–15% of the average velocity production to pass along the return to play protocol (as long as all other criteria are met within the paradigm).
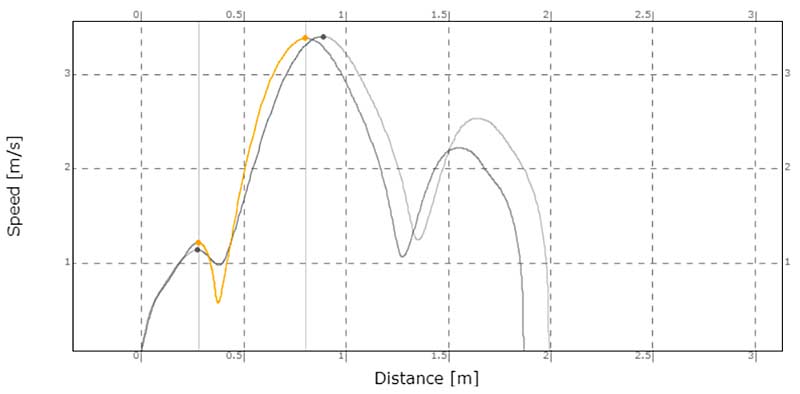
Next, figure 11 is a quick view of an athlete who possesses a similar profile from left to right when looking at their window of dynamic stabilization. Their peak velocity quotient, however, is very different, as we can see that they take much longer to achieve max velocity.
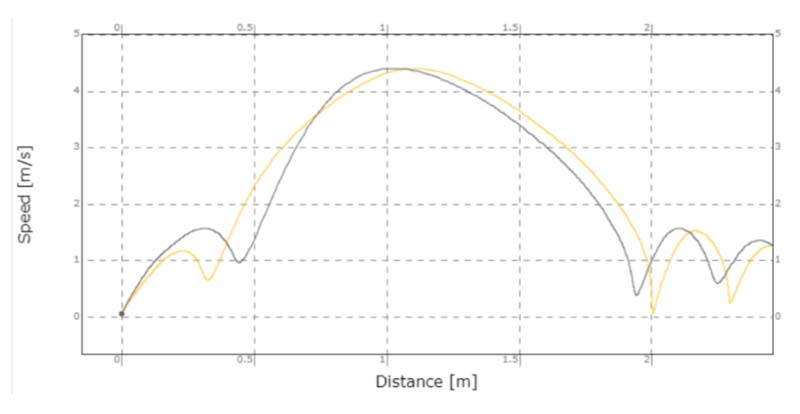
Lastly, we briefly examine a classic asymmetrical issue in an athlete (figure 12). As we can see, the athlete’s landing location and distance achieved on the jump are almost dead-on when looking at left versus right. However, almost every other aspect of the jump sequence expresses extreme variance. The general stabilization window shows a lot of static left versus right, and the athlete’s ability to express movement freely and dynamically stabilize is different. Lastly, maximum velocity is achieved, and the peak velocity question is monumentally different from left to right.
Quantifying the Data
While the 1080 does provide real-time numbers on the cloud platform by simply using the trim tool to highlight the area of the jump that you want to look at, the next step is quantifying the data. You can export this trimmed version of a jump; however, there are more ways that you can pull this data:
- Go to the top right-hand corner of the web dashboard and click on export.
- From there, scroll down and select raw data.
- Once this is selected, you can select individuals or do a mass export of the data by clicking on one or all the athletes.
- Be sure to select the proper dates and exclude hidden curves and override trim. The “override trim” option applies more to sprinting than jumping, as the raw data export will export all data in the jump and not allow a trimmed section to be exported.
Go through and select the jumps you want to export before hitting the export raw data option. The system will only export the jumps that are selected in the athlete’s profile. If you do not double-check, you may miss jumps or, alternatively, export a massive amount of data that includes poor jumps and general static movement that may have been counted as a rep by the system.
Once you have the raw data exported, you will need to write a script that filters the data to identify the two peaks within the jump. These two peaks symbolize:
- The beginning of the window of dynamic stabilization.
- The max velocity achieved within the jump.
The 1080 system clips data at a sample of 0.003 per second—so, from here, we have our window that symbolizes the peak velocity quotient. Now we add up the accumulated time within this window by adding up every 0.003. After this is completed, it’s a simple equation, dividing our peak velocity achieved by the accumulated time within that window.
This testing procedure provides us with one of the most specific high-velocity measures possible to quantify a jump, says @DeRickOConnell. Share on XThis testing procedure provides us with one of the most specific high-velocity measures possible to quantify a jump. From the data provided, we can begin to extrapolate which of our athletes possess exceptional dynamic stabilization abilities as well as high-twitch mechanisms, likely enabling them to stand out from a velocity perspective within their sport. This information helps distinguish where our athletes stand compared to their peers while also allowing us to see what traits an athlete may lack.
From here, we can begin to organize training methods that address these weaknesses and allow optimal adaptations for the performance qualities that each athlete requires. As a secondary note, the data provided also gives us incredibly valuable insight to study throughout the return to play phases of training when an athlete is coming off of an injury.
Since you’re here…
…we have a small favor to ask. More people are reading SimpliFaster than ever, and each week we bring you compelling content from coaches, sport scientists, and physiotherapists who are devoted to building better athletes. Please take a moment to share the articles on social media, engage the authors with questions and comments below, and link to articles when appropriate if you have a blog or participate on forums of related topics. — SF
References
1. Parslew B, Sivalingam G, and Crowther W. “A dynamics and stability framework for avian jumping take-off.” Royal Society of Open Science. 2018;5(10). 10.1098/rsos.181544
2. Hallett M. “Volitional control of movement: the physiology of free will.” Clinical Neurophysiology. 2007;118(6):1179–1192. 10.1016/j.clinph.2007.03.019. Epub 2007 Apr 26. PMID: 17466580; PMCID: PMC1950571.
3. Lockie RG, Jordan CA, Callaghan SJ, et al. “The Relationship between Unilateral Dynamic Stability and Multidirectional Jump Performance in Team Sport Athletes.” Sport Science Review. 2015;24(5–6):321–344. 10.1515/ssr-2015-0022.
4. Liu K. and Heise G. “The Effect of Jump-Landing Directions on Dynamic Stability.” Journal of Applied Biomechanics. 2013;29(5): 634–638. 10.1123/jab.29.5.634.
5. Wikstrom EA, Powers ME, and Tillman MD. “Dynamic stabilization time after isokinetic and functional fatigue.” Journal of Athletic Training. 2004;39(3):247–253.
6. Colby SM, Hintermeister RA, Torry MR, and Steadman JR. “Lower limb stability with ACL impairment.” Journal of Orthopaedic & Sports Physical Therapy. 1999;29(8):444–454.
7. Hallett M. “Volitional control of movement: the physiology of free will.” Clinical Neurophysiology. 2007 Jun;118(6):1179–1192. 10.1016/j.clinph.2007.03.019. Epub 2007 Apr 26. PMID: 17466580; PMCID: PMC1950571.

