By Owen McNally & Jonas Dodoo
This article will present how we at Speedworks break down the sprinting cycle and determine athletes’ biases based on what we see.
We take endless videos of our athletes from the sagittal view, which allows us to understand how and why an athlete moves in a certain manner. The sagittal view is a great introduction to the movement of the athlete, and we believe it presents the most information (initially).
First, a very basic explanation of the sprinting cycle. The sprinting cycle can be broken down into two phases: ground and air. The ground phase starts at initial touchdown and ends at takeoff; the air phase starts at takeoff and ends at touchdown. The video below shows these two phases.
Video 1. The sprinting cycle consists of two phases: ground and air. Initial touchdown to takeoff is the ground phase and takeoff to touchdown is the air phase.
The Data
Athletes navigate ground and air phases in different manners. The drive index presents a ratio of these variables, which we regularly use when assessing performance.
Drive Index = Contact Time/Airtime
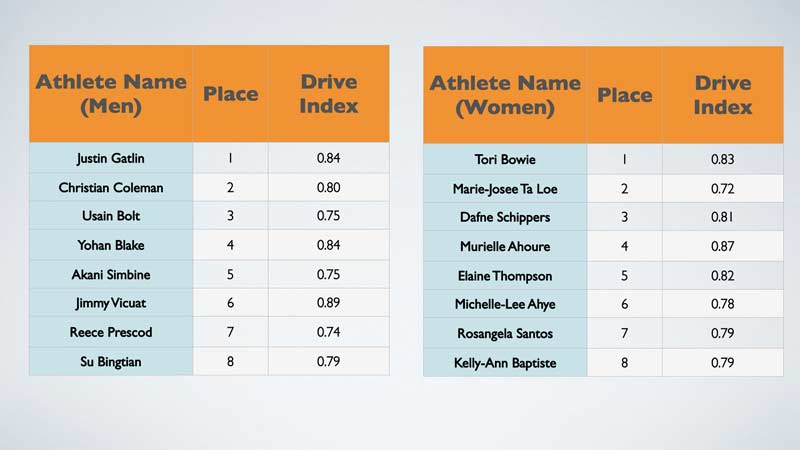
Figures 1a and 1b show that athletes vary their drive index scores, therefore varying the ground-to-air ratios. We can begin to understand their movement strategies by setting out guidelines for values. (I am avoiding the word “group” athletes, as this term is too harsh.) We can classify movement strategies as air-based (low drive index score), ground-based (high drive index score), or a neutral strategy (mid-point drive index value). What should be made immediately clear is that no strategy is the optimal strategy. Different strategies will benefit athletes differently.
Based on the data above, we theorize that for male sprinters, a drive index score of 0.75 represents a neutral strategy. Values above this represent a ground-based approach, and values below this represent an air-based approach. For female sprinters, a drive index range of 0.78-0.82 represents a neutral strategy. Values above and below represent ground- and air-based approaches, respectively.
The trend is that drive index starts high (in acceleration) and slowly decreases until maximum velocity. We are going to focus on the links between drive index at maximum velocity and hip extension/flexion ranges, and in doing so, link the data to what we see. (The classification of drive index values presented above are still rough and are based on athletes we have coached at Speedworks with a combination of World championship data.)
Frontside and Backside Mechanics
We can very basically break the hip cycle into frontside and backside mechanics. (Again, from the sagittal view.) What happens in front of the body is frontside mechanics; what happens behind the body is backside mechanics. Both incorporate ground and air phases. Both happen simultaneously, bilaterally.
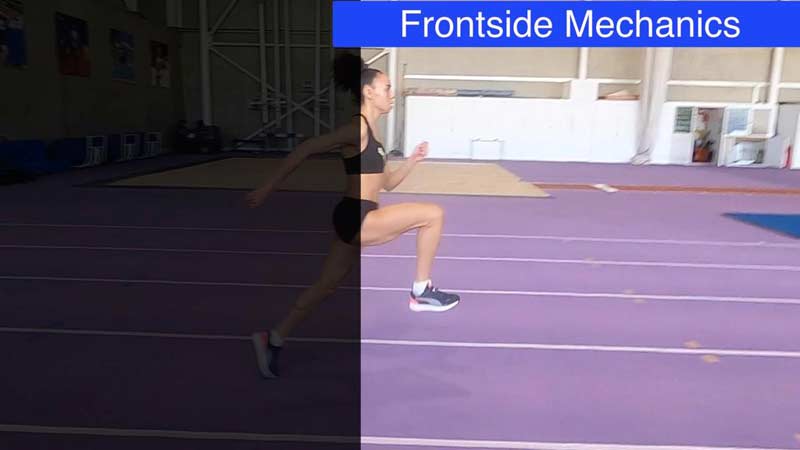

Athletes are commonly grouped by their biases toward either frontside or backside. Athletes termed “frontside” will exhibit large hip flexion ranges with limited hip extension ranges; whereas athletes termed “backside” will exhibit large hip extension ranges with limited hip flexion ranges. This is arguably an oversimplification of it, as speed (or better put, angular velocity) of hip flexions end extensions really contribute toward biases, but visually it is very easy to assess ranges.
Common coaching vocabulary would describe a ‘frontside bias’ as good and a ‘backside bias’ as bad. Why? Because it’s generally right, but not always. Share on XCommon coaching vocabulary would describe a “frontside bias” as good and a “backside bias” as bad. Why? Because it is generally right, but not always. The main difference between novice athletes and elite athletes will be the percentage of frontside mechanics. However, there are variances in biases at elite levels and higher performing levels. Below are tables showing hip extension and flexion angles at takeoff from the 2017 100m World Championships Finals.
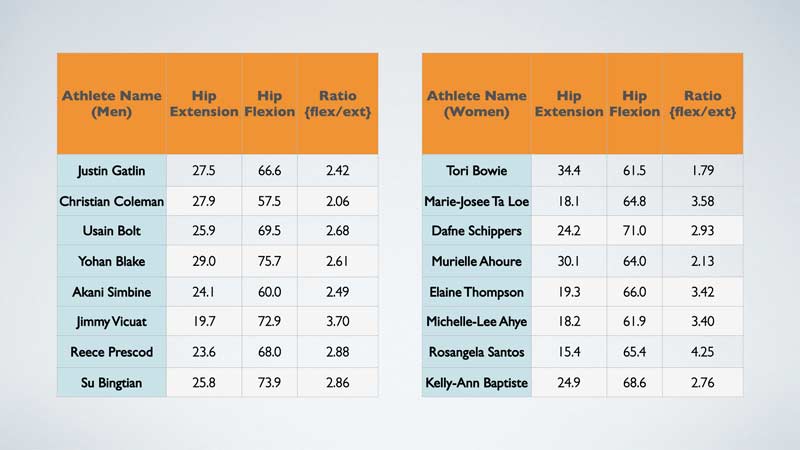
The purpose of presenting these tables is to show that hip flexion and extension ranges vary between athletes (implying that frontside and backside might also vary), and more specifically, the ratios between extension and flexion vary. What are the interesting things about this?
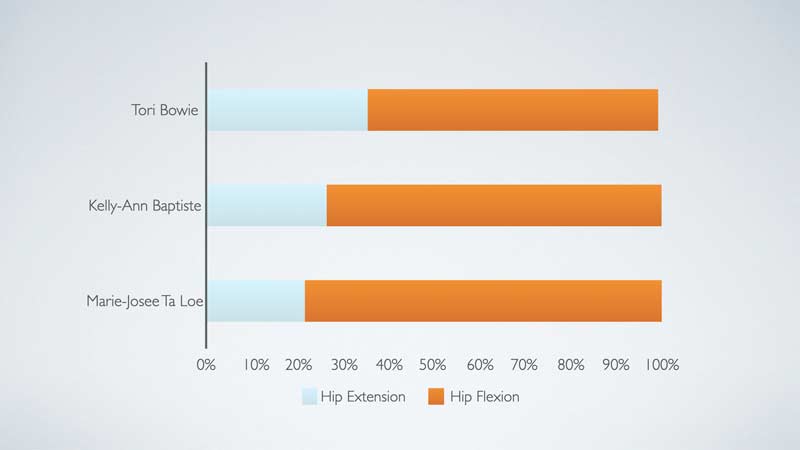
Compare Tori Bowie to Marie-Josee Ta Lou in the women’s 100m final. There is a large variation in the ratio of hip angles at takeoff. Bowie gets a much higher percentage in hip extension and also has a higher drive index value (0.83) compared to Ta Lou (0.72). Therefore, Bowie spends a larger portion of her cycle on the ground in relation to the air compared to Ta Lou, and in doing so creates more hip extension. It seems to make sense. Visually referring to hip mechanics, Bowie would exhibit a more backside approach. Kelly-Ann Baptiste shows hip angles sitting in the middle, and this is also accompanied by a neutral drive index score of 0.79.

Figure 4 again shows differences in the ratio of hip angles at takeoff, with Coleman having a higher percentage of hip extension alongside a larger drive index (0.80) compared to Prescod (0.74). This shows an elite athlete who spends more of their cycle on the ground as a ratio and generates hip angles more biased toward hip extension compared to other athletes, who would appear visually more backsided. Usain Bolt shows hip angles sitting in the middle, and this is accompanied by a neutral drive index score of 0.75.
Neither of these comparisons are to show that what Bowie and Coleman did is more optimal than Ta Lou’s and Prescod’s strategies, but merely to highlight there are differences in strategy. Achieving a large drive index value and hip angles biased toward extension might be optimal for Coleman and Bowie. Prescod and Ta Lou might need to maximize what they are doing in hip flexion and not focus on increasing hip extension. Bolt and Baptiste may have higher degrees of range in the hips and therefore not need to emphasize one side over the other.
Video 2. Air-based sprint strategy with small hip extension and large hip flexion.
What Is Optimal?
The question of what is optimal is not one that anyone has the right answer for, but we can guess as best we can. First, we need to understand the main purposes of frontside and backside mechanics.
The goal of frontside mechanics is to prepare the leg for ground contact. This allows for stiffer landings and shorter ground contacts. Essentially, we take care of the vertical force required for support quicker by spiking the ground reaction force on initial contact. This will mean athletes need to spend less time on the ground. Pre-activation of muscles combined with the leg rapidly attacking into the ground will help generate these outcomes.
In order for the body to do this, an athlete must be able to tolerate very high loads in a short amount of time, turning eccentric into concentric rapidly. In summary, being very reactive! So, it would seem to make sense that if an athlete who is more frontside dominant is biased toward hip flexion angles, their drive index would be lower due to them maximizing their ability to minimize ground contact time.
The goal of backside mechanics is to propel the body forward. When the stance leg moves behind the hip (COM), propulsive horizontal force is generated. The goal is to create large propulsive forces rapidly. The larger the take-off angle (or even hip extension angles), the more force likely to be directed to moving the body forward. Concentric force production capabilities of the muscles will contribute toward this.
Force to propel the body to go forward is only created on the ground. If an athlete can generate large concentric forces and achieve hip angles biased toward hip extension—therefore becoming a more backside dominant runner—it would make sense that their drive index would be higher, maximizing time spent on the ground.
Frontside and backside aren’t mutually exclusive. Having effective frontside mechanics should benefit the effectiveness of backside mechanics, and vice versa. Share on XFrontside and backside are not mutually exclusive. Having effective frontside mechanics should benefit the effectiveness of backside mechanics and vice versa. Yet, perhaps athletes feel more dominant in one than the other, and not all athletes should be expected to do everything the same.

If we put Jimmy Vicaut into the comparison, it goes against the suggested trend or proposed strategies. Vicaut is the most biased toward hip flexion, with very limited hip extension (lowest absolute hip extension value in final). Yet he has the highest drive index score in the final (figures 1a & 1b)—0.89—meaning he spends the largest portion of his cycle on the ground compared to any other athlete in the final but gets the least hip extension. Interestingly, he had the lowest relative step length in the final as well (1.30). This suggests he is wasting time on the ground, as he is not generating enough propulsion. His hip mechanics suggest he has time or maybe space to create adequate pretension before ground contact, to minimize time spent on the ground, but he is unable to.
The questions we would pose are: Does his training focus too much on concentric force production and not enough on reactive capabilities? Or are his hip mechanics limiting his ability to produce propulsive horizontal force? Really, the question is: Why is he spending so much of the cycle on the ground and getting so little output?
We suggest that there are some rules of thumb. If an athlete visually appears “frontside dominant,” they need to maximize their reactive capabilities—spending a larger ratio of their cycle on the ground will be ineffective. So frontside should accompany a low drive index score. If an athlete visually appears more “backside dominant,” they need to maximize their concentric propulsive abilities—spending a larger ratio of their cycle in the air will be ineffective. So, backside should accompany a high drive index score. An athlete who has a neutral strategy visually perhaps must ensure they do not bias too much toward one side.
To make it clear, we are inferring:
- High drive index = Ground-based strategy = Backside dominant
- Mid-point drive index = Neutral strategy = Balanced
- Low drive index = Air-based strategy = Frontside dominant
Coaching ability comes into play when assessing these variables, as the main consideration concerns whether the athlete’s current method of sprinting defined by hip mechanics and drive index scores is optimal. When determining if the current strategy is optimal, we consider several things.
First, we take into account physiological makeup—whether it’s genetic or due to training history. There are athletes who naturally have more of an anterior pelvic tilt, but with super strong glutes and hamstrings, they can be extremely effective. But there are also athletes who come with lots of anterior tilt because they have not been taught/trained otherwise. There will be athletes forced into frontside dominance who shouldn’t be there, and there will be athletes who are frontside dominant who need reactive capabilities trained even more. It is a case of trial and error.
Video 3. Neutral Strategy, which has a mid-point drive index value.
Although this article has highlighted the differences, the similarities are arguably more important. Every successful athlete needs to be effective in the air (switching and creating pretension), have the ability to tolerate and create high forces in minimal time (reactivity), and rapidly displace their bodies forward (projection). So, if an athlete exhibits more anterior pelvic tilt than what is considered normal but is effective in doing all the above, you have your answer. If they are not effective, they may simply lack the tools, and it is the coach’s job to provide them with the right tools. Or the tools could be wrong, and they need to be changed!
There is a lot of emerging research showing the importance of frontside mechanics and fixing backside mechanics or anterior pelvic tilt. This article does not disagree with this. We are looking at a more homogenous population (less variation).
Frontside mechanics is not always the answer. Some athletes can reach the very top by exhibiting backside dominance while still managing to be effective frontside. Share on XComparing the data obtained from world championships and advanced athletes at Speedworks to a more novice/untrained population would also lead us to draw the same general conclusions. But our conclusions differ when looking within a more homogenous population. Frontside mechanics is not always the answer. Some athletes can reach the very top by exhibiting backside dominance while still managing to be effective frontside. They must have the physiological makeup combined with the correct training stimulus to do so.
The simplest summary for me is this: Expect to change most athletes who come to you to a more frontside bias. Keep an eye out for the ones who are typically very strong accelerators and access anterior pelvic movement, as it might be their strength. Be aware of the elastic “freaks” who have access to large ranges on both sides; since their stability and strength draw from large ranges, biasing them to one side might be detrimental. For the athletes who come to you with a frontside bias, make them whack the ground harder—don’t give them slow hip extension.
Speedworks Case Studies
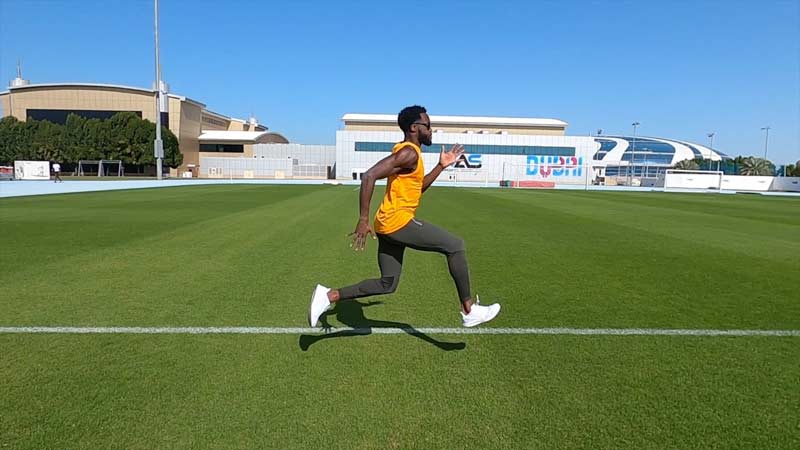
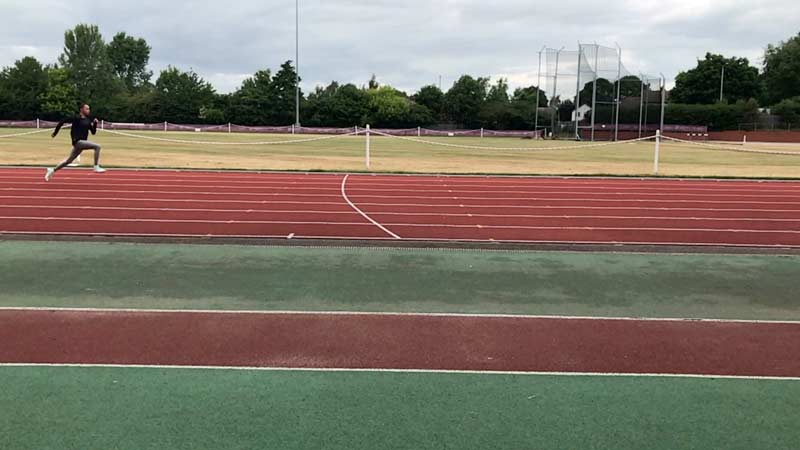
Below are visual representations of athletes who have trained with us at Speedworks effectively manipulating hip mechanics in different manners (ratios).
The Messy Stuff
It is of paramount importance when understanding athlete strategies through hip ranges and air and ground contact times that we refer to the ratios. These are the relationships between two opposing variables: flexion to extension and air to ground. A low drive index value does not necessarily mean an athlete spends less time on the ground than an athlete with a larger drive index. Other variables have an effect.
Taller athletes (or more specifically, athletes with certain length in specific limbs) typically have larger step lengths and lower step frequencies. Therefore, cycle time is typically higher. Reece Prescod achieves a lower drive index value than Christian Coleman but has higher ground contact times during maximum velocity. He also generates a larger step length, meaning he does not need to maximize his step frequency to the same degree as Coleman.
But height does not perfectly dictate (or even correlate) with step length or step frequency biases. This article has purposefully stayed clear of pinning step length and frequency to certain strategies, because it doesn’t work. It would be all too easy to say that the smallest athlete in the race with the lowest drive index (lowest portion of cycle spent on the ground) and a large frontside bias would demonstrate very high frequencies but a low step length. But Ta Lou is a great example of why this is a wrong assumption. Ta Lou had the highest relative step length in the final and the third highest absolute step length (during maximum velocity), but she is the smallest in stature.
This article has purposefully stayed clear of pinning step length and frequency to certain strategies, because it doesn’t work. Share on XAir versus ground or backside versus frontside are just different methods to create force. Therefore, maximizing the reactive capabilities of a frontside sprinter to generate as much force as possible can result in big step lengths. Or it might not. Based on Ta Lou’s data—lowest drive index, hip flexion biased mechanics, small stature, large step length—we could throw out a guess that she is the most effective at creating pretension before ground contact, spiking the force quickest on initial touchdown. Perhaps she has figured something out.
Since you’re here…
…we have a small favor to ask. More people are reading SimpliFaster than ever, and each week we bring you compelling content from coaches, sport scientists, and physiotherapists who are devoted to building better athletes. Please take a moment to share the articles on social media, engage the authors with questions and comments below, and link to articles when appropriate if you have a blog or participate on forums of related topics. — SF
 Jonas Tawiah-Dodoo is the head coach and founder of Speedworks. He was a part of the UK Athletics Apprentice Coach program in the four-year lead-up to the London 2012 Olympics, working with world-renowned coaches Dan Pfaff and Stuart McMillan. His experience in sport is not limited to athletics, as he has worked with rugby for several years.
Since graduating from the Apprentice Coach program, Jonas has worked closely with a number of talented young sprinters. His most recent prodigy is Reece Prescod, the 2018 European Champion 100m sprinter.


Regarding the formula above (Drive Index = Contact Time/Airtime). Are the drive index numbers listed above an average of right and left feet?
If so – In your experience what would be an typical range of difference of drive index between right and left?
For example I had a low budget go at it myself using a fly 30m slo-mo video and ‘runmatic’ app and calculated 0.89 for right and 0.80 for left.