
September 7, 1974 —It was a warm late-summer day in Anaheim, California, and the Angels were playing the Chicago White Sox. A young pitcher, Nolan Ryan, toed the mound. Wiping the sweat from his brow, he nodded for the fastball and began his windup. In the blink of an eye, the ball left Ryan’s hand and thwacked into the catcher’s glove—the world’s first recorded 100-mph pitch.
Thirty-six years later, in 2010, Aroldis Chapman blew the hats off of spectators when he launched a pitch clocked at 105.1 mph—the fastest recorded in the modern era. Over the past 13 years, the speed of the average pitch has gone up by more than 3 mph. Although that may not seem like much to the average person, it is a remarkable feat at the MLB level. Spectators might show up for overpriced hot dogs and concessions, but they stay for the speed—and the athletes have noticed.
This made me concoct a theory—not about hot dogs, but about the potential to add pitching speed to a ball player in the pre-season. If the game is faster than ever, how do I fill in each player’s gaps to help them keep up? Or, in other words, can I make fast athletes stronger, strong athletes faster, and once balanced, improve both instead of only focusing on one quality?
What We Did
Every pre-season in our facility, we host dozens of high school and college baseball players looking to improve their mound performance. Our program has always had fantastic results, but I wanted to quantify the most valuable KPI (key performance indicator) to any baseball player—mph. I’ve had this theory on how to get the most speed out of each athlete for years, but I finally invested the resources to test my hypothesis.
I’ve had this theory on how to get the most speed out of each baseball player’s throw for years, but I finally invested the resources to test my hypothesis, says @endunamoo_sc. Share on XTo do this, we hard-mounted a Pocket Radar and a tablet and regularly tracked throwing velocities. If I was correct, then focusing on the differences and deficits of each athlete would yield better results than a standard pre-season program. Within 12 weeks, most of our players were throwing 5.2 mph faster.
How did we do it?
Aside from traditional strength and power training, our program evaluated each player based on two attributes (strength-speed and velocity), categorized them, and then modified their training. Not all athletes start with the same biases and deficits, and once we understood those gaps, we were able to break some plateaus and get some results. To capture the deficits within our population, we implemented two tests and created a ratio score based on these:
-
- Three-step kickback medball shotput. This was how we evaluated the strength-speed of each athlete. By implementing a familiar load that was much heavier than a baseball, we could capture peak power that was more force than velocity. Athletes who were high performers in the weight room or on non/low countermovement actions excelled at this.
- Three-step kickback baseball throw. This test leaned more toward the velocity side of performance and gave us a glimpse at the number everyone truly cared about. Having a low medball shotput speed did not mean that there would be an equally low throw speed. Athletes who struggled in the weight room but excelled in aspects like jumps or sprints had higher-than-expected throw velocities.

Once both metrics were collected, we created a ratio and used group means to determine the “ideal” score—which we called a speed-strength ratio (SSR). We had a group of players who’d been in our program for several years and were multi-year varsity and/or college players—we will call them the “Goon-Gang” (IFYKYK)—who all shared an SSR within 0.2 of each other, regardless of their baseball or shotput throw speeds. Some were higher performers than others, but they were all at the top of our competitive food chain. It was like the Red Sea parted, and the optimal ratio was right there in front of me.
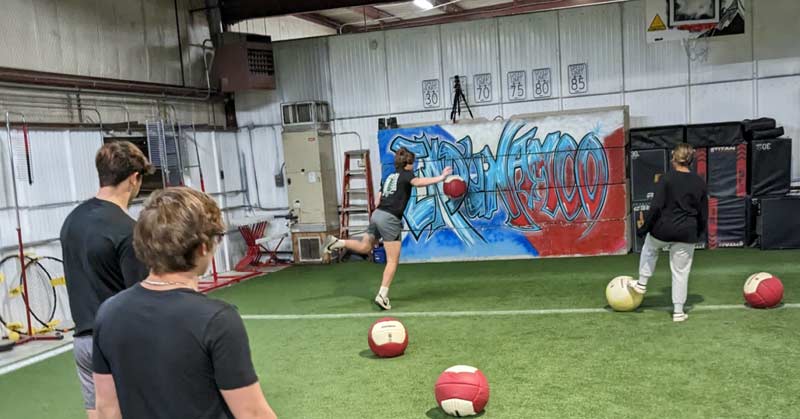
Once I had that goal ratio in sight to get our athletes to reach, we got to work on modifying sessions to build their deficits before strengthening their strengths. Before we can dive into the fun and practical side of this approach, however, we have to get our reading glasses on and pencils out and start doing some graphing.
Once I had the goal speed-strength ratio in sight to get our athletes to reach, we got to work on modifying sessions to build their deficits before strengthening their strengths, says @endunamoo_sc. Share on XForce-Velocity Curve Remodeled
The force-velocity curve is one of the first things taught to aspiring strength coaches. In most textbooks, this is a simple curve with a 1:1 relationship between force (F) and velocity (V). This chart would suggest that as force increases, velocity must decrease (and vice versa). It would be nice if the entire universe followed black-and-white rules like this, but as in many cases, the truth has more gray to it.
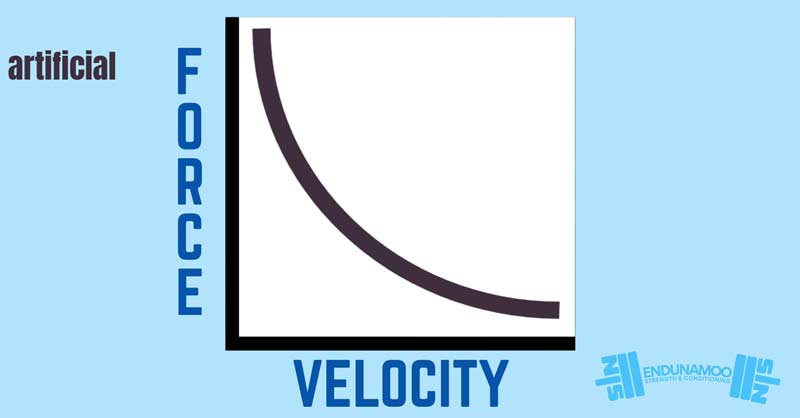
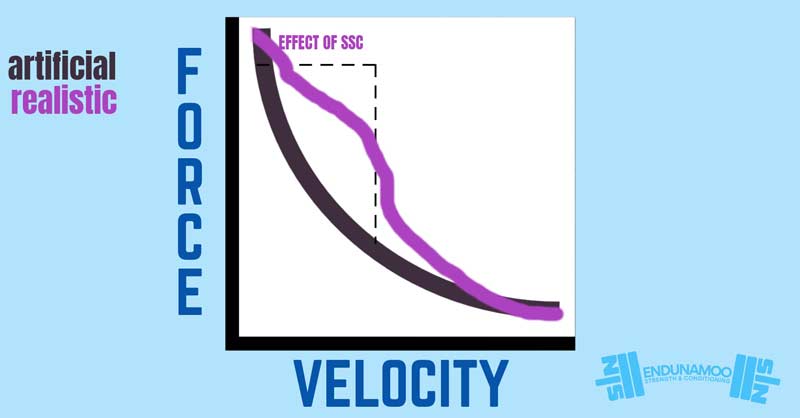
If you asked most baseball coaches which is harder, adding pitching velocity or improving a deadlift, they would say the former. That being said, an increase in absolute strength will sometimes lead to an increase in velocity (up to an extent). This means that getting stronger increases the length of the curve while also increasing the speed (V) at which we can move certain loads (F). This is because athletes are not uniform in nature but can use greater stretch loads from the stretch-shortening cycle to throw even harder.
If we were robots, the FV curve would make complete sense, but since our body is designed to utilize the kinetic chain, we can generate high levels of force without losing velocity (at least for a little bit). During advanced movements, the entire body acts like links in a chain, transferring the force generated by one link to the following link while amplifying it through its own additional segmented forces. By improving the efficiency of transfer or the strength of links, we can maximize performance! Humans have a very complex fascial system that we have used since the beginning of human movement to throw, jump, and run faster. Many vertebrates also share these characteristics, but it’s not a universal superpower seen in the animal kingdom.
If we were robots, the FV curve would make sense, but our body is designed to utilize the kinetic chain, so we can generate high levels of force without losing velocity (at least for a little bit. Share on XFull-grown chimpanzees are 1.5–2 times stronger per pound of body weight than humans, but the average chimp can only throw a ball at 30 mph…which would be impressive if it was faster than the average prepubescent 11-year-old could throw. Meanwhile, the Goon-Gang all have mound velocities between 85 mph and 90+ mph. They might lose to a chimp in a deadlift competition, but that monkey can’t keep up when it comes to arm speed.
The complexity doesn’t stop there. We should also consider adding a second parabola to the Force Velocity chart demonstrating how power plays into all of this. If you can reach back in your mind to the last time you ran a physics calculation, you might remember that Power (P) = Force (F) * Velocity (V). Increasing peak power in athletes is associated with many other performance benefits. As a coach, we can target when force and velocity are at their peak, creating the sweet spot for power training. Although this will vary between athletes, most research suggests traditional strength exercises have peak power at 70%–80% 1RM, whereas their plyometric/ballistic counterparts peak at 35%–45% 1RM.
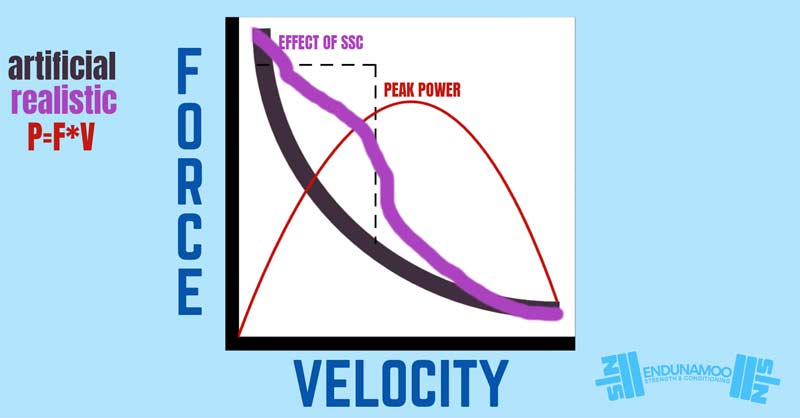
Now that we understand the complex relationship humans have with load, speed, and power and how we can uniquely use the SSC and fascial network to maximize the speed at heavier loads, we should be able to get everyone throwing 100+ mph, right?
Probably not—but at least we can try. Not everyone has the same genetic makeup, which means they come with their own predispositions, deficits, and potential. To get the most out of everyone, we have to figure out their FV curve and then go from there. Easier said than done, though, right?
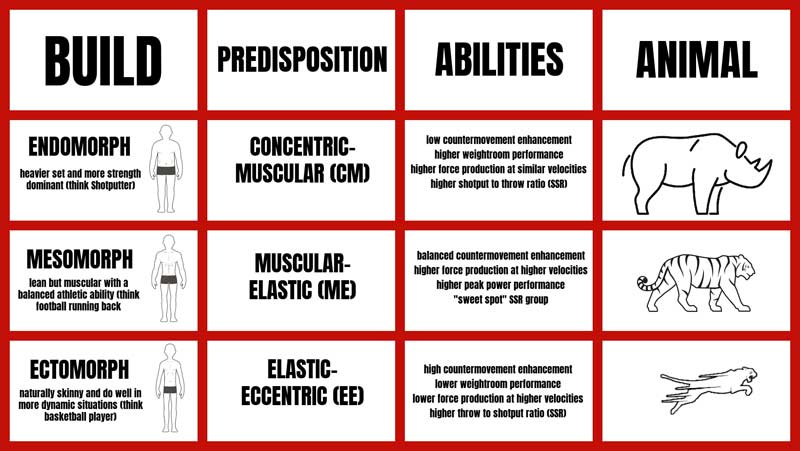
Determine Whether Your Athlete Is a Rhino, Cheetah, or Tiger
There are many ways to describe an athlete’s “natural” type, and once you determine their strengths and weaknesses, you can build a program to fix their weaknesses and take advantage of their strengths. In the deep off-season, we want to address the gaps in an athlete’s portfolio, but once it’s game time, we should be peaking their strengths.
The simplest way to peak a player’s strengths without an SSR is to determine which of these three categories they fall into: endomorphs, mesomorphs, or ectomorphs, says @endunamoo_sc. Share on XYou don’t need an SSR to start doing this with your athletes (though it does help). There are many ways to do this, with some being more “science-heavy” than others. To start at the simplest option, you can look at a player and determine which of these three categories they fall into. Endomorphs are heavier set and more strength dominant (think shot-putter). Mesomorphs are lean but muscular, with a balanced athletic ability (think football running back). Ectomorphs are naturally skinny and do well in more dynamic situations (think basketball players).
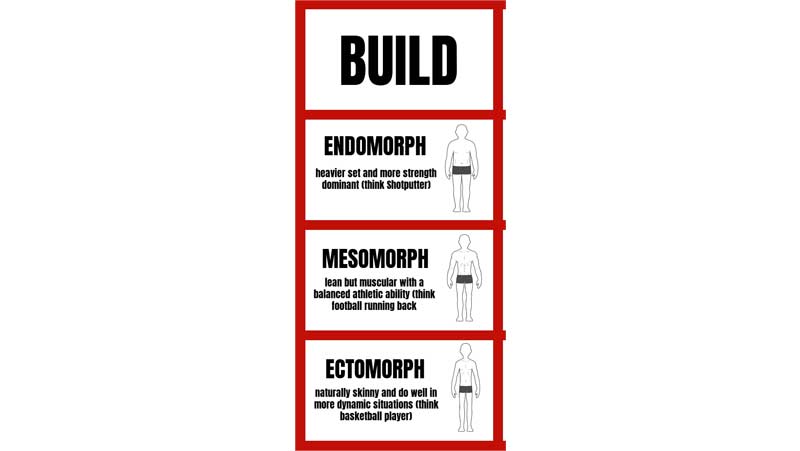
If you’re like me, you might find this style of assessment underwhelming. The next step in the evaluation is to determine whether they are eccentrically or concentrically dominant. Another way to look at this evaluation is to say whether they move elastically or muscularly. Athletes who are more eccentric-elastic (EE) can generate more power from dynamic movements, while concentric-muscular (CM) athletes can produce large force with little assistance. Between these two groups are the muscular-elastic (ME), who have a balance of concentric abilities but still can produce large amounts of power with additional eccentric load.
There are many ways to evaluate each athlete within your group. For example, you could compare a standard countermovement vertical jump with a more dynamic approach jump. More EE athletes will see 15%–20%+ differences between the two, while more CM will have a 0–10% difference. You will also find that a CM will have better 10-yard to 40-yard ratios compared to an EE. It’s not uncommon for a CM to have a comparable or even better 0–10-yard time than an EE. It’s also not uncommon for a CM to struggle with seeing their times improve between 20–30 and 30–40, whereas an EE will have significant changes at those distances.
For our purposes, we looked at the difference between the 4-pound shotput throw and the standard plyo baseball throw. Those with a smaller difference were dubbed CM, while those with a much greater difference were EE. Our goal was to get everyone to a standard difference (working on their gaps) while still improving them in total (peaking their strengths).
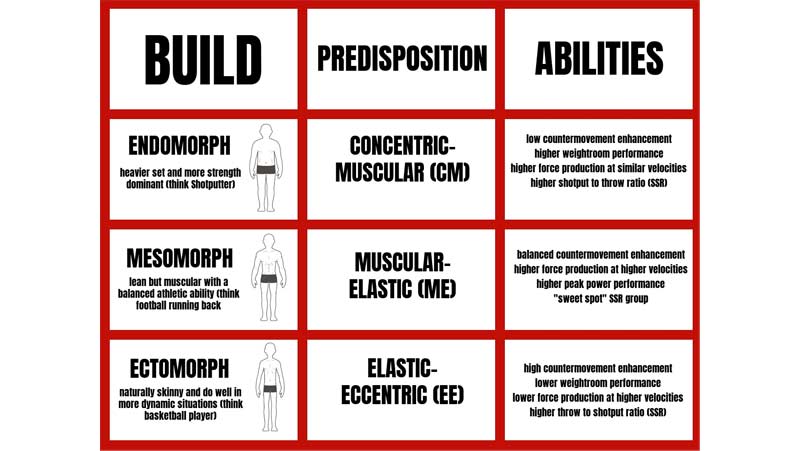
If all else fails, you can put on your safari hat and decide what kind of animal your athletes are. Are they like a rhino (strong and powerful in short distances)? Are they a tiger (explosive and strong without being too heavy)? Or are they a cheetah (lean and fast with bouncy movements)?
Let’s look at our Goon-Gang for an example. Although they were all built differently (heights ranging from 5’6” to 6’4”), they moved similarly. They had creative, explosive abilities from both static and dynamic situations while also being some of the strongest per-pound-of-bodyweight athletes in the weight room. None of them moved heavy but lacked bounce like a rhino, nor did they move weakly but quickly like a cheetah. They were all tigers—strong and powerful, with a pop when needed.
How We Built Velocity Regardless of the Athlete’s “Type”
Now that we’ve made it through the “boring” logistics, we can get to practical application. For starters, we still worked on building strength (unilaterally and bilaterally), and everyone sprinted weekly and hammered rotational movement qualities as a group—after that, however, things got a bit squirrelly.
Each session included medball throws to some degree and lower/upper plyometrics as a supplement. To work on weaknesses at the beginning of the season, we created a few rules. Those who were CM used 2–4-pound medballs exclusively, and most of their throws included a greater dynamic effect: steps, wind-ups, catches, etc. Likewise, they performed fewer static plyometrics and sprinted longer distances throughout the program. Those who were EE were forced to use 6–8-pound medballs exclusively from more static positions: full kneeling, half kneeling, standing, etc. When they performed plyometrics, we focused on non/low countermovement jumps, and they trained at a higher intensity in the weight room—2.5% to 5% 1RM heavier each session.
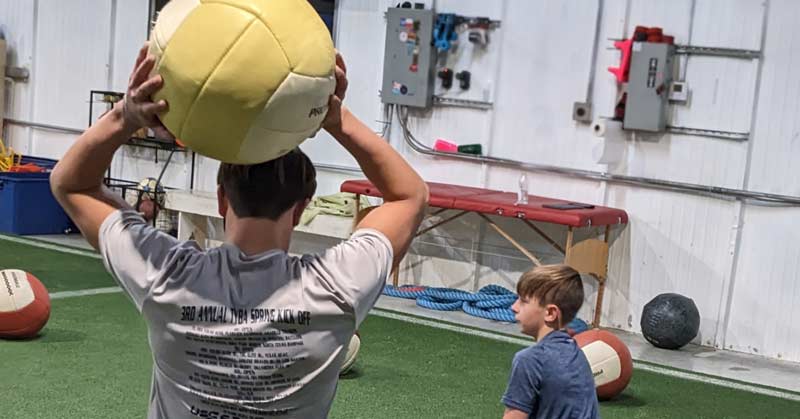
The Goon-Gang had a more diverse training experience throughout the pre-season. They were able to use weighted throws of 2 to 8 pounds while also performing movements and throws from both static and more dynamic approaches. Not to waste a good Pocket Radar, we also recorded rep by rep to get every drop out of these guys each session.
And it worked.
Those with the greatest increases in pitch velocity resolidified my original theory—make fast athletes strong and strong athletes fast, and once balanced, improve both, says @endunamoo_sc. Share on XLifetime throw PRs were seen from every rhino, cheetah, and tiger in the group. Those who went from EE or CM to more ME had the greatest increases in pitch velocity, which resolidified my original theory—making fast athletes strong and strong athletes fast, and once balanced, improving both was the way to go.

The Perfect Balance
Every sport has its unique landmark of athletic success. For gym bros, it’s the answer to the question, how much can you bench? For basketball, it’s can you dunk? And even if they’ll never be able to bring it over triple digits like Nolan Ryan or Aroldis Chapman, for baseball pitchers, it’s can you top 90 mph?
Working in the private sector, I get approached by a lot of baseball parents and athletes asking how to improve their pitching velocity. I have a personal rule to stay in my own lane when it comes to my profession: I am in no way a pitching coach, so modifying their technique is out of the question. What my resume does have on it, however, are a few degrees, certifications, and studies I’ve gotten in sports performance and exercise physiology. And despite my limitations, we added an average of 5.2 mph to our group’s pitching velocities.
Establishing which animals we were working with was the key to getting those gains. The entire performance community has accepted barbell velocity-based training as a great tool for building “athletic” strength. It’s only time we get beyond the weight room and onto the field with this science.
The entire performance community has accepted barbell VBT as a great tool to build “athletic” strength. It’s only time we get beyond the weight room and onto the field with this science. Share on XIt is no longer the gold standard to track the speed of movement but rather to determine which athlete needs more speed, more strength, or the right amount of both. This can be done with a radar, as we did. This can also be done by comparing non-countermovement jumps to more dynamic jumps. And this can be done by comparing 10-yard split and 40-yard split times. The list goes on of ways to evaluate CM- and EE-dominant athletes.
Ultimately, it is up to what you have available at your disposal. And, one day, you might find yourself eating that overpriced hot dog in a ballpark somewhere in America as you watch one of your kids throwing gas on the big stage.
Since you’re here…
…we have a small favor to ask. More people are reading SimpliFaster than ever, and each week we bring you compelling content from coaches, sport scientists, and physiotherapists who are devoted to building better athletes. Please take a moment to share the articles on social media, engage the authors with questions and comments below, and link to articles when appropriate if you have a blog or participate on forums of related topics. — SF

