Our job as sports performance coaches is to improve the physical qualities of our athletes, hopefully unlocking greater success in their sport. Almost all sports come down to scoring more than the other team in competition; and, those moments when points are scored or deterred are determined by spacing. Did the player have enough space to perform the sporting action that allows them to score?
Cam Josse and Fergus Connolly talk about the concepts of space creation and space muting in their book “The Process” (Connolly & Josse 2019). In field sports, this can be broken down into an offensive-minded player creating space to move through various actions in hopes of scoring. Opposite to that, a defensive-minded player will try to cover enough space to impede that offensive player. Both players are looking for an advantage by finding an opening or closing one. Advantages come from a variety of sources, but can be simplified into three categories:
- Tactical advantages.
- Technical advantages.
- Athletic advantages.
Athletes will leverage all three areas to find advantages to make plays that help their teams win. Tactical and technical advantages are taught by their sport coaches, while athletic advantages are based on genetic athletic potential and how that potential is enhanced through training by the strength and conditioning staff. Any extra space created by any one of these areas can be the key to success on the field.
Using football as an example, if we have an outside receiver running a comeback route, this receiver has multiple paths to successfully get open and make the catch for the first down. Using his tactical understanding of the play call, along with pre-snap reads of the defensive coverage, it appears they will be in Cover 3. His route will attack the space outside between the deep 3rd defender and the underneath flat defender. This receiver knows the defender lined up across from him has a deep 3rd responsibility—meaning the defender can’t let him get by him. If he uses a burst of speed and body language that communicates a deep threat down field, the defender will have to open his hips to run with him to cover his area.
Once the DB has opened his hips, the receiver now has the advantage on the comeback.
This receiver can also use his technical understanding of route running to create an advantage. As he runs down field, the DB will likely play with outside leverage and the receiver can attack this leverage and get on the DB’s toes, pressing him to open his hips and run to keep the receiver in front. Once the DB has opened his hips, the receiver also has a movement advantage.
Now let’s say the receiver fails to execute on either of the above possible ways to get open: we have a relatively even situation at the top of the route. The DB is one yard north of the receiver and still in his backpedal as they come up on the breakpoint. The receiver has to stop his momentum, cut, and turn 135 degrees to his right backward to the sideline and look for the ball. The DB is still in his backpedal and will see the receiver’s hips drop into his break and can also break on the ball. The ball was thrown on time and is already in the air—at this point, who has the advantage?
Advantages come from a variety of sources, but can be simplified into three categories: tactical advantages, technical advantages, and athletic advantages, says @Torinshanahan42. Share on XIt comes down to change of direction ability. Who can stop their momentum first? Who can break or cut first? Who can sprint to the intersection point between their paths and the ball first? This is where an athletic advantage comes into play—can you be a better athlete than the player across from you and make the play when you both know what you are about to do? The faster you stop, the faster you can cut, and then the faster you can accelerate out—deceleration is a trainable factor that can give your athletes a movement advantage.
Deceleration is a critical component to success in many sports and can be defined as the act of reducing an object’s velocity. Training an athletes’ brakes is an important part of the training program for maximizing an athlete’s potential and placing the most prepared team on the field for every competition.
Principles of Training Deceleration
All athlete training is dictated by physiology. There are set core principles of training that must be followed for positive adaptation to occur. These principles are working at or above training stimulus thresholds, progressive overload, and specific adaptations to imposed demands (SAID Principle). Providing a training stimulus is very important because it’s the only way the body knows it needs to adapt. If you are not challenging your athletes, you are not changing your athletes.
Over time, this threshold will rise as the athlete improves. You need to keep challenging athletes by providing more demanding tasks. Lastly, this training stimulus needs to be specific. Any exercise or drill where you are chasing deceleration adaptations must stimulate the biomechanical and physiological systems that operate during deceleration tasks. Applying these principles to deceleration training:
- The drills or exercise must have enough intensity to challenge the athlete’s physical and movement qualities.
- That challenge must be progressed.
- The challenge needs to specifically challenge biomechanical and neurological systems used in declaration.
Looking back at our receiver running his comeback route—the initial get off the line, the acceleration—tasks his body with producing large horizontally-vectored impulses to drive his body forward. Ground contact time is long and force is relatively low. As our receiver comes into his break, he will experience deceleration, which has a unique signature. Braking can be characterized by very rapid and very large ground reaction force profiles, with those specific forces being related to the current velocity of the athlete.
Our receiver has built up some speed as he runs down field—when he goes to stop, his body can experience peak forces up to 5.9x bodyweight (Harper et al 2022). These forces are significantly larger than many other tasks our receiver—or any athlete—will perform, specifically being 2.7x greater than an equally intense acceleration (Harper et al 2022). According to Damien Harper, one of the world leaders on deceleration and founder of Human Braking Performance, these decelerations are also 37% greater physical load per meter than equal accelerations. He states that they can also be 65% greater load per meter than most other typical sporting actions (Harper & Kiely 2018). With greater peak forces and a significantly higher physical cost in load per meter than accelerations, decelerations need to be specifically trained and accounted for in their cost on the body.
The faster you stop, the faster you can cut, and then the faster you can accelerate out—deceleration is a trainable factor that can give your athletes a movement advantage, says @Torinshanahan42. Share on XThese types of forces are not easy to effectively manage—it’s no surprise that many athletes lack game speed stemming from poor deceleration. With this in mind, the scope of impact on an athlete’s deceleration capabilities becomes apparent. In my previous role as the Director of Football Sports Performance at Georgetown University, my staff and I leveraged the living laboratory we had at our disposal to find ways to better prepare athletes for success on the field and to keep them on the field playing the sport they love. Below, I will share specific changes we made to our football training program based on conversations around our understanding of human performance and the data we collected on the training we implemented with the team. We sought to create specific adaptation in deceleration capability by training in a manner that creates a deceleration specific stimulus, follows progressive overload, and was intense enough to create change.
Weight Room Progression
The weight room is a common theme throughout the entire year in college athletics, where field-based training time comes and goes with the seasons. Having the capability to train multiple different qualities is important for a well-rounded training program and deterring detraining in the qualities you and the athletes worked so hard to develop. The two core training modalities we used in the weight room are depth drops and isometric tempos. Both of these are trained at high intensities for a stimulus, the stimulus is specific to deceleration, and both can be progressively overloaded.
Depth Drops
In my last role, we mainly utilized the depth drop progression in the weight room because it was logistically easier and we could attempt to accommodate individualized box heights. Depth drops are an exercise where the athletes step-off and land from an elevated surface. Athletes must effectively manage the large forces applied during landing. Depth drops enact vertical deceleration, where forces can be equal to or greater than that of horizontal deceleration. The height of the box can manipulate the intensity and progressions can be made by including various types of jumps that are performed after the landing.
Utilizing depth drops for deceleration specifically meant needing to replicate deceleration-specific forces. While the vector is different, the muscles utilized are similar, so we sought to find what box heights could replicate those forces and then overload them.
Deceleration is a critical component to success in many sports and can be defined as the act of reducing an object’s velocity, says @Torinshanahan42. Share on XIn this search, we had multiple athletes perform depth drops from various heights. We picked heights of 24, 30, 36, and 42 inches but converted those heights to a percentage of the athlete’s countermovement jump height on the force plate. What we found was there is a lot of variability between individuals, as multiple factors go into eccentric force production. To account for individual differences, we used individual regression models to evaluate what height each individual would need to create peak landing forces at or above our goal of at least 5.9 Newtons per kilogram from Damien Harper’s research. We found this required 143% of an individual’s countermovement jump height. Using 143% of an athlete’s CMJ as the foundation; progressions can be made through height to create larger forces to develop maximal eccentric strength that can be used on the field.
Isometric Training for Eccentric Actions
Eccentric muscle actions are typically most associated with deceleration and isometrics are associated with amortization. When digging into the details of how the muscle actions operate in combination with tendons to create human locomotion, I found that isometrics can be a powerful tool to train an athlete’s brakes. Deceleration is normally thought of as lengthening through flexion of joints to absorb energy, which results in the velocity reduction of an object. Eccentric muscle actions are associated with lengthening joints where force applied to the joint structure is greater than that applied by the musculotendinous unit resulting in the outside force creating movement at the joint.
Isometrics are also associated with static joint positions where force is equal inside the musculotendinous unit and the force applied to the joint system, resulting in the static movement. Eccentric muscle actions are normally synonymous with deceleration because of joint flexion and muscle lengthening while force is absorbed by the body. However, I will explain below how on the macro and micro levels isometrics are a training tool for deceleration.
Macro Level
When doing any exercise with an isometric tempo included in the exercise, the lifter must move the weight eccentrically before stopping at a desired point to hold the isometric position that is desired. The key point is that the athletes must stop by decelerating themselves. Eccentric tempos do require a stop and reversal, but the focus is on the lower without additional pressure applied to the stop. Isometrics provide an additional focus for the lifter to stop and apply tension to create this isometric hold. Digging deeper, with stato-dynamic reps where athletes must pause at multiple positions within the rep, at each pause the athlete must decelerate the load to stop it for the hold. This exposes the athlete to braking forces at multiple positions. In eccentric actions, the force of the muscle is lower than the external load creating the lengthening action. In isometrics, the force is equal. Put on a continuum, to create a braking force to stop a bar being lowered, more force must be applied to decelerate the bar until the velocity is equal to zero where an equal and opposite force must be continuously applied. Simply, isometric tempos on dynamic compound exercises require athletes to apply braking forces that stop moving external loads to train their brakes.
Video 1. Stato-dynamic Squat.
Micro Level
Let’s explore how our bodies accomplish deceleration. Original research by Robert Griffiths, a research professor at the University of Calgary, shows that the lengthening of the musculotendinous unit included lengthening of the tendon while the muscle fascicles actually shortened while the muscle was activated (Griffiths 1991). This was an in vitro study on anesthetized cat muscles, showing that while the entire joint structure was undergoing lengthening—which is typically associated with eccentric muscle actions—the muscle itself was shortening. Later researches from Manchester Metropolitan University, Neil Reeves and Macro Narici followed up on Griffiths’ research and sought in vivo answers with human subjects. They found similar results, as the elasticity of the tendon allows for lengthening of the entire musculotendinous unit while the muscle behaves isometrically (Reeves and Narici 2003).

The tendon buffers rapid stretching and large eccentric muscle forces by rapidly stretching while the muscles actively create quasi-isometric forces. The force is then transferred from the tendon to the muscle as the muscle is better at dissipating force while the tendon is effective at buffering force. Specifically, the muscle’s job in rapid lengthening and high force lengthening situations is to create a solid structure on the opposite end of the bone for the tendon to lengthen between. The tendon elongates and stores the rapid onset of large amounts of energy that could be too great for the muscle to attenuate; while this appears to be an effective strategy to protect tissues, too rapid of a stretch or too forceful of an eccentric action can cause simultaneous stretching of the tendon and muscle. I would speculate this may be when soft tissue injuries occur, establishing a need for improving force-attenuation capabilities of the entire musculotendinous unit.
We can derive from these findings that deceleration forces can be absorbed through the tendon in a protective and buffering manner. Our goal with isometric training is to develop isometric strength, but also improve the biomechanical coordination to buffer as efficiently as possible. Athletes practice developing braking while improving attenuation strategies to allow athletes to create high-force application in maximal deceleration tasks.
Field Progression
Specificity of field work
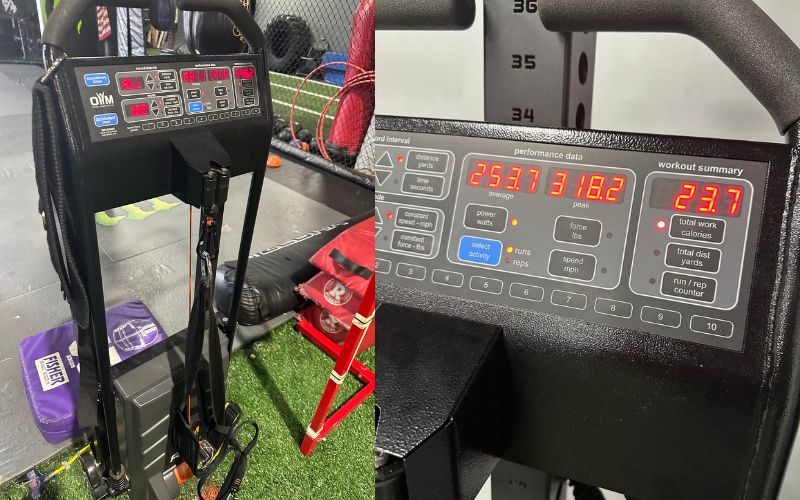
When doing field work, we must remember the principle of training above the threshold that provides an adaptation stimulus. Any drill or exercise needs to be intense enough in the deceleration aspects to create a stimulus. Nevado-Garrosa et al. showcases the need for intensity above threshold—they had one control group, one group playing small-sided, and a weight room-based, eccentric overload training group (Nevado-Garrosa et al. 2021). The eccentric training group improved their maximal deceleration rate, maximal acceleration rate, the number of high-intensity decelerations, and the number of high-intensity accelerations in game. Training to be explosive allowed them to be more explosive.
Providing a training stimulus is very important because it’s the only way the body knows it needs to adapt. If you are not challenging your athletes, you are not changing your athletes, says @Torinshanahan42. Share on XThe small-sided training group—while they actually were performing many acceleration and decelerations during the small-sided games—ended up decreasing or were stagnant in all the same areas. The eccentric overload group was not performing decelerations on the field, they were performing decelerations having to stop a flywheel during training. The main difference was that they were performing maximal to near maximal decelerations with every rep, while the small-sided games group was performing mainly submaximal decelerations. Performing a deceleration at a high intensity is needed where the task is specific to using deceleration to create a training stimulus.
We understand that the human body is resistant to change. To create change, we need to apply enough stress to destabilize the homeostasis that the body is chasing, and that this stress needs to specifically overload the biomechanical, kinesthetic, and bioenergetic tissues or systems that you wish to create adaptation in.
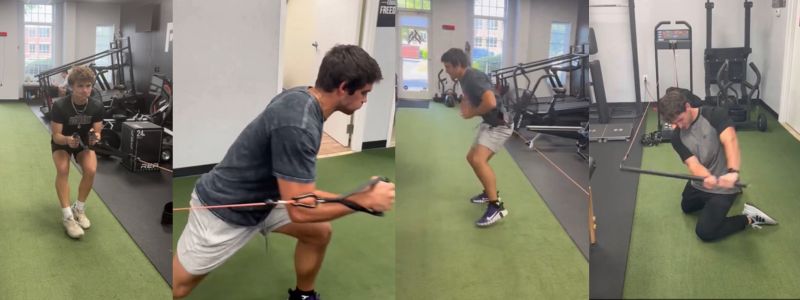
Sprint-to-Decel Drills
During my first spring ball with Georgetown, we had a rash of hamstring injuries and tightness. At one point, our entire DB room was either out or had been in the training room for significant tightness (or at least it felt like the entire room). Naturally, the questions came to me and so I sought an answer.
During my first spring ball with Georgetown, we had a rash of hamstring injuries and tightness… Naturally, the questions came to me and so I sought an answer, says @Torinshanahan42. Share on XIn looking through our data, the DB room specifically had been exposed to one or two high-intensity decelerations during winter training and mat drills (<-4.0 m/s2). Once we started spring ball, they were exposed to 8-10 per practice. Their average distances, player load, and high-speed distances (yards at >70% of MSS) per session were not that different from winter training. I hypothesized that pre-exposing athletes to practice demand of deceleration could be a part of the health equation.
Talking with others and looking around the field through social media to find the way to pre-expose athletes to decelerations, we found Sprint-to-Decel drills. These drills involved giving athletes a set distance to sprint through before maximally decelerating. The intensity of decelaration is predicated on the velocity of the athlete—therefore, manipulations to distance change the intensity of the drill. Other factors can also manipulate the intensity, but the distance is the easiest and main manipulation.


Going through our progressions, we found that using a medball reduces entry velocity but helps to reinforce deceleration positioning as a teaching tool–similar to that of chain or sled sprints for acceleration. The medball increases overall mass, reducing the athlete’s ability to accelerate—and, in a set distance, results in slower speeds. The medball being hugged in front of the athlete positions their center of mass further ahead than normal. When they go to decelerate with this forward center of mass, they must accommodate by sitting back more upright with their posture. This helps reinforce the posture necessary to create braking impulses.
To progress, we cycle medball and free unrestricted variations by performing the medball variant at a set entry distance before progressing the next week to the free variant. For distances, we found that athletes need about 15 yards or more to reliably hit peak deceleration rates of games and practices. This usually occurs with about 68% of their top speed at the end of the drill and can reliably trigger a high-intensity deceleration event. Increasing distances past 15 yards can progressively overload maximal deceleration.
Video 2. Medball Decels.

Conclusion
Applying the base concepts of training to deceleration, we can find multiple ways to provide our athletes with the tools to better decelerate on the field to gain a space advantage. In the weight room, progressions utilizing isometric tempos with compound exercises train athletes to create braking forces under external load and are specific to the muscular actions that operate during rapid deceleration moments. Depth drops at 143% of an athlete’s countermovement jump or greater can be utilized to develop the force output required during horizontal deceleration tasks. Exposure to greater peak force events can develop improved force buffering capability of the musculotendinous units, especially under rapid force application environments. All together, athletes should be given the tools to stop on a dime so they gain an advantage on the field.
While we had a lot of success with these changes, it should be noted that evidence for its efficacy should be taken with a grain of salt. We made significant changes to the weight room training program and the practice structure all in hopes of placing our athletes in a better position to be successful, creating some noise in the efficacy of deceleration training. We had a 60% reduction in the number of soft-tissue injuries over the course of the season, while dropping the overall injury rate by 20%. Over one off-season training block, utilizing the above concepts, we improved team average eccentric peak force per kilogram by 0.8% in the countermovement jump and eccentric mean force in the drop jump by 6.1%. The data showed that our athletes were able to produce more force during eccentric-deceleration phases of jumping tasks and had greater resilience to the demands of practice and games.
How well greater athletic capabilities specifically translates to the field is more complicated and requires more data collection. However, the origin story was centered around injury risk reduction: A problem that we were able to improve upon with specific, intense, and progressively overloaded deceleration training.
Since you’re here…
…we have a small favor to ask. More people are reading SimpliFaster than ever, and each week we bring you compelling content from coaches, sport scientists, and physiotherapists who are devoted to building better athletes. Please take a moment to share the articles on social media, engage the authors with questions and comments below, and link to articles when appropriate if you have a blog or participate on forums of related topics. — SF
References
Issurin, Vladimir, and Michael Yessis. Block Periodization: Breakthrough in Sport Training. Ultimate Athlete Concepts, 2008.
Griffiths RI. Shortening of muscle fibres during stretch of the active cat medial gastrocnemius muscle: the role of tendon compliance. J Physiol. 1991 May;436:219-36. doi: 10.1113/jphysiol.1991.sp018547. PMID: 2061831; PMCID: PMC1181502.
Reeves, N. D., & Narici, M. V. (2003). Behavior of human muscle fascicles during shortening and lengthening contractions in vivo. Journal of applied physiology (Bethesda, Md. : 1985), 95(3), 1090–1096.
Reeves, M. Narici. Behavior of human muscle fascicles during shortening and lengthening contractions in vivo.
Harper DJ, Kiely J. Damaging nature of decelerations: Do we adequately prepare players?. BMJ Open Sport & Exercise Medicine 2018;4:e000379. doi: 10.1136/bmjsem-2018-000379
Harper, Damian & McBurnie, Alistair & Dos’Santos, Thomas & Eriksrud, Ola & Evans, Martin & Cohen, Daniel & Rhodes, David & Carling, Christopher & Kiely, John. (2022). Biomechanical and Neuromuscular Performance Requirements of Horizontal Deceleration: A Review with Implications for Random Intermittent Multi-Directional Sports. Sports Medicine. 52. 10.1007/s40279-022-01693-0.
Nevado, Fabio & Torreblanca Martínez, Víctor & Paredes-Hernández, Víctor & Campo-Vecino, J. & Balsalobre-Fernández, Carlos. (2021). Effect of an eccentric overload and small-side games training in training accelerations and decelerations. Journal of Physical Education and Sport. 21. 3244-3251. 10.7752/jpes.2021.s6431.
Connolly, F., & Josse, C. (2019). The process: The methodology, philosophy & principles of coaching winning teams (Vol. 1).