• Skip to content
  • Skip to primary sidebar
SimpliFaster

SimpliFaster

cart

Top Header Element

  • Facebook
  • Instagram
  • Twitter
  • YouTube
  • Login
  • cartCart
  • (925) 461-5990
  • Shop
  • Request a Quote
  • Blog
  • Buyer’s Guide
  • Freelap Friday Five
  • Podcast
  • Job Board
    • Candidate
    • Employer
    • Facebook
    • Instagram
    • Twitter
    • YouTube
You are here: Home / Blog

Blog

Female Runner on Beach

Vitamin D: Does It Really Improve Athletic Performance and Prevent Injuries?

Blog| ByCraig Pickering

Female Runner on Beach

If you were involved in sport in 2010, you almost certainly encountered discussions about vitamin D. It was very much the supplement du jour back then. Plenty of research showed its function in performance, as well as the prevalence of insufficiency. This research kindled interest that remains strong today.

What is it?

Vitamin D refers to a group of vitamins. The most important are D2 (ergocalciferol) and D3 (cholecalciferol). The sun is the primary source of vitamin D for most people, as it isn’t widely available in foods. This situation obviously causes issues in individuals who don’t get much sun exposure. More on this later.

What does it do?

Vitamin D plays many important roles in the body. There is some evidence that it affects the risk of cardiovascular disease and cancer. Low levels of vitamin D can have a negative effect on the immune system, muscle function, stress fractures, and injury risk.

These studies suggest that we need to ensure athletes have sufficient levels of vitamin D. The main issue here is availability. Since the main source of vitamin D for most people is the sun, insufficient sunlight exposure causes problems. This can be either a result of low levels of ambient sunlight (especially in winter), or spending most of the day indoors. Some conflicting evidence suggests that sunscreen use may also reduce vitamin D levels.

In a 2012 paper, leading sports nutritionist Dr. Graeme Close measured vitamin D levels in the blood of a group of athletes which included soccer and rugby league players, as well as non-athletes. Close took blood samples during the winter months, with a blood vitamin D level of 100nmol/l suggested as optimum. The results were staggering. Only one of the 61 athletes had a vitamin D concentration of 100nmol/l or greater. The median value among the athletes was less than 75nmol/l, and less than 50nmol/l for non-athletes. You might think this is a problem exclusive to more northerly latitudes, but a study of NCAA athletes reported similar results (It should be noted that the authors use different units to measure vitamin D). In a study of Middle Eastern athletes, 91% were deficient, with 59% showing an increase in stress fracture risk. So even though we might know we need sufficient vitamin D—especially from a performance standpoint—many athletes still aren’t getting enough.

How much vitamin D do we need on a regular basis?

The recommended daily allowance (RDA) for vitamin D varies from country to country, and it is typically 400IU-800IU per day. This amount probably is enough to avoid deficiency but not to ensure optimal levels, especially for athletes. The problem is that there are no accepted guidelines for optimal vitamin D intake for sports performance, although research indicates an optimal blood value of around 100nmol/l. To achieve this value, Dr. Reinhold Vieth (1999) recommends a daily intake of 4000IU. This amount sounds reasonable, although I used to supplement with 5000IU per day. After three years at this level, my vitamin D levels were still less than 100nmol/l. Nevertheless, 4000-5000IU appears to be a decent daily target.

You can get too much of a good thing, however. You need to be wary of vitamin D toxicity, (hypervitaminosis D). Symptoms include fatigue and muscle weakness—hardly ideal for athletes—vomiting, decreased appetite, and dehydration. In some cases, it can also lead to calcification of soft tissues. Fortunately, the Vieth paper (it is good–please read it!) asserts that there isn’t any evidence of adverse reactions at blood vitamin D levels of less than 140nmol/l, which would require approximately 10,000IU of vitamin D per day.

One thing to consider is that vitamin D is fat-soluble, which means it can be stored— potentially making toxicity more likely. Toxicity can only occur through food/supplemental sources, however, as the creation of vitamin D through sunlight has a feedback loop that guards against excess. The half-life of vitamin D within the body in its storage form is about one month, so people getting a lot of sun exposure and supplementing should be careful throughout the summer and autumn months.

Vitamin D Sources

One thing to be aware of is the different forms of vitamin D. Vitamin D from sunlight is of the D3 variety. Vitamin D from vegetables and fortified products often comes as D2. Which is better? Most research indicates that D3 is much more effective than D2 in humans, although some studies counter this.

Where can we get vitamin D? Some foods contain it, although not in especially high amounts. Oily fish has around 750IU per 100g, and this is D3. Foods like mushrooms contain D2, although the amount can vary. Fortified milk and juice products can contain both varieties.

Sunlight, of course, is another option. Total body sun exposure can easily provide 10,000IU (Vieth), which is plenty. However, the obvious risk here is skin damage from sun exposure, including the risk of melanoma and squamous cell carcinoma. This paper from Barbara Gilchrest in the American Journal of Clinical Nutrition examines both sides of the issue. Another factor to consider is that dark skin requires a greater amount of sun exposure for adequate vitamin D formation, which is why African Americans are at greater risk of vitamin D insufficiency.

Supplementation

The final avenue is vitamin D supplementation. The most common regimes are between 2500IU and 5000IU per day, although 50,000IU per month (1660IU per day) over the winter months was effective in increasing vitamin D levels in a group of elite athletes. I used to take 5000IU per day in the winter, when my sun exposure was essentially non-existent, and 2500IU in the summer when I was getting more sun. Ideally, you should choose a supplement that contains vitamin D3, the more readily available form. Often this comes in an oil-based capsule, which is fine; if it comes in more of a powder, consuming it with fatty foods will increase absorption. Supplementation has some benefits. You know how much you’re getting (assuming the manufacturers are truthful), and you aren’t risking skin damage from the sun.

Does supplementation help? The Close article cited earlier has a second part. The researchers recruited 14 footballers from a Premier League club academy (not a huge sample, admittedly). Half took 5000IU of vitamin D per day for eight weeks, the other half a placebo. The players did a battery of physical tests before and after supplementation.

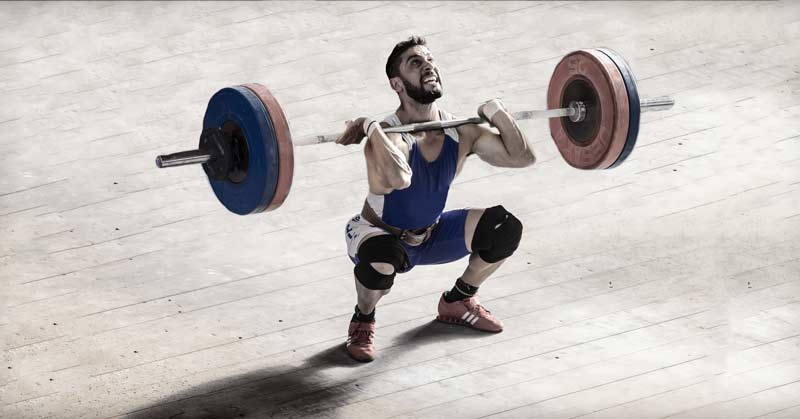
Both groups increased their plasma vitamin D levels, although only the supplementation group did significantly better—presumably the placebo group was also getting some sun exposure. The supplement group saw a significant improvement in their vertical jump and 10m sprint performance, while the placebo group didn’t. There was a trend toward significance in improvements in 1-RM bench press and back squat too; this means it didn’t quite meet the significance level but was close. The supplement group improved bench press on average by 6.5kg, compared to 2.5kg in the placebo group. Back squat 1RM improved by 9kg, compared to 3kg in the placebo group.

Makes you want to use vitamin D supplements, doesn’t it! Just remember that these athletes were not only most likely deficient to start with, but also still developing physically. It follows that greater improvements would be likely. The same research group conducted a larger research trial a year later and found no effect of vitamin D supplementation on performance measures.

In a group of ballet dancers, daily supplementation with 2000IU increased vertical jump (a measure of power) and reduced injury risk. In a group of Greek professional soccer players, increased vitamin D levels were associated with performance improvements in various jumping exercises, sprint performance, and VO2 max. Subjects in this study did not undertake supplementation but instead received all their vitamin D from the sun.

Some early research shows that vitamin D may have a role in increasing type II muscle fibers. This research was conducted in stroke patients, so we have no idea if it would still be the case in healthy individuals. Similarly, animal studies suggest that vitamin D intake might have a role in protein synthesis. These results have not been replicated, especially in humans.

Vitamin D supplementation may have a protective effect against injuries, particularly stress fractures. In a group of female Navy recruits, daily supplementation of just 800IU vitamin D reduced stress fracture risk by 20%. Similarly, higher intakes of vitamin D in a group of female cross country runners were associated with a decreased risk of stress fracture.

Vitamin D supplementation can increase testosterone levels. Higher levels of testosterone may be associated with more favorable adaptations to resistance exercise (although the evidence on this isn’t always great), and may also increase competitive drive. In this study, daily supplemention of 3332IU for a year led to a significant increase in testosterone levels.

Vitamin D supplements can have a positive effect on muscle recovery. In a 2013 study, researchers gave a group of males either 4000IU per day for 28 days or a placebo before they underwent a fairly strenuous exercise protocol. Subjects who supplemented with vitamin D had a lesser increase in biomarkers associated with muscle damage and soreness than those in the placebo group.

Finally, sufficient levels of vitamin D can have an important knock-on effect by improving post-exercise recovery, possibly by causing an increasing in anti-inflammatory cytokines. Low levels of vitamin D are also associated with an increased risk of illness.

Testing of Vitamin D

Vitamin D testing is relatively easy and straightforward, depending on where you live and regulations governing that region. In the UK, vitamin D testing can be conducted via a GP (if you ask nicely), or you can order a kit online for less than £40. In the USA, tests cost about $50. In Australia, vitamin D tests cannot be sold directly to consumers, Testing needs to be conducted by a practitioner.

After getting your vitamin D tested, it’s important to know how to interpret the results. The Institute of Medicine (IOM) provides these guidelines:

  • <30 nmol/l – deficient
  • 30-50 nmol/l – inadequate
  • 50> nmol/l – adequate

When I was an athlete, my governing body regularly conducted vitamin D testing. Their guidelines were similar to the IOM–they didn’t want any athletes below 50 nmol/l, and preferred us to be around 100 nmol/l. Some blood tests give results in ng/ml, so you will have to convert to nmol/l. Plenty of online calculators do this.

Summary and Conclusions

Vitamin D deficiency and insufficiency are common in athletes. This can lead to a whole host of issues, including increased injury risk, poorer recovery, reduced muscle strength, and decreased immune function. Vitamin D can be obtained in relatively small amounts from food. Sun exposure represents an excellent source of vitamin D. However, the possibility of skin cancer should not be taken lightly.

Supplementation appears to be the safest way to increase vitamin D levels. However, there are no accepted guidelines on supplementation levels for athletes. The majority of research uses daily doses of 2500IU-5000IU per day. This amount represents a good starting point. It is generally accepted that intakes below 10000IU per day are safe for most people. Regular blood testing of vitamin D levels is relatively inexpensive and gives a good indication of current supplemental needs. While the evidence shows that athletic performance can suffer if vitamin D levels fall below 50nmol/l, it is not clear that levels well above this enhance performance.

Since you’re here…
…we have a small favor to ask. More people are reading SimpliFaster than ever, and each week we bring you compelling content from coaches, sport scientists, and physiotherapists who are devoted to building better athletes. Please take a moment to share the articles on social media, engage the authors with questions and comments below, and link to articles when appropriate if you have a blog or participate on forums of related topics. — SF

Fatigued Runner

The Power of Persistence

Blog| ByChris Gallagher

Fatigued Runner

I wanted to share this because there will be other coaches out there who are trying to get a foot in the door or on the first rung of the ladder and struggling immensely. I think that this could also have broader reach to anyone interested or involved in working in performance sport, from physios to nutritionists to sports psychologists.

There are many other stories from coaches around the globe that are no doubt grander and more exciting. This is just my story of where I am, how I got there, and what I did to arrive at my present location. But I think it tells an important story about the power of persistence.

Figuring It All Out

I’ve always loved sport. Soccer mostly, but just about any sport. Academically, I was always in the top of my class. I was quite good at the read-and-remember style of education that was so prevalent. Although I did not struggle at school, P.E. (Physical Education) was always my favorite class. I also had an aptitude for science and related subjects like math. When I realized that I had no chance of being a professional athlete, of any kind, and it came time to decide on a university course, my thoughts went like this: “I like sport and I’m good at science. Sports Science seems the obvious choice.”

So I ended up studying Sports Science at the University of Glasgow. The further I got into my studies, the more I realized that strength and conditioning was the particular area in which I had the most interest. I’d rather be on the field or court or in the gym than in the lab.

Perhaps naïvely, I did not really start looking for practical experience until my final year. Maybe part of that was that, in Scottish universities, you don’t study sports science specifically in your first two years, just general courses such as biology. Therefore, it was later into my academic career when I realized what I really wanted to do.

Academically, the course at Glasgow University was fantastic. However, the opportunities to get my hands dirty were not plentiful and I had to develop my own major real-life sports science and S&C opportunities.

Because I did not have enough work experience to sustain me through my degree, I began to search the local area for sports teams operating at a decent level who might speak to me and let me come and intern or shadow a coach. I immediately discounted Rangers and Celtic as the two biggest sports institutions in Scotland. Falkirk FC, also playing in the top division in Scottish soccer, was only a train and a bus journey away. So I went through their website, contacted their sports scientist, and hassled them for a meeting.

After talking via phone and email, they agreed to let me come down and shadow the existing strength coach. Excellent. A proper start with a full-time, professional sports team playing at the highest level in that country. (No jokes about the state of Scottish soccer, please!) On my way to attend the first-ever session, the head of sports science phoned me. The full-time strength coach was off and I would be leading the session. Fake it ’til you make it, right?! I’d never led a strength and conditioning session before. The most I had done before this was gym training with my brother following bodybuilder splits.

They threw me in the deep end, and it was sink or swim time.

Richard Branson

It was great. I loved working with youth footballers to develop their strength and conditioning. I could combine my passion with my work. Over the next year, I spent many evenings with the strength coaches at Falkirk, delivering S&C sessions, undertaking performance testing, and learning my trade.

While undertaking my MSc in Strength and Conditioning at the University of Edinburgh, an opportunity arose to become a speed and development coach with academy players at the Scottish Rugby Union. This allowed me to diversify my experience, somewhat.

Developing a Network From Scratch

When my studies came to an end, I was working three jobs: full-time in a bar, part-time with a football club, and part-time with the National Rugby Union. It wasn’t sustainable and it wasn’t going to pay the bills. I ultimately moved back to my family home in London while I looked for a full-time S&C role.

Because I was back in the South of England with few connections, I had to seek out new opportunities. I took to online research again and found out that the head of academy strength and conditioning at the London Wasps RFC was my old rugby coach when I was a youth. I contacted him and was able to arrange a voluntary coaching opportunity with their academy players. The travel was complicated and time-consuming and the work was not full-time. However, it gave me some contacts and I hoped opportunities would develop.

During this period, I interviewed for a variety of sports science and strength and conditioning jobs all over the country. From Aberdeen to Manchester to South East England and everywhere else. I applied to every single job that came up. It was then that I began to really understand the importance of a network.

The English Institute of Sport interviewed me for the position of lead strength coach for English squash. Despite performing very well in the interview, and even being one of only two coaches interviewed who achieved a passing mark on a test they used to separate candidates, I was not selected. At the group interview, I discovered that one of the applicants was a former player who worked there part-time. Going up for the interview was always going to be a wasted journey, no matter how well I performed. That’s not bitterness: I have many more stories like this, as do many of my coaching friends. It’s just a fact of life.

I was beginning to lose faith in securing a full-time role. My family was pushing me towards going into another field, to use my book smarts and qualifications to take some kind of graduate job that paid well. I even attended an interview in London for some business-related job. I bombed. It was awful. My heart just wasn’t in it and the interviewer could tell that immediately.

Sometime around this point, an old university friend contacted me. He was working at the Hong Kong Institute of Sport as a strength and conditioning coach and they were advertising a new role. I applied immediately and was elated to take the job. I knew nothing about Hong Kong; I was just happy to give my career a big shot in the arm.

For the first time in my life, I travelled to Asia. When I moved there, it was my first time living outside of Europe. It was only the second time I had left Europe at all.

Persistence Pays Off

As with anything in life, it’s not all roses. There are things that frustrate and annoy me. But when I stop and look at the positives, these annoyances pale in comparison. This past summer, as we sat and watched the Rio Olympics, I had six athletes taking part in the rowing, long jump, and marathon. I’m not working with any Olympic medal winners…. yet. I plan to in the future.

I have worked with athletes to prepare for the Olympic Games, various World championships, the Asian Games, and other international events. I work with a squash player who is consistently in the Top 20 in the world and who reached a career-high ranking of 12.

Since arriving in Hong Kong, I have met a lot of great coaches, sport scientists, physios, and other support staff. I have travelled to the unrivalled Altis in Phoenix, Arizona, and spent time with Dan Pfaff, Stuart McMillan, and the other staff as they helped prepare World and Olympic champions and world record holders for competition. I attended the NSCA conference in Shanghai and delivered a presentation to an international audience.

Hell, I’ve experienced a lot of cool non-work-related things, too. I visited Fiji, which is the most beautiful holiday destination I have been to, and Thailand as well. Every weekend during the summer, I can take a boat trip off the coast of Hong Kong with my friends and a fridge full of beer, and anchor beside a secluded beach.

None of this would have happened without persistence, downright stubbornness, and a lack of care about hassling people. That first gig I secured with Falkirk came down to hounding the head sports scientist until he allowed me to attend. Then, right from my first day of shadowing, I had my first paying gig in strength and conditioning because the lead strength coach was ill.

There was a time where I wondered if it was all going to work out for me and if I was taking the right path. But having a strong will and determination, and being stubborn, meant I kept at it until the right break arrived. Moving to the other side of the world, when I had never lived outside of Europe before or so far from home by myself, was a big step. But I didn’t give it a second thought.

Keep Growing Your Network

My career path to date is real proof of the statement: “It’s not what you know, it’s who you know.” I wasn’t able to generate the right opportunities. I wasn’t able to leverage my network sufficiently and I had neglected to grow my network. But networking is huge in our highly competitive industry.

Something like 125-150 students came through my undergrad degree, and another 30 or so took the MSc course. Yet, I only know a handful who are currently working in performance sport. Many are personal trainers, P.E. teachers, and even policemen. There is, of course, nothing wrong with choosing these careers. And, no doubt, some of them made a deliberate choice. But I am positive that the vast majority wanted to work in elite sport. It’s just an incredibly tough industry to break into. Knowing the right people opens doors.

Begin developing your network as soon as you can. In general, most coaches and practitioners are happy to help if they have the time. For example, I visited my older brother in Charlotte earlier this year. While I was there, I went online to check out local venues and decided to hit up Mike Young of Athletic Lab and Joe Kenn of the Carolina Panthers. Despite being incredibly busy preparing athletes for the U.S. Olympic trials and the coming NFL season, respectively, they both were able to give me half a day to meet and talk shop and check out their training centers.

Recommendations for Success

As I said at the outset, my story is not special, nor is it necessarily very impressive. There will be many more coaches out there who have achieved more than I have, at a younger age. My story is merely unique to me. But I hope that it helps some aspiring coaches, sports scientists, nutritionists, and any other professional looking to get a start in elite sport.

Swimmer Training in Open Water

Here are my recommendations for success in this field, and any other goal you strive for in life:

  • Be persistent.
  • Don’t take no for an answer.
  • Be single-minded. Be stubborn!
  • Learn from my mistakes—broaden your horizons. Don’t limit your job hunt to your home country. You may need to take a big step to get the start you need.
  • Seek out each and every opportunity.
  • Never think you aren’t good enough. Apply anyway—you never know the response you will get.
  • Develop a network and leverage it.
  • Seek out new environments and experiences, and particularly anyone with a wealth of experience.
  • Read as much as possible.
  • Collect some qualifications (a degree, maybe a post grad, an industry certificate) but then make it a priority to collect experiences and contacts, too.

Since you’re here…
…we have a small favor to ask. More people are reading SimpliFaster than ever, and each week we bring you compelling content from coaches, sport scientists, and physiotherapists who are devoted to building better athletes. Please take a moment to share the articles on social media, engage the authors with questions and comments below, and link to articles when appropriate if you have a blog or participate on forums of related topics. — SF

Sprint Acceleration Drill

Can Your Kid Sprint?

Blog| ByTony Holler


Sprint Acceleration Drill

Summary

Teaching children proper sprinting technique is crucial for athletic development across many sports, noting that youth sports often neglect speed training in favor of endurance, resulting in poor mechanics.
Key takeaways include:

  • Kids should practice sprinting at full speed, without a ball, ideally wearing track spikes and having their sprints timed.
  • Effective sprint training involves short, intense sessions performed when the athlete is not tired, incorporating plyometrics and video feedback.
  • Parents are advised to find sprint coaches who emphasize alactic (short, high-intensity) training, use timing systems, and understand correct sprint mechanics.
  • The article cautions against coaches who push early sport specialization, use ineffective methods (like parachute running), or lack a track and field background.
  • Improving sprint speed can significantly benefit performance in other sports, like football, as illustrated by examples in the article.
  • A balanced approach is recommended, encouraging multi-sport participation alongside dedicated sprint training for overall athletic success.

Without sprint training, soccer breeds horrible sprint mechanics and slow runners. Same with football. Same with basketball. Same with baseball.

Kids need to sprint at full speed without a ball. They need to wear track spikes. If they aren’t wearing spikes, they aren’t sprinting. Sprints must be timed. Records must be kept. Every sprint must be less than five seconds in length. Any sprint more than five seconds trains something other than max-speed. Kids should perform all sprint training in a non-fatigued state. Sub-max sprinting will not make kids faster.

Sprint mechanics must be taught. Plyometrics must be included. Video must be analyzed. Rest, recovery, and growth must be respected. For optimum effectiveness, kids must sprint two or three times a week. Anything more than this is counterproductive. Less is more.

Kids Can Learn to Sprint

I’ve witnessed the evolution of sports in America. I played football, basketball, baseball, and ran track. Not once did I pay to play. I didn’t compete against teams from other towns until 7th grade. High school sports were covered by the local radio station and daily newspaper. I kept a scrapbook, not a Twitter account.

Times have changed. Youth sports have become a big deal. Parents invest. Parents strategize. Before kids learn to multiply and divide, they’re playing soccer against teams from other towns. Before kids read Charlotte’s Web, their baseball teams have traveled to out-of-state tournaments. Most boys have played football for several years before they enter high school.

Most kids learn to play their sport but never learn to sprint. Share on X

With this great interest in youth sports, you would think kids would be faster than ever. I’ve found the opposite to be true. Most kids learn to play their sport but never learn to sprint. Sprinting must be taught and practiced. This seldom happens in youth sports.

My advice to athletic-minded parents: Teach your kid to sprint.

Running is Not Sprinting

It seems all little kids play soccer these days. Soccer is an endurance sport. Typical soccer players run seven miles per match on average. Sometimes I see soccer players run faster than others, but I seldom see sprinting. Sprinting doesn’t happen during a seven-mile run. You might be the fastest slow person, but that doesn’t make you a sprinter.

No one sprints in a state of fatigue. Endurance athletes are efficient, not fast. To keep running for an extended amount of time, athletes learn to compensate to keep going. Compensations become habits.

Compensations are adjustments made, often unconsciously, to survive a task. Sprinting is never achieved in high-volume situations. Athletes instinctively switch to auto-pilot, choosing efficiency and survival. When kids compete for an hour, they’re never sprinting. They may be running relatively fast, but they’re not sprinting.

Distance Runners
Photo 1. Distance runners have poor sprint habits. To stay efficient, they barely pick up their feet. If you don’t pick up your feet, you can’t produce much vertical force. On a side note, check out their footwear. Padded running shoes are good for shock absorption, bad for vertical force.


Sprinters with High Knee Lift
Photo 2. Sprinters pick up their feet, lift their knees, and produce tons of vertical force. Sprint spikes are engineered to produce maximum vertical force and zero shock absorption. You won’t find padding in Usain Bolt’s spikes.


Speed Can be Taught and Learned: Clayton Lakatos, 4th Grade

Clayton Lakatos is a 75-pound 10-year-old. Clayton comes from an athletic family and has played soccer, baseball, and flag football. Sounds like your typical athletic kid.

A closer look, however, reveals Clayton is different. Clayton was taught to sprint by his dad, one of the best track coaches in the state of Illinois. Chad Lakatos coaches at Edwardsville High School. Edwardsville won the Illinois 3A (big school) title in 2015 and placed 2nd in 2012, 2014, and 2016.

Sprint Drive Phase
Photo 3. Clayton Lakatos comes out of his drive phase, about to get tall and max-sprint. He’s in a perfect position to deliver a strong vertical force to the track.


Good sprint coaches are data-driven. I have timed over 200,000 40s in my coaching career. Check out Clayton’s 40 times in the graph below.

40 yard dash times
Figure 1. Not many kids run 5.45 at age 9. Speed can be treated as a genetic trait or a skill. Although a genetic component is indisputable, speed can be taught and learned.


Illinois Track Coach Chad Lakatos
Photo 4. Chad Lakatos is the only Illinois coach to win a Class A and Class AAA state championship. Notice his son, Clayton, is wearing his soccer uniform; you don’t have to give up other sports to be a sprinter.


Clayton’s additional marks at age 9. All of these are sprint-dependent.

  • 100m 15.2
  • 200m 33.3
  • 400m 1:25.4
  • Long Jump 12’0”
  • High Jump 4’0”
Sprint Mechanics
Photo 5. Isaiah Michl, coached by Chad Lakatos, as a senior at Edwardsville two years ago. Isaiah ran on state championship 4×1 and 4×2 teams, although he was better known as a hurdler (37.13 in the 300 hurdles). Isaiah now runs at the University of Illinois.


Sprint Mechanics
Photo 6. Clayton Lakatos, age 10, is also coached by Chad Lakatos, his father. Compare his form to Isaiah’s, who is a few years older.


Speed Training Makes Football Players Faster: T.J. Kane, High School Athlete

T.J. Kane was a typical athletic kid. He was best at throwing and catching a football. As a freshman, T.J. was my starting quarterback for a team that went 9-0, outscoring their opponents 458-38. As a sophomore, T.J. again quarterbacked his group to a 9-0 season. Then something crazy happened. T.J. went out for the track team and got fast. T.J. is now an elite high school wide receiver and plans to play college football.

Plainfield North TJ Kane
Photo 7. T.J. Kane races for the end zone, scoring the first touchdown in Plainfield North’s 42-0 rout of Highland Park in round #1 of the 7A IHSA Playoffs.


I don’t think fast was ever used to describe T.J. as a young athlete (that’s a polite way to say that T.J. was slow). He’s still not a candidate to run on my 4×1, but he sure looks fast on the football field. Based on the graphs below, we expect T.J.’s speed numbers to improve.

10 meter fly times
Figure 2. T.J. Kane did not begin consistent speed training until his freshmen year in high school. His time in the 10m fly continues to drop.


40 yard dash times
Figure 3. As a sophomore and junior, T.J. speed trained from December until May, and his times in the 40-yard dash continue to improve.


Athletes get fast when they develop good sprint habits. I believe every football player should sprint train consistently starting at the end of football, continuing through the track season, and into the summer. We are what we do.

T.J.’s dad, Tim Kane, is the head football coach at Plainfield North High School. I’ve been on Coach Kane’s football staff for eleven years. Tim has always promoted my speed training. We have our differences, but we always agree on the subject of speed. You might see this as a natural relationship between a football coach and a track coach, but it’s often the opposite. Football coaches sometimes use the term track speed as a dog whistle for wimp speed.

Last week, when I told a track coach to bring their football coach to TFC-4, the track coach replied, “We have a better chance of developing cold fusion.”

Where to Find Sprint Training

The best way to get fast is to join the track team. Competition and measured efforts take athletes to new levels. I cannot emphasize this enough.

Off-Season Speed Training: Sprint Coaching Methods to Look For

  • Make sure sprinting is timed. If sprinting is not timed, it’s not sprinting. If you see a Freelap timing system, you know you’re on the right track. If you see the sprint coach meticulously recording times and giving athletes instant feedback, you have the right place.
  • Look for a sprint coach who believes in alactic training. Alactic training is maximum intensity work for less than ten seconds followed by enough rest to repeat the effort on the next attempt. Mindless weight lifting, grueling aerobic workouts, and multiple repeats of 200 meters have no place in sprint training.
Look for a sprint coach who believes in alactic training. Share on X
  • If you see mini-hurdles, the coach probably knows his stuff. Wicket drills (running over mini-hurdles) is a staple of sprint training. Remember, sprinters pick up their feet, lift their knees, and then deliver vertical force.
  • Look for a sprint coach whose strength training looks different than your high school football team back in the 80’s or 90’s. The old bench press, curl, and squat guys are going extinct, thankfully. By the way, sprinting is the best strength exercise I know.
  • Find someone who has a true track and field sprint background.
  • Video analysis is a part of every reputable sprint program. In today’s era of slow motion video on every iPhone, it’s inexcusable to train without video.
  • If you see a poster saying Train Smarter, Not Harder, you’ve probably found the right place.

Off-Season Speed Training: Sprint Coaching Methods to Avoid

  • If a speed coach tries to convince your kid to specialize in one sport, sever ties immediately. No entrepreneurial coach should put training in conflict with playing multiple sports.
  • If you see guys running with parachutes behind them, turn around and walk out. Sprint training requires ground contact times of a fraction of a second (0.08 in elite sprinters). If you are pushing things, pulling things, running slowly uphill, or running with parachutes, your contact time won’t be 0.08. You might as well be wearing ankle weights (don’t wear ankle weights either). Note: I’m talking sprint training. Coaches will often push and pull things to train acceleration. When accelerating, ground contact times are much longer than max-speed sprinting. In my opinion, the best indicator of sprint ability is max-speed. The 10m fly is a much better predictor of success than the 10m start. Give me a guy who runs 25 mph, and acceleration will be learned quickly.
The best indicator of sprint ability is max-speed. Share on X
  • Be cautious of speed training with ex-NFL players and ex-college athletes who failed to graduate. In my experience, these entrepreneurs attempt to use their athletic resume to hide their inexperience as coaches.
  • Too many ex-football players are addicted to the grind of football training. The grind has nothing to do with sprinting. Training hard seven days a week will make athletes slow and trainers rich.
  • Avoid places that advertise muscled-up athletes wearing No Pain, No Gain t-shirts with cut-off sleeves. Bodybuilding is for magazine covers, not for speed.
  • If you see a sign that says, Train Insane or Remain the Same, run away.

FAQ

Why should kids learn to sprint?

Sprinting is crucial for athletic development across many sports, and youth sports often neglect speed training, leading to poor mechanics.

What are some recommended methods for teaching kids to sprint?

Kids should sprint at full speed without a ball, wear track spikes, have their sprints timed, and train with short, intense sessions when not fatigued, incorporating plyometrics and video analysis.

What kind of sprint coach should parents look for?

Parents should seek coaches who prioritize alactic training (short sprint with high-intensity), use timing systems, and understand proper sprint mechanics, preferably with a track and field background.

What kind of coaching practices should parents avoid?

Parents should avoid coaches who promote early sport specialization, use ineffective training methods (like parachute running), or lack a track and field background.

Can sprint training help in other sports?

Yes, sprint training improves athletes’ speed, benefiting their performance in sports like football.

What is the best way to start athlete training?

The best way to start athlete training is by consulting with a qualified coach to assess your current fitness level and goals. They can help create a personalized plan that includes a gradual progression of exercises, proper technique, and rest periods to prevent injury and maximize results.

How often should an athlete rest?

Rest is crucial for athletes. The frequency depends on the intensity and volume of training, but generally, incorporating at least 1-2 active recovery days and ensuring adequate sleep (7-9 hours for adults, more for younger athletes) is vital for muscle repair, energy restoration, and injury prevention.

Since you’re here…
…we have a small favor to ask. More people are reading SimpliFaster than ever, and each week we bring you compelling content from coaches, sport scientists, and physiotherapists who are devoted to building better athletes. Please take a moment to share the articles on social media, engage the authors with questions and comments below, and link to articles when appropriate if you have a blog or participate on forums of related topics. — SF


Front Squat Bar Velocity

Olympic Lifts: The Importance of Peak Velocity and Recommended Guidelines

Blog| ByBryan Mann

Front Squat Bar Velocity

For athletes doing Olympic lifts to improve sports performance, measuring peak velocity provides the best information for progressing their loads. Peak velocity also represents an athlete’s capabilities better than mean and average velocity and is not affected by injuries. These athletes don’t perform Olympic lifts to participate in weightlifting competitions; they do the lifts to improve sporting form. Their goal is to increase their speed-strength ability and explosive power.

When I began measuring bar velocity, the only metrics available were mean velocity and mean power. The software and hardware at the time were not sufficiently advanced to determine peak velocity. It’s been this way since the 1960’s when the Soviets began using velocity to analyze their lifts. It wasn’t until a few years ago that peak velocity became available.

Because I used mean velocity for a decade with great results, I was quite hesitant to change my recommendations. For each Olympic lift, I knew what the mean velocities should be. I even had it broken down by height. Why, then, would I want to change? Over the past five years, a plethora of information has become available and has greatly influenced my thoughts on what to use and why.

To begin, let’s address the confusion that seems to exist about the definitions of mean and peak velocity. Mean velocity is the average (or mean) for the velocity over an exercise’s entire concentric portion, from start to finish. Peak velocity is the fastest point during the concentric portion.

Why use one and not the other? For one, many lifts, such as squats and bench presses, have an acceleration (propulsive) and a deceleration phase. Because the two motions always occur during the concentric phase, the concentric phase is the most beneficial and stable to use for measurement. You can use mean velocity for Olympic lifts, but it might not be the best choice.

In my opinion, there are several reasons to use peak velocity for Olympic lifts:

  • The defined moment at which peak velocity occurs
  • The ballistic nature of the exercise
  • The alterations to technique that occur as a result of feedback of mean velocity
  • The inaccuracy for those with orthopedic issues
  • The difficulty for systems to determine when and what to measure for mean velocity

I’ve done most of my work with LPTs, such as GymAware. Other means of measuring velocity may lead to different reported numbers. This doesn’t mean those measurements are wrong; they’re just measured by a different means. The need may exist to look at velocity zones and profiles of individual lifts with an alternative device such as body, limb, and barbell velocity.

The Defined Moment at Which Peak Velocity Occurs

In a 2014 study done by Harbili et al.1 examining both the clean and snatch, researchers found the single moment when weightlifters hit peak velocity. This occurs at the top of the second pull. The athletes accelerated up to this point and decelerated beyond this point. Since we know when the peak occurs and now have the ability to measure peak velocity when it occurs, it only makes sense to utilize peak velocity as a metric to evaluate the lifts.

Orthopedic Issues Leading to Form Discrepancies

Over the years, I’ve noticed a common trend with athletes. They get injured, and the injuries stick around for a while. Injuries to the wrist, shoulder, and elbow are quite common among a multitude of sports, and these joint injuries can greatly impede the catching portion of the lift movements. I’ve seen several athletes with these issues who have a marvelously fast looking pull only to have a very suboptimal reading from their device because their rack was slow. Their injuries slowed down their movement during this portion of the exercise. Because the mean velocity is the mean from the beginning to the end of the movement, the slow catch decreases the velocity measurement.

These athletes often become quite frustrated, and rightly so. They’re being held back by a parameter instilled by us, and they are unable to do anything about it. While the mean velocity’s feedback is important and useful, it shouldn’t be the determining factor. By utilizing peak velocity, we eliminate the portion of the lift causing problems and impeding results. With peak velocity, athletes are better able to overload the movement and see a better transfer to their sport.

The Ballistic Nature

In a ballistic exercise, there’s an initial rapid and powerful force followed by a projection of the body, load, or implement into the air.2, 3 This is true for jump training and med ball training, but what about Olympic lifts? In a lift, peak velocity occurs at the top of the second pull. The athlete then projects the barbell into the air and attempts to drop their body under the bar to catch it in a racked position. Then they stand up for the recovery of the movement. Look back at the descriptions of the ballistic exercise and the Olympic lift. Both involve projection. When projection occurs, muscular force does not determine barbell deceleration, gravity does.

Conversely, when an athlete performs a traditional strength training movement such as a squat or bench press, muscular force determines the barbell’s deceleration. If left to gravity, the barbell will fall from the hands. Since muscular force slows down the barbell, we should measure muscular force from beginning to end because this measurement matters.4, 5, 6 To counter this, some systems use mean propulsive velocity, but this only measures the propulsive phase of the movement and disregards the decelerating phase.

I’m quite comfortable recommending mean velocity with traditional strength training because the predictive values are not much different, with R-squared and standard error estimate values being R2=.981, SEE=3.56% for MPV and R2= .979, SEE=3.77% 5 and the paucity of equipment that actually calculates MPV.

As practitioners, we should only measure and manage what we can measure and manage. We should use peak velocity for Olympic lifts because the speed of gravity will not change and the decelerating phase is irrelevant.

Alterations to Form as a Result of Mean Feedback

Athletes are kinesthetically aware and competitive. Once they understand that the objective is to obtain the highest possible number, they’ll begin to alter technique to accomplish this. For a movement done from the hang, athletes often dip below the knees to the mid-shin. More commonly, when performing a movement from the floor, they’ll try to move as fast as possible rather than doing a slow and controlled first pull into double knee bend. They’ll often shoot their hips into the air and back to get a greater ROM to produce force and achieve the highest velocity.

We know these are not acceptable movements, and they will not transfer to the playing arena. The athlete is trying to beat their opponent or teammate in barbell velocity. It’s tougher to cheat the peak velocity through momentum from an entire movement when trying to achieve a higher score. Again, I believe peak is better.

Different Heights Require Different Velocities

As previously mentioned, different ROM distances among the lifts will require different velocities. This is also true for athletes of varying heights. A few years ago, we implemented VBT at Mizzou when we had a 6’8” offensive tackle and a 5’6” running back training together. At the time, we were using mean velocity, and I believe we were going with 1.3m/s for everyone on the team. The offensive tackle struggled to stand up with loads at that velocity, yet the running back did it with ease. What gives? Well, remember that velocity equals the change in distance/time. The offensive tackle had to move a greater distance in nearly identical time, causing the discrepancy. When we delved deeper, we started to dictate velocities up by height and had the tackle lift appropriate loads. Peak velocity is no different. Gravity plays on everyone with the same acceleration. The further we go against gravity, the harder we have to push to keep going, and the faster we have to move to get there.

Determination of Mean

Another issue concerns the measurement of mean velocity. When does it end? The device doesn’t tell us because it doesn’t recognize what’s going on with the movement nor what the athlete’s intended motion is.

We see an example in the graph below. The blue line indicates the position, the red line indicates the velocity, and the blue shading indicates what was measured for the mean velocity. If you look at each of the three repetitions, you’ll see that each was measured differently. Why? Because of the way the athlete was moving. Sometimes the barbell came to a complete stop for the catch and sometimes it did not. However, peak velocity for each movement occurred at the same point. The blue line indicates the barbell’s position and the red line indicates the movement’s velocity. (We can get more information by looking to the right at the bar path. It’s a nice little feature in my opinion, but completely irrelevant to the discussion at hand.)

Power Clean GymAware Bar Velocity
Figure 1. Velocity measurements for the power clean.

The devices used to collect velocity are only measurement devices. Think of a tape measure. It goes where we put it. It doesn’t tell us if the hook came off the end or if there’s a staple at the end of a board we’re using. It doesn’t tell us if the spot we’ve measured at a moment in time is the actual spot we want to measure. It only tells us the distance from the endpoint to here. While they have incredible software and usability, the devices only know whether or not something is moving.

When we look at the first repetition in the graph, it appears that the person caught the barbell standing all of the way up with their legs locked out, so the device read the average of the velocity during that entire pull to catch. On repetitions two and three, the barbell didn’t travel in the same manner, and the device thought that movement was completed far sooner. Although there would be very distinct velocities during reps 1, 2, and 3, they look close to the same. The lift was performed just differently enough for the system to calculate it differently.

If we refer to Nate Silver’s The Signal and the Noise: Why So Many Predictions Fail–but Some Don’t, we see that the signal clearly exists in the peak velocity but is muddied in the mean velocity.

But Wait. I Have Been Using Mean Velocity for Years!

Mean velocity has been used with the Olympic lifts since the 1960’s in the Soviet Union. R.A. Roman, in his text The Training of the Weightlifter,7 published the most effective mean velocities for improving 1RM in training. If the barbell slowed down or did not move fast enough, something was wrong with the technique. Note that the individuals only did Olympic lifts, and they were quite proficient at them. Also, they did not experience other incidences that could cause injuries that might alter form.

Roman outlined the velocities for the various lifts which I’ve listed in the table below. The information was adapted to fit the nomenclature and style of the program at the University of Missouri at the time of development.8

Table 1. Velocities for various lifts.
Exercise Velocity
Snatch from floor 1.52-1.67m/s
Snatch Power Pull 1.81m/s
Snatch Power Shrug 1.45m/s
Hang Snatch 1.96m/s
Power Clean 1.2-1.32m/s
Hang Clean 1.3-1.4m/s
Power Shrug 1.15m/s

When dealing with neurologically trained Olympic lifters, the relationship between peak velocity and mean velocity is so strong that choosing only one of the measurements would prove to be nearly irrelevant. Some athletes may have discrepancies with form that would make the best choice peak velocity. On average, however, it seems either is a useful tool. When an athlete performs a lift properly, a strong relationship exists between peak and mean velocity.

However, when Olympic lifts are done to improve performance in another sport, portions of the technique seem to be lost in translation. Most athletes do a good job with the pull but tend to lose their technique during the racking phase. This is usually related to two things: the athlete’s lack of familiarity in racking the lift and their orthopedic issues.

Important Point

When examining the Olympic lifts, we ought to realize their purpose. For most athletes, the goal is to increase their speed-strength ability and explosive power. It’s not to have perfect technique in a clean. This is akin to Olympic weightlifters playing soccer or basketball for aerobic work. They’re not going to have perfect, or in some cases even proficient, technique or form when dribbling, shooting, and passing. They’ll look like Olympic lifters trying to play soccer or basketball. Why, then, are we so concerned with perfect technique of the Olympic lifts?

Average velocity assumes that the athlete has excellent technique on the lift. If any portion of the movement slows down, the average velocity suffers. It appears that the racking position of the clean or snatch is where most athletes trip up. This portion of the lift is inconsequential to improvements in explosive strength. For force production, what matters is the point where the barbell achieves peak velocity, which is the top of the second pull (if coming from the ground).

If a highly technical portion of the lift can be impaired by an athlete’s upper extremity and thorax injuries, why are we even concerned with the average velocity? We shouldn’t be, and that’s my point. The reason for performing Olympic lifts isn’t to participate in a weightlifting competition; it’s to improve sporting form. Olympic lifters spend hours upon hours and years upon years refining their technique on the clean, jerk, and snatch. Our athletes should spend hours upon hours and years upon years refining their technique on sports skills. Olympic lifting is special physical preparedness for the lifter and general physical preparedness for the athletes involved in other sports.

In my opinion, we need to get the most bang for our buck. Peak velocity tends to better represent our athletes’ capabilities. And a previous AC separation or shoulder dislocation will not matter. If they stand up with the bar, the only thing that matters is that the peak velocity as the average has been removed due to inefficiency and ineffectiveness.

The technical nature of Olympic lifts also requires a great amount of coaching. The catch is quite technical and requires a great amount of work by the athlete and knowledge, background, and coaching from the coach. Pulls are quite simple, though, and achieve triple extension, one of the primary benefits of the Olympic lifts. I think we need to worry more on the pull and improve its technique over the catch.

In short, both average velocity and peak velocity have their place. With Olympic lifting athletes, using both provides good redundancy to keep technique in check. Otherwise, what truly matters is the velocity of the barbell at the top of the second pull, so let’s just focus on that and utilize peak velocity. It gives cleaner data.

As more data becomes available, we may make small alterations to the charts over the coming years. My aim is to perfect the system, but I’m far from that. I feel confident enough, however, to release these guidelines. What I’ve experienced matches materials from Ajan & Baroga9 as well as other coaches.

Based on my data and data from others, I have some points to make. All of the velocities listed for the clean and snatch are from the floor. From the hang, mean velocities will be a little bit faster. I have not discovered why exactly, but I’d wager it has something to do with the engagement of the stretch-reflex.

There’s also the confounding issue of individual variation. If an equation is right 80, 90, or even 99% of the time, then it doesn’t work a certain percentage of times as well. Realize that some people are outliers and may not fit these guideline velocities. For example, an athlete may appear to have great form, but they’re 5’9” and anytime they drop below 2.0m/s, they can’t catch the bar. When we see someone who clearly doesn’t meet the guidelines, we may have to adjust for that individual.

Recommended Guidelines

Table 2. Snatch from floor
Athlete Height Velocity
5′ and below 1.6m/s
5’2 1.85m/s
5’6″ 2.1m/s
5’10” 2.3m/s
6’2″ 2.5m/s
6’6″ 2.75m/s
6’10” 2.95m/s

Table 3. Clean from floor
Athlete Height Velocity
5′ and below 1.55m/s
5’6″ 1.7m/s
6’2″ 1.85m/s
6’10” 2.0m/s

Table 4. Jerk
Athlete Height Velocity
5′ and below 1.38m/s
5’6″ 1.59 m/s
6’2″ 1.8 m/s
6’10” 2.0 m/s

There are a plethora of reasons to use peak velocity for Olympic lifts, provided we have the ability to measure peak. We just need to pick the reason that makes the most sense to us. Remember that velocities depend on the type of measurement system you’re using. If you’re using an LPT, such as GymAware, these velocities should fit nicely. If you’re using TENDO, which works fantastically, ensure the setup is correct and that the tether is perpendicular to the platform during the lift.

Since you’re here…
…we have a small favor to ask. More people are reading SimpliFaster than ever, and each week we bring you compelling content from coaches, sport scientists, and physiotherapists who are devoted to building better athletes. Please take a moment to share the articles on social media, engage the authors with questions and comments below, and link to articles when appropriate if you have a blog or participate on forums of related topics. — SF

References

  1. Harbili, E and A. Alptekin. “Comparative Kinematic Analysis of the Snatch Lifts in Elite Male Adolescent Weightlifters.” Journal of Sports Science and Medicine. 13 (2014) 417-422.
  2. National Strength & Conditioning Association. Essentials of Strength Training and Conditioning. Champaign, IL: Human Kinetics, 2000.
  3. Siff, MC. Supertraining. Denver: 2000.
  4. Gonzalez-Badillo J.J., M.C. Marques, and L. Sanchez-Medina. “The Importance of Movement Velocity as a Measure to Control Resistance Training Intensity.” Journal of Human Kinetics. 29A (2011) 15-19.
  5. González-Badillo, J.J. and L. Sánchez-Medina. “Movement Velocity as a Measure of Loading Intensity in Resistance Training.” International Journal of Sports Medicine. 31 (2010) 347-352.
  6. Jandacka D, and P. Beremlijski. “Determination of Strength Exercise Intensities Based on the Load-Power-Velocity Relationship.” Journal of Human Kinetics. 11 (2011).
  7. Roman, R.A. The Training of the Weightlifter. Moscow: Sportivny Press, 1986.
  8. Mann, J.B. Power. “Bar Velocity Measuring Devices and Their Use for Autoregulation.” NSCA’s Hot Topic Series. 2011. www.nsca-lift.org.
  9. Ajan T., and Lazar Baroga. Weightlifting: Fitness for All Sports. Budapest, Hungary: International Weightlifting Federation, 1988.

SMU Discus Thrower Kylie Spurgeon

Misconceptions About Female Throwers

Blog| ByBill Peyton

SMU Discus Thrower Kylie Spurgeon

Most people picture a large, overweight athlete as the ideal or the norm for the shot put, hammer, discus, and weight throw. Yet, when I interviewed people for this story, including former Olympians, in nearly every case they also coached the throws, and most said that what they look for in a thrower is a tall, rangy athlete.

Some people think that a woman hammer thrower has to be a big, muscular woman. Sure, Tatyana Lysenta is No. 3 and Aksana Miankova is No. 4 in the world and both are about six-feet tall and weigh 180 pounds or less. However, Gulfiya Khanafeyeva is the seventh best hammer thrower in history and she was 5’8” and 150 pounds. Yelena (Priyma) Rigert of Russia was 5’5.5” and 139 pounds when she competed, and her top throw is still ranked in the Top 25. So, while being tall does help, all of the top women throwers are athletic regardless of their size.

SMU Discus Thrower Kylie Spurgeon
Image 1: Kylie Spurgeon was a two-time discus Oklahoma state champion from 2005-2007. She went on to throw at Southern Methodist University, until a back injury forced her to quit after her sophomore year. Despite the misconceptions about female throwers, Spurgeon is neither large nor overweight.

An important thing to keep in mind for women in these events is that their implements do not weigh as much as the men’s. Therefore, there is more of a premium on athletic ability, speed, and technique than in the men’s events. At the Olympic level you do have to be strong, but fat can actually be detrimental because it will just slow you down. At the lower levels of competition, you will see all types of bodies that work in the throwing events.

Throwers aren’t just big people that can’t run; it is quite the opposite, actually. ~Aubrey Baxter

I spoke with several female coaches and trainers with experience as throwers, as well as the father of a successful current high school thrower. We discussed the need to dispel misconceptions about female throwers, ideas on how to make the sport more popular and attractive to spectators, and how to get more girls involved.

Aubrey Baxter

Aubrey Baxter was born and raised in Redfield, SD. She was a decorated four-sport athlete in high school (track and field, volleyball, basketball, and softball). After graduating in 2004, she played college volleyball and competed in track and field for a year, and then decided after the season she would focus solely on track and field. She graduated with a bachelor’s degree from Black Hills State University in 2009 with a Psychology major and Sociology minor.

Altogether, Baxter is a 27-time All-American, and has won 15 National Championships (8 NAIA Titles at Black Hills State University and 7 USATF Club National Titles). The discus throw was her weakest event, as she tossed it “only” 169’5”.

Baxter competed in the 2016 U.S. Olympic Trials and finished in seventh place in the hammer throw, with a throw of 219’10” or 67.01 meters. She is also an applied technology specialist at Metropolitan Community College, a personal trainer with Nebraska Elite, an independent beauty consultant with Younique, and a life coach. She is married and has one son.

Bill Peyton: What things should a high school kid not do in training to be a discus thrower?

Aubrey Baxter: I don’t think kids should focus on what not to do, but instead on what they should do. Throwers aren’t just big people that can’t run; it is quite the opposite, actually. To be a successful thrower, you need to be an athlete. Every thrower needs to work on technique, strength, speed, and power, among other things.

BP: What things should a thrower do that will aid in their development?

AB: When I was younger, I went to a few throwing camps. The big one I went to was out in Custer, SD, which really showed me the possibilities that were available for me if I continued throwing. Going to camps, connecting with other throwers and coaches, being a student of your event—there are so many things that can aid someone in their development, along with the obvious one of working hard.

BP: How do you convince a girl to become a thrower and, just as importantly, how to
have the courage to stay with it?

AB: When I was younger, I struggled with my size. I hated how wide my shoulders were and I really struggled with it. However, if someone would have asked me what I wanted to be when I was older, I would have said a professional athlete. I wish I would have had someone like me say, “Well, that’s why you have wide shoulders, so that you can achieve that dream of yours.” My family and friends were great, but I needed someone like I am now to say that to me then.

Along with working at Metropolitan Community College, personal training at Nebraska Elite, training myself, and being a mother, I also do coaching and self-esteem training with young girls. I help girls figure out what they are passionate about. If it’s not throwing or track that’s totally fine, but I want them to find what they are passionate about and focus on positive things about themselves instead of negatives.

Powerlifter Salencia Algarin
Image 2: When young girls have the support of their parents, they’re likely to try sports that are not typical for their gender. Here, seven-year-old Salencia Algarin competes in weightlifting at the AAU Junior Olympic Games. Her father, Luis, is the state chairman for one of the largest powerlifting federations in the world.

BP: How can we get athletic women to become hammer throwers and to have the courage to stay with the event?

AB: I think if young girls see elite hammer throwers compete, they will want to do it too; especially the competitive, driven, and strong young ladies. The hammer throw is such an incredibly beautiful event that takes strength, power, technique, patience, hard work, time, etc.

Coach Bob McKay, the former U.S. Olympic Developmental Coach, told me that when Lance Deal, 1996 Olympic Silver Medalist, handed someone a hammer for the first time, he said, “Welcome to frustration.” This is so true. It’s the event that you have to go fast in, but be patient; you have to throw the ball in, but let it carry you. It’s maddening! But at the same time, it’s beautiful and so much fun to do. I think if people watch elite hammer throwers compete, they will see how amazing the event and the athletes that do it are.

BP: What might surprise people about throwing in track and field?

AB: I don’t know if this would surprise people or not—definitely not throwers—but I think the progression of all of the throws is beautiful. It’s amazing to break down throws into the path the implement travels and that feeling of an effortless throw. It’s beautiful.

BP: How can we make throwing in general more popular?

AB: In order to make throwing more popular, we need to be seen. Throwers need to be focused on (along with field events in general). If some of our stories got out, I think we would have a lot bigger following. But no one knows who we are because we are never covered by the media. I wish that the amazing people who compete for this country (I am biased toward throwers, of course) would be showcased and supported more because they deserve it.

BP: I’m hearing people say to put the throwing events inside the track. You have seen more top-level track meets than I have. With artificial turf, potential injuries, and other issues, how do we do this?

AB: I know that throwing on the infield would help, but yes, there are safety concerns there. I think the biggest thing is for the media to step in. Showcase throwers, share their stories, and people will fall in love. Throwers are a different breed, but I have had some of my best memories being around throwers. They love what they do, they are passionate, they are a little crazy, but they are usually a blast to be around.

BP: Both boys and girls go into the throws as something to do between seasons. They do not take it seriously. The money goes to football. Do you have any suggestions?

AB: Sadly, this is very much a reality. I can see this as being a negative, but at the same time, a positive. Yes, we lose many athletes to other sports because they are more popular than track and field, and that is too bad. I feel like we, USATF, the media—everyone has to do their part in sharing how amazing throwing events and the athletes that throw are. We go outside and throw things as far as we can, that’s awesome! The positive to losing some athletes to other sports is that we are left with the people that really do love throwing, and that creates an amazing atmosphere when you get a group of throwers together.

BP: Are throwing events emphasized enough at the grassroots levels?

AB: You have to be very careful with young kids when it comes to the throwing events. The hammer is an event that most people pick up later in their careers as throwers.

I had no idea what the hammer throw was before my freshman year of college; absolutely no clue at all. I have been part of numerous camps that try to teach young throwers the opportunities that are available to them if they work hard and stick to it.

Megan Schuessler Young

BP: Tell me about your own background in the throws. Include your childhood sports, reasons why you got involved with throwing events, best marks, and titles won, if any.

Megan Schuessler Young: I started throwing in the seventh grade when track season rolled around. Being a bigger, powerful girl, the throws were where my coaches guided me when choosing a field event.

Luckily, I had coaches that I liked and that liked me and I enjoyed the challenge of throwing, so I stuck with it. I grew up in the small town of Llano in the middle of Texas. As a kid, I played just about everything my town offered. My mom taught me tennis and my dad taught me softball/baseball and those were the two first sports I learned.

I took swimming lessons for long as I can remember and, though we didn’t have a competitive swim team, I really enjoyed swimming. I started playing basketball in second grade when they allowed us to sign up for Little Dribblers. I also did random activities at the local fitness center like gymnastics, ballet, and taekwondo. We didn’t have volleyball or soccer, so I never got to experience those sports that seem so popular now.

I don’t think I won any major titles. I was the high school district champion several times in shot put and in discus, but nothing in college. I did hold both my high school and the Texas Tech school records in the discus, but they were both quickly broken. My best marks (which took some Googling) were 46’9.5” in the shot put and 169’3” in the discus.

BP: How can we get more girls interested in the throwing events at the grassroots level and then help them have the courage to stick with it through their growing years?

MSY: I think that a lot of it starts with the parents. Parents are the ones who decide what their children will do; at least when they first start participating in activities. If parents have never been exposed to throwing or have a negative association with it, then they will not steer their children towards it.

For girls, throwing being thought of as “manly” seems be the biggest hurdle. This is an issue especially for middle school girls, which is when most girls first experience track and field. They are so concerned with how they look and how others perceive them. Changing that perception is a big key to getting girls to try and stick with throws.

Changing the perception of female throwers as “manly” is a key to getting girls to try throwing. Share on X

I think if there was a way to get parents and families out to watch track meets, and for young girls to see how graceful and powerful elite level throwers are, they might be more inclined to throw. This might also help girls to see that throwers are not typically the big slow girls who are throwing because they cannot do anything else, but are really exceptional athletes doing very difficult movements in a powerful way.

Convincing parents of the merits of track and field on their child’s athletic development could also be helpful. I hear all the time that, “I put my kid in (blank) so they can improve their (blank).” You could fill in the blanks with just about any skill and any sport, such as soccer for agility or football for power.

The beauty of track and field is that is has the potential to teach and allow kids to practice an enormous array of skills in a one-stop shop. If parents could see that, I think they would be more likely to sign their kids up for track earlier and therefore instill in them a feeling for “I do track” that’s like the way most of the kids that I work with feel about soccer, softball, and volleyball. As a side bonus, they might actually learn to run correctly at an early age, which will benefit them for every sport down the road, and develop a mental toughness that could also help them in all sports, and in life in general.

Youth track and field also should become elite. In my experience, summer track and track clubs are a “you-pay, you-join system.” Track and field is just happy to have people interested. However, as seen with the AAU basketball, club soccer, and travel softball teams, etc., the harder it is to get into something and the more it costs, the more people want to do it and the more invested they are in it. If a parent pays $3,000 for a club sport and the kid has to try out to even make the team, then, by golly, that kid is going to every practice and game and will do so with a smile on their face. If a parent pays a minimal fee and their kid gets to compete no matter what, who cares?

On the flip side of that, it takes a special person to be a thrower. It is not for everyone and kids should not be forced into it or they will hate it. However, if a girl does like to throw, having parents and coaches who are encouraging and supportive is good for helping a girl to keep throwing during her growing years.

BP: Is there a way we could get the throwing events inside track and field stadiums or at least nearby?

MSY: With younger children, I am OK with field events being outside the track. You never know where the implement is going to go, and with the already cramped time schedule, it would be almost impossible to schedule throwing events when there aren’t running events going on.

I do think it helps the atmosphere of the throws when there are more people watching. The reality is that, if the throws area is outside the track, the average track fan is not going to miss everything else going on at the track to go watch throws.

BP: There are a few isolated smaller events where the throws are featured. (I am thinking of the Golden League.) However, the organizing groups seem to be against this type of thing. Do you think we should pursue shorter, more concentrated meets?

MSY: I think anytime we can have meets that are advertised and made to be entertaining and exciting, it’s a good thing for track and field in general. People have short attention spans and some people will balk at taking their families for an entire day or night of track and field.

I do like the idea of shorter, more focused events, especially out in public places like the shot put in downtown Lawrence for the Kansas Relays or pole vaulting in the mall for the Drake Relays. The more everyday people who know nothing about track and field can be exposed to it, even by accident, the easier it is for kids to get excited about track.

BP: A key to getting girls involved with throwing events, and athletics in general, may be to develop, hire, and maintain women coaches. Is there a way we could do this well?

I don’t think it matters if a coach is male or female. What matters is how educated and enthusiastic they are about coaching the throws. ~Megan Schuessler Young

MSY: I don’t think it matters if a coach is male or female. What matters is how educated and enthusiastic they are about coaching the throws. The job of throws coaching in middle or high school is often given to a coach, whether they want it or not and even if they know nothing about it. But even then, a coach who is willing to learn and who shows up every day to practice eager to help his or her athletes get better is what young athletes need.

A coach who is just “getting through” track season is not helpful for the progression of the athletes or the sport. There has to be better education for throws coaches. Throwing is such a complicated event to coach and not many people put the time they really should into learning how to coach it.

Ramona Pagel

Ramona Pagel was born in Los Angeles, CA, and married Kent Pagel, a former UCLA thrower. He coached her throughout much of her career. She graduated from Long Beach State University in 1982 and San Diego State University in 1984. After leaving SDSU, Pagel made four consecutive Olympic teams, 1984–1996, in the shot put.

Pagel held the American record in the shot put for 25 years and also spent eight years on the Top Ten list for Americans in discus, until back problems caused her to choose to focus on her best event. She currently works as the Wellness Director with the U.S. Navy NBVC. She also worked as a coach for 28 years at the collegiate level.

Personal Bests:
Shot Put: 66’2.5”; 20.18m
Discus: 203’2”; 61.92m
Javelin: 150’2”; 45.77m

BP: How can we get more girls interested in the throwing events at the grassroots level and then help them have the courage to stick with it through their growing years?

Ramona Pagel: It would be easier for the women to use a lighter shot put in high school. The men go from 12-16 pounds, whereas the women use a 4kg as a 14- or 15-year-old and on up. A 3kg or 3.5kg for girls in high school would allow them to learn the technique without being intimidated by the weight.

BP: Is there a way we could get the throwing events inside track and field stadiums or at least nearby?

RP: Only if we eliminate football and soccer. The cost of grooming infields and the ability of schools to rent out their fields is precluding our use of the turf field. Better understanding of the events by announcers or having an announcer at the events that are out of sight would help.

Shot Putter Ramona Pagel
Image 3: Ramona Pagel, who took her place on four U.S. Olympic teams as a champion shot putter, from 1984-1996. Her best throw of 20.18 meters held the American record for 25 years. She was also a top discus thrower, until back problems forced her to focus solely on shot put.

BP: There are a few isolated smaller events where the throws are featured. (I am thinking of the Golden League.) However, the organizing groups seem to be against this type of thing. Do you think we should pursue shorter, more concentrated meets?

RP: Meet directors are influenced by an athlete’s marketability and much of that involves changing the public’s perception of throwing events, as compared to more popular events like football games.

BP: A key to getting girls involved with throwing events and athletics in general is to develop, hire, and maintain women coaches. Is there a way we could do this well?

RP: More women coaches would be great. There seems to be more pressure to perform as a female coach, as they always have to do better than the male coaches, for less pay. High school coaches do not get paid much for coaching, so it becomes a passion profession.

College track and field coaches are paid on the lowest scale, and rarely is a throwing coach considered for a head coach position. So pay for the most part is at entry level. I see many good coaches go into administration because, once they have a family, the hours are regular and they get paid more. It does not make sense, but the change will have to start with knowledge on the part of administrators and hiring committees.

Cathy Casey

Cathy Casey is in her 14th year (2002–present) at SMU, and is the head coach for the school’s cross country and track and field programs. She became the head cross country coach in 2005 and the head track and field coach in 2015.

Casey has played a pivotal role in the Mustangs’ swift rise to national prominence in cross country, winning five Conference championships (four C-USA and one American Athletic Conference) in the last seven years. During each of the championship seasons, she earned Coach of the Year honors. On the track, Casey specializes in the development of middle- and long-distance athletes.

She is native of Carbondale, Illinois, and was a member of the cross country/track and field team at the University of Texas, earning her degree in 1997. Casey currently resides in Dallas, TX, with her husband.

BP: How do you get athletic women to try the discus throw and, even more importantly,
have the courage to stay with it?

Cathy Casey: I think that we need more former throwers to coach our youth—female throwers in particular—to make sure the girls know that throwing is an option for them. We lose these kids to other sports like volleyball and basketball simply because these girls just don’t know how good they can be at throwing. With a technically sound coach, they will keep improving and therefore can have the confidence to continue with the event.

We need more former throwers to coach our youth—female throwers in particular—to make sure the girls know that throwing is an option for them. ~Cathy Casey

BP: How can we make throwing events more popular? The running and jumping events seem to be much more popular.

CC: I think that the throwing events can be made more popular by incorporating the throwing area at the track. Too many times, they are outside the main venue so that no one can see the throwers compete. Put on more throwing clinics and coaching education classes for throws. Put pressure on high schools to hire coaches with a track background.

Elizabeth Murphy

Elizabeth Murphy finished her first year as the SMU Track and Field Throws Coach in 2016. This was Murphy’s first step into coaching, after competing as a thrower as a graduate student at SMU and three years previously at Grand Valley State University.

Murphy returns to the Hilltop after competing in the weight throw and hammer throw for SMU in 2012–13, winning the Conference USA Outdoor Championship in the hammer throw and coming in third at the C-USA Indoor Championships in the weight throw. Those results, along with a 16th place finish at the NCAA Championships, earned her All-American status in her only year at SMU.

Prior to her time at SMU, Murphy was a two-time hammer throw champion and six-time All-American at the Division II level while at Grand Valley State. She also holds the record at the D-II level in the weight throw for indoor track and field.

BP: How do you get athletic women to try the discus throw and, even more importantly, have the courage to stay with it?

Elizabeth Murphy: I think most women start out trying the throwing events, in general, as an auxiliary sport. For example, basketball players decide to run track in the off-season to stay in shape. Some of the bigger girls on the basketball team end up throwing and being decent at it. I’m sure there are a handful of girls who want to be “throwers” and I’m sure, internationally, there are more women who want to be throwers than in the U.S.

If we want to talk specifically about discus, that’s probably one of the easier events to get women to throw. I’ve heard people describe the discus as “pretty,” so it is easy to understand why a woman would be more likely to throw discus rather than shot put. I feel like discus sheds the masculinity that is associated with shot put and that’s why more women gravitate towards disc than shot.

BP: How can we make throwing events more popular? The running and jumping events seem to be much more popular.

EM: I believe the unpopularity of the throwing events is an effect of a bigger problem. Our society doesn’t want to see women in a muscular state. These views are changing slightly, but they haven’t shifted enough to be accepting of different body types than what would be viewed as “ideal” for women.

The unpopularity of women’s throwing events is an effect of society’s views of “ideal” body type. Share on X

If I am going to be completely honest, when someone thinks of a female “thrower” they think of Mrs. Trunchbull from the movie Matilda, or they think of a woman who is of above-average size. Neither of these views is appealing to society, nor are they accepted by society. We need to change what is viewed as “normal” to encompass the growing athletic arena for women. I know you asked specifically about throwing events, but I believe this is related to most women’s sports.

Beth-el Algarin

I attended the Minnesota Section 5A meet at St. John’s University in Collegeville, MN, in early June. Beth-el Algarin was throwing the shot put for Pierz Healy High School, and she won that event along with the discus throw the same day. It was hard not to be intrigued by this little dynamo with the white shot put. Even to someone who does not know the throws that well, it was easy to see that she was much quicker than the other throwers. Algarin was the shortest and probably the lightest person in the finals.

I had the opportunity to listen to a person I thought was her coach. He had something to say to her after every throw and they both seemed to be having a lot of fun. It was obvious that Algarin was happy with her last throw, as she whooped it up and celebrated with the “coach,” who actually turned out to be her father, Luis Algarin. The throw was a personal record for her at 42’6”.

Mr. Algarin volunteered some information about his daughter, as it must have been obvious I was intrigued by her throwing. “She has been winning world powerlifting competitions since she was eight years old,” he said. “However, she started out with very light weights until she got a bit older. She can now bench press 275 pounds.”

Weightlifer Beth-el Algarin
Image 4: Beth-el Algarin, a high school sophomore thrower, is also a powerlifter. She has won an assortment of world lifting competitions and world records since she was eight years old, and can bench press 275 pounds.

It seemed that, although he was happy with how she performed at Sections, he just knew her potential was much higher. I asked him about his own athletic participation and he told me that he had once bench pressed 600 pounds in college!

Luis Algarin is the state chairman for one of the largest powerlifting federations in the world. So he is the main influence for Beth-el Algarin getting into the weight room and the record books. She holds 70-plus world records in various age and weight groups.

“She has tried to put her power to work in the throws, but it takes more than brute strength (as we have come to learn). Bottom line, strength is great, but technique is everything,” said Mr. Algarin.

Throws take more than brute strength. While strength is great, technique is everything. Share on X

Beth-el Algarin was a distance runner in cross country and track and field, while competing in world championship events in powerlifting. She won the conference championship in the 800-meter run as a seventh grader. She would still be running long-distance races if not for injuries to her knees.

Beth-el Algarin and Coach Teske
Image 5: Fifteen-year-old thrower Beth-el Algarin with Pierz Healy High School coach, Rich Teske. Algarin throws both shot put and discus. Although she’s been a weightlifter for years, she has learned the importance of throwing technique over brute strength.

The next week at the state meet, Beth-el Algarin finished in third place in the shot put at the State Class A meet with a throw of 41’1.5”. She was 1.5 inches away from second place.

Since you’re here…
…we have a small favor to ask. More people are reading SimpliFaster than ever, and each week we bring you compelling content from coaches, sport scientists, and physiotherapists who are devoted to building better athletes. Please take a moment to share the articles on social media, engage the authors with questions and comments below, and link to articles when appropriate if you have a blog or participate on forums of related topics. — SF

Reference:

Beckham, Jeff. “There’s More to Shot Put Than ‘Beastly Women.’” Wired. August 6, 2012.

Bovine Colostrum Powder

The Effect of Bovine Colostrum Supplementation on Athlete Performance

Blog| ByEli Mizelman

Bovine Colostrum Powder

Introduction

Bovine colostrum (BC) is the first milk secreted by cows after calving. Colostrum is high in protein and contains several bioactive substances including growth and antimicrobial factors (Donavan and Odle 1994; Reiter 1978). The main growth factor in BC is Insulin-like growth factor-1 (IGF-1) (Francis et al. 1988) which stimulates the growth of muscle tissue (Tomas 1991) and is important in maintaining muscle mass and function in adults (Borst 2001). Antimicrobial factors in bovine colostrum include immunoglobulin A (Mach and Pahud 1971) and a variety of other less specific antimicrobial proteins and peptides like lysozyme and lactoferrin (Korhonen 1977; Shing 2009) that are important for immune system function.

Previous studies have shown improvements in body composition (Antonio 2001), power (Buckley 2003; Hofman 2002) and strength (Duff 2014) when BC supplementation was taken during a resistance training program. The mechanism through which BC acts to benefit performance remains unclear.

The first study to investigate the effect of BC supplementation on exercise performance was Mero et al. in 1997. Since then, research has investigated the ability of BC supplementation to improve endurance, and anaerobic performance, and increase lean tissue mass, power, and strength. In addition, researchers are also trying to determine mechanisms for these improvements.

Body Composition and Strength

The first study to examine whether BC supplementation affects body composition and strength was published in 2001 (Antonio et al 2001). In the study, twenty-two trained males and females, were randomly assigned to either a BC (20 g/day) or a whey protein group prior to participating in an 8-week resistance and aerobic program that involved three training sessions per each week.

Body composition was analyzed before and on completion of the study using dual-energy X-ray absorptiometry (DXA). Body mass significantly increased for the whey group, but primarily due to an increase in fat mass, while the BC group showed significant increase in lean body mass only, without any significant change in body weight. Strength was assessed at the same time points using 1RM strength tests. There was no significant difference between groups in strength.

However, another study (Kerksick 2001) found that upper body strength significantly increased after 12 weeks of resistant training and BC supplementation (60 g/day) in comparison to the same resistance training and placebo. Forty-nine trained males and females participated in the study and strength was determined by 1RM bench press and leg press. There was no significant difference for the leg press 1RM. In contrast to this finding, supplementation with the same dose (60 g/day) of BC, during eight weeks of strength and plyometric training, in fifty-one physically active males, was not associated with significant changes in strength (Buckley 2003).

In 2004, the effect of BC supplementation on changes in body composition was examined (Brinkworth 2004), using the same dose (60 g/day). In this study, active males trained the elbow flexors of their non-dominant arm four times a week. 1RM bicep curl, MRI and maximal voluntary isometric contraction of the upper arm were measured at baseline and after 4 and 8 weeks of supplementation. When compared with both their untrained arm and with the placebo group, upper limb circumference and total cross-sectional area were significantly increased in the trained arm of BC subjects. However, there were no significant differences between groups for upper limb muscle cross-sectional area.

Brinkworth et al. attributed the increase in the cross-sectional area following BC supplementation to an increase in skin cross-sectional area, based on a study that found that canine skin cells proliferate with increasing concentrations of BC (Torre 2006).

Duff et al. (2014) assessed forty older adults randomly assigned to 60g/day of BC or whey protein while participating in a three day/week resistance training program for eight weeks. Strength was assessed using 1RM bench press and leg press and body composition by DXA. BC supplemented participants increased their leg strength to a greater extent than whey protein supplemented participants. Bench press strength, on the other hand, as well as lean tissue mass, were not significantly different between groups.

Power

One of the first studies to investigate the effect of BC supplementation on power was conducted in a double-blind manner and a crossover design (Leppäluoto 2000). Ten athletes performed two jump tests on days 11 and 12 of the supplementation. After the overall analysis, it was found that BC supplementation significantly improved jump flight times in comparison to placebo supplementation. However, limited conclusions can be drawn from this study as neither the dose administered nor details of training and diet control was reported by the authors. The investigation is yet to be published in a peer-reviewed journal.

In another double-blind, randomized, placebo-controlled study seventeen female and eighteen male elite field hockey players received either 60 g/day of BC or whey protein for eight weeks (Hofman 2002). Vertical jump performance improved more in the BC group, but the differences were not statistically significant.

Buckley (2003) assessed 51 males who completed eight weeks of resistance and plyometric training while consuming 60 g/day of BC (n= 26) or whey (n =25). BC supplementation significantly improved peak cycle power and vertical jump height, suggesting that BC was beneficial to power activities.

Anaerobic Performance

Anaerobic glycolysis results in the production of H+ and lactate. Buffer capacity is the ability to bind free protons (i.e. to buffer H+), and offset reductions in pH during exercise; hence, given the strong association between acidosis and muscular fatigue, buffer capacity is an important attribute for maintaining anaerobic performance (Parkhouse 1984).

The main buffers of H+ come from skeletal muscle and include protein, inorganic phosphate, and phosphocreatine. Other components in blood including hemoglobin, bicarbonate, and plasma proteins also buffer H+. One study (Brinkworth 2002) examined whether BC supplementation could enhance the buffering of H+, in response to a 9-week training program with 13 elite female rowers who consumed 60 g/day of BC or whey. Two rowing tests were used to assess performance before and on completion of the supplementation period. Buffering capacity was estimated from the differences in the blood lactate levels and the blood pH levels that were taken at the end of each workload during the tests. It was found that buffering capacity was significantly increased after BC supplementation vs. placebo.

Brinkworth (2004) determined the component of blood buffering capacity that was enhanced following BC supplementation. There were no significant differences in hemoglobin levels, plasma bicarbonate levels or plasma buffering capacity in general between BC and placebo groups. The authors concluded that the observed increase in buffering capacity from their previous work (Brinkworth 2002) was the result of enhanced muscle buffering capacity, but they were unable to determine this because no muscle biopsy samples were collected.

Bovine Colostrum supplementation significantly improved peak cycle power and vertical jump height. Share on X

Studies are mixed regarding the effect of BC on anaerobic performance. Hofman (2002) examined the effect of 8 weeks of BC supplementation (60 g/day) on sprint performance in 18 elite male and 17 female hockey players. Repeated sprint running performance (5 × 10 m) significantly improved in the BC supplemented group compared with the placebo group; however, only performance measures were reported in this study, so the mechanism behind the improvement in sprint performance is unclear. In contrast, Shing (2006) found no improvement in a time-to-fatigue test at 110% of ventilatory threshold, between BC and placebo in 29 highly trained male road cyclists. The dosage used in the study was only 10 g/day (for eight weeks); therefore, dosage may have been insufficient. Buckley (2003) used a higher dose of supplementation of 60 g/day of BC vs. whey for eight weeks on 51 males; however they also found that anaerobic work capacity was not different between the groups.

Endurance

Shing (2009) studied 39 male subjects, supplemented with BC (60 g/day) or whey for eight weeks during an aerobic training program that included three 45-minute running sessions per week. The subjects performed two incremental treadmill tests, at baseline and at 4 and 8 weeks of supplementation. No significant changes in running performance were observed after four weeks, but, after eight weeks, subjects in the BC group covered a significantly greater distance and completed more work in the second treadmill test than the whey group. The mechanism for the significant improvement in running performance is unknown and also could not be explained by alterations in respiratory exchange ratio, lactate threshold or IGF-1 levels (Shing 2009).

Another study (Shing 2006) that used a dose of 10 g/day found that BC supplementation (in comparison to whey) improved 40 km time-trial performance at the end of a 5-day high-intensity training period but not during normal training. Although increased muscle glycogen levels during normal training do not improve endurance performance (Hawley 1997), during repeated days of high-intensity exercise, increased muscle glycogen levels may prevent and delay fatigue (Kavouras 2004; McInerney 2005). Due to these findings and the fact that colostrum feeding in calves is associated with enhanced activity of the rate-limiting enzymes for gluconeogenesis – pyruvate carboxylase and phosphoenolpyruvate carboxykinase (Hammon 2003), BC supplementation may improve muscle glycogen resynthesis during periods of intense training.

Coombes (2002) assessed whether there was a dose response of BC on endurance performance. In a double-blind, placebo-controlled trial, 42 cyclists completed a work-based cycle time-trial (2.8 kJ/kg), following a 2-hour endurance ride, both before and after eight weeks of supplementation of 20 or 60 g/day of BC, or whey. Time-trial performance significantly improved in cyclists who were supplemented with BC (both dosages) when compared with the whey. The similar improvements in performance in both of the BC groups suggest that there may be a limit beyond which a higher BC dose does not provide any added performance benefit. The authors hypothesized that the improvement in the endurance was the result of enhanced nutrient uptake from the intestine, mediated by other growth factors found in colostrum. Nevertheless, the effects of BC supplementation on intestinal changes has not been directly measured yet.

Shing (2013) assessed ten highly-trained male road cyclists randomly assigned to a 10 g/day supplementation of BC or whey, for eight weeks that ended in a five-day cycle race. BC supplementation significantly prevented a decrease in testosterone concentration over the race. In addition, parasympathetic indices of heart rate variability (i.e., increased RR intervals) were elevated in the BC group and reduced in the whey group, indicating better cardiovascular functioning with lower heart rate and higher cardiac output in the BC group.

Immune Function

Intense exercise suppresses immunity for several hours (Nieman 2000). Hence, athletes that perform high-intensity training are at a high risk for over-training syndrome (Halson 2002; Halson 2003; Mackinnon 2000) and upper respiratory tract infections (Mackinnon 2000; Fitzgerald 1991). Overtraining syndrome is a neuroendocrine disorder characterized by poor performance in competition, inability to maintain training loads, persistent fatigue, reduced catecholamine excretion, frequent illness, disturbed sleep and alterations in mood state. It is estimated that, at any given time, between 7 and 20% of all athletes may exhibit symptoms of overtraining syndrome. It is believed that excessively large volumes of training without adequate rest and recovery leads to overtraining syndrome (Mackinnon 2000).

The first study to examine the effect of BC supplementation on immune function (Mero 1997) reported that eight days of supplementation with a BC during normal training did not increase salivary IgA concentration. However, another study by the same authors (Mero 2002) showed that athletes ingesting BC for two weeks at a dose of 20 g/day experienced a 33% increase in salivary IgA concentrations. Note that in the second study, the duration of the supplementation was longer and the authors used BC powder that contains more immune factors than the liquid BC used in the first study.

In a study on marathon runners (Crooks 2006), a significant increase in salivary IgA levels was found after 12 weeks of 26 g/day BC supplementation in comparison to placebo; however, this was not associated with a difference in upper respiratory tract infections. On the other hand, two other studies (Shing 2007; Shing 2013) on male cyclists, with 10 g/day supplementation of BC for eight weeks, found no change in salivary IgA levels, natural killer cell cytotoxicity, lymphocyte or neutrophil surface markers. These results might be due to the lower dosage used in this study (10g/ day vs. 20-26g/ day).

Brinkworth (2003) investigated the relationship between BC supplementation and upper respiratory tract infections incidence based on several studies involving resistance training or endurance training interventions in which subjects ingested BC at 60g/ day vs. placebo, over an eight-week period. It was found that the percentage of participants that had upper respiratory tract infections was greater in the placebo group.

IGF-1

Note: “Colostrum is not prohibited by WADA, however, due to the fact that it contains certain quantities of IGF-1 and other growth factors which are prohibited, WADA does not recommend the ingestion of BC.” See WADA Prohibited List.

Despite the fact that BC contains IGF-1, only one group of authors reported significant increases in IGF-1 levels after BC supplementation for 8 and 14 days (Mero 1997; Mero 2002). IGF-1 is usually degraded in the gastrointestinal tract, but it was suggested that some factors in BC may improve the absorption of IGF-1 by preventing its breakdown (Playford 1993).

Normal IGF-1 levels for young adults are 14-48 nmol/L. The increase reported in the studies mentioned above, was approximately 5 nmol/L, while the amount of IGF-1 contained in the BC was 74 μg/day. At this dose, if 65% of IGF-1 was absorbed, the concentration of IGF-1 would only be expected to rise only by approximately 1.05 nmol/L. This suggests that the increase in serum IGF-1 was probably due to an increase in endogenous production (Shing 2009). Other studies with similar doses of BC and longer supplementation periods have reported no significant changes in IGF-1 levels following 4–8 weeks of BC supplementation (Buckley 2003; Coombes 2002).

Our Last Study

Last year, (study is yet to be published) we conducted a study that examined the effect of eight weeks of bovine colostrum supplementation in comparison to soy protein, on rugby players’: strength, power, anaerobic fitness, aerobic fitness, body composition, and IgA, IL-6, IL-1β and CRP levels, during the rugby season. In a double-blind manner and 1:1 allocation ratio, 29 players received 38g/day of protein from BC protein powder or soy protein. Both supplements were flavorless and had the same color, smell, and texture. We also controlled for energy intake and training regime for each athlete.

We found a significant difference in improving power (vertical jump) with the colostrum group increasing more than the soy group. We have also found a significant difference in improving aerobic fitness with the colostrum group increasing predicted aerobic capacity more than the soy group.

Using the magnitude-based inferences statistical approach by Will Hopkins, we have found that:

  1. For vertical jump: The difference between the change in the colostrum group and control group is 3 cm, with 90% confidence interval of plus/minus 1.5 cm. The results of the statistical calculation is that there is a 99% chance that the colostrum group change is different from the control group change.
  2. For VO2max: The difference between the change in the control and colostrum group is as 2 mL/kg/min with 90% confidence interval of plus/minus 2.2. The results of the statistical calculation is that there is an 87% chance that the colostrum group change is different from the control group change.
Bovine Colostrum Poster from the 2015 ACSM Annual Meeting.
The author’s thematic poster from the 2015 ACSM Annual Meeting. The full-resolution poster can be viewed here.


Summary

Due to the small number of studies that have been conducted, we are far from having conclusive evidence for the improvement of performance by BC supplementation. Nevertheless, one can conclude from the mentioned studies that there is a great potential for BC to have a positive effect on athlete performance, especially when it comes to power, strength, and aerobic fitness.

Sport nutritionists should conduct more research on this matter so that 1) we will have sufficient statistical evidence to conclude whether BC does help improve performance, and 2) we would be able to hypothesis the mechanism in which BC acts in favor of improving athlete performance.

Since you’re here…
…we have a small favor to ask. More people are reading SimpliFaster than ever, and each week we bring you compelling content from coaches, sport scientists, and physiotherapists who are devoted to building better athletes. Please take a moment to share the articles on social media, engage the authors with questions and comments below, and link to articles when appropriate if you have a blog or participate on forums of related topics. — SF


References

  1. Antonio J, Sanders MS, Van Gammeren D. (2001). The effects of bovine colostrum supplementation on body composition and exercise performance in active men and women. Nutrition; 17: 243-7.
  2. Brinkworth GD, Buckley JD, Bourdon PC, et al. (2002). Oral bovine colostrum supplementation enhances buffer capacity but not rowing performance in elite female rowers. Int J Sport Nutr Exerc Metab; 12: 349–65
  3. Brinkworth GD, Buckley JD. (2003). Concentrated bovine colostrum protein supplementation reduces the incidence of self-reported symptoms of upper respiratory tract infection in adult males. Eur J Nutr; 42: 228-32.
  4. Brinkworth GD, Buckley JD. (2004). Bovine colostrum supplementation does not affect plasma buffer capacity or hemoglobin content in elite female rowers. Eur J Appl Physiol; 91: 353–6
  5. Buckley JD, Abbott MJ, Brinkworth GD, et al. (2002). Bovine colostrum supplementation during endurance running training improves recovery, but not performance. J Sci Med Sport; 5: 65-79
  6. Buckley JD, Brinkworth GD, Abbott MJ. (2003). Effect of bovine colostrum on anaerobic exercise performance and plasma insulin-like growth factor I. J Sports Sci; 21: 577-88.
  7. Coombes JS, Conacher M, Austen SK, et al. (2002). Dose effects of oral bovine colostrum on physical work capacity in cyclists. Med Sci Sports Exerc; 34: 1184-8.
  8. Craig Twist and Jamie Highton. (2013). Monitoring fatigue and recovery in rugby league players. Int J Sports Physiol Perform. 8, 467-474.
  9. Crooks C, Wall C, Cross M, et al. (2006). The effect of bovine colostrum supplementation on salivary IgA in distance runners. Int J Sport Nutr Exerc Metab; 16: 47-64.
  10. Duff W, Chilibeck PD, Rooke JJ, Kaviami M, Krentz JR, Haines DM. (2014). The effect of bovine colostrum supplementation in older adults during resistance training. IJSNEM; 24: 276 -285
  11. Fitzgerald L. (1991). Overtraining increases the susceptibility to infection. Int J Sports Med; 12 Suppl. 1: S5-8.
  12. Fry RW, Morton AR, Crawford GPM, Keast D. (1992). Cell numbers and in vitro responses of leukocytes and lymphocyte subpopulations following maximal exercise and interval training sessions of different intensities. Eur. J. Appl. Physiol. 64:218–27.
  13. Gabbett TJ. (2007). Science of rugby league football: A review. Journal of Sports Sciences, 23:9, 961-976.
  14. Gleeson M. (2005). Assessing immune function changes in exercise and diet intervention studies. Curr Opin Clin Nutr Metab Care; 8: 511-5.
  15. Halson SL, Bridge MW, Meeusen R, et al. (2002). Time course of performance changes and fatigue markers during intensified training in trained cyclists. J Appl Physiol; 93: 947-56.
  16. Halson SL, Lancaster GI, Jeukendrup AE, et al. (2003) .Immunological responses to overreaching in cyclists. Med Sci Sports Exerc; 35: 854-61.
  17. Hammon HM, Sauter SN, Reist M, et al. (2003).Dexamethasone and colostrum feeding affect hepatic gluconeogenic enzymes differently in neonatal calves. J Anim Sci; 81: 3095-106.
  18. Hawley JA, Palmer GS, Noakes TD. (1997). Effects of 3 days of carbohydrate supplementation on muscle glycogen content and utilization during a 1-h cycling performance. Eur J Appl Physiol Occup Physiol; 75: 407-12.
  19. Hofman Z, Smeets R, Verlaan G, et al. (2002). The effect of bovine colostrum supplementation on exercise performance in elite field hockey players. Int J Sport Nutr Exerc Metab; 12: 461-9.
  20. Kavouras SA, Troup JP, Berning JR. (2004). The influence of low versus high carbohydrate diet on a 45-min strenuous cycling exercise. Int J Sport Nutr Exerc Metab; 14: 62-72.
  21. Kerksick C, Kreider R, Rasmussen C, et al. (2001). Effects of bovine colostrum supplementation on training adaptations II: performance [abstract]. FASEB J; 15: LB315
  22. Leppäluoto J, Rasi S, Martikkala V, et al. (2000). Bovine colostrum supplementation enhances physical performance on maximal exercise tests. 2000 Pre-Olympic Congress Sports Medicine and Physical Education International Congress on Sport Science; 2000 Sep 7–13: Brisbane (QLD).
  23. Mackinnon LT. (2000). Overtraining effects on immunity and performance in athletes. Immunology and Cell Biology; 78, 502–509.
  24. McInerney P, Lessard SJ, Burke LM, et al. (2005). Failure to repeatedly supercompensate muscle glycogen stores in highly trained men. Med Sci Sports Exerc; 37: 404-11.
  25. Mero A, Kahkonen J, Nykanen T, et al. (2002). IGF-I, IgA, and IgG responses to bovine colostrum supplementation during training. J Appl Physiol; 93: 732-9.
  26. Mero A, Miikkulainen H, Riski J, et al. (1997). Effects of bovine colostrum supplementation on serum IGF-I, IgG, hormone, and saliva IgA during training. J Appl Physiol; 83: 1144–51
  27. Mero A, Nykänen T, Rasi S, et al. (2002). IGF-1, IGFBP-3, growth hormone and testosterone in male and female athletes during bovine colostrum supplementation. Med Sci Sports Exerc; 35: s299
  28. Nieman DC. (2002). Is infection risk linked to exercise workload? Med Sci Sports Exerc; 32: S406-11.
  29. Parkhouse, W.S., and D.C. McKenzie. (1984). Possible contribution of skeletal muscle buffers to enhanced anaerobic performance: a brief review. Med. Sci. Sports Exerc. 16:328-338.
  30. Playford RJ, Woodman AC, Clark P, et al. (1993). Effect of luminal growth factor preservation on intestinal growth. Lancet; 341: 843–8
  31. Rhind SG, Shek PN, Shinkai S, Shephard RJ. (1994). Differential expression of interleukin-2 receptor alpha and beta chains in relation to natural killer cell subsets and aerobic fitness. Int. J.Sports Med.15: 911–18.
  32. Shing CM, Hunter DC, Stevenson LM. (2009). Bovine colostrum supplementation and exercise performance: potential mechanisms. Sports Med; 39: 1033–1054.
  33. Shing CM, Jenkins DG, Stevenson L, et al. (2006). The influence of bovine colostrum supplementation on exercise performance in highly-trained cyclists. Br J Sports Med; 40: 797-801.
  34. Shing CM, Peake J, Suzuki K, et al. (2007) Effects of bovine colostrum supplementation on immune variables in highly trained cyclists. J Appl Physiol; 102: 1113-22.
  35. Shing CM, Peake JM, Suzuki K, Jenkins DG, Coombes JS. (2013). A pilot study: bovine colostrum supplementation and hormonal and autonomic responses to competitive cycling. The Journal of Sports Medicine and Physical Fitness; 53(5): 490-501.
  36. Smith LL. (2004). Tissue trauma: the underlying cause of overtraining syndrome? J Strength Cond Res. 18(1):185-93.
  37. Torre C, Jeusette I, Serra M, et al. (2006). Bovine colostrum increases proliferation of canine skin fibroblasts. J Nutr; 136: 2058–60
  38. Urhausen A, Gabriel H, Kindermann W. (1995). Blood hormones as markers of training stress and overtraining. Sports Med. 20: 251–76.
  39. O’Gorman D, Hunter A, McDonnacha C. (2000). Validity of field tests for evaluating endurance capacity in competitive and international-level sports participants. J Strength Cond Res. 14 (1): 62-7.
  40. Duthie G, Pyne D, Hooper S. (2003). Applied physiology and game analysis of rugby union. Sports Med. 33 (13): 973-991.
  41. Woof JM, Ken MA. (2006). The function of immunoglobulin A in immunity. J Pathol. 208: 270–282.
  42. Ingle PV, Patel DM. (2011). C- Reactive protein in various disease condition- an overview. Asian J Pharm Clin Res. 4(1): 9-13.
  43. Pedersen BK, Steensberg A, Fischer C, Keller C, Keller P, Plomgaard P, Wolsk-Petersen E, Febbraio M. (2004). The metabolic role of IL-6 produced during exercise: is IL-6 an exercise factor? Proc Nutr Soc. 63, 263–267.
  44. Ostrowski K, Rohde T, Asp S, Schjerling P, Klarlund Pederse B. (1999). Pro- and anti-inflammatory cytokine balance in strenuous exercise in humans. J Physiol. 515.1, 287—291.

Nordic Hamstring Curl

Hamstrung by Hamstrings?

Blog| ByChristopher Rowe

Nordic Hamstring Curl

Injuries to athletes are a common occurrence in the sporting arena. Elite athletes are expected to perform consistently at the highest level, subjecting their bodies to excessive forces, stresses and impacts, which without adequate preparation can result in frustrating mid-season breakdowns or entire seasons on the sideline.

While injuries in the elite sporting landscape are wide-ranging, it’s unlikely to surprise our readers that the occurrence, frequency and impact of hamstring strain injuries are extremely high across many sports. Hamstring strain injuries are in fact one of the most frequent non-contact injuries that occur in all high-speed running-based sports1. The analysis of seasonal injury reports continue to confirm the high rate of hamstring strain injuries, including:

  • The NFL recording 96 incidences of hamstring strain injuries in the 2014 season, placing it third behind knee and ankle injuries in the NFL2;
  • The NCAA recording 1,142 reported hamstring strain injuries during the 2009/10 to 2013/14 academic years3;
  • The Australian Football League 2013 injury report stated that hamstring strain injuries were the number one injury in the game in terms of both incidence and prevalence (missed games)4;
  • The Australian Football League 2014 injury report indicating that although the overall rate of hamstring injuries at clubs had decreased it was still number one in terms of new injuries per club per season (5.2 hamstring injuries per club per year)5; and

The perplexing thing is, as noted recently in the British Journal of Sports Medicine6:

In spite of all the research and additional understanding of hamstring muscle injuries over the past 20-30 years, we have not reduced the incidence of first-time injuries, and the recurrence rate is still extremely high.

With powerful research providing a much clearer understand of why hamstring strain injuries occur, it begs the question: why does the occurrence of hamstring strain injuries remain so high? Is it that elite sporting organisations are failing to learn, innovative and challenge the status quo? Are organisations taking too much of a reactive approach to injuries and failing to implement preventative measures? Or is something else at play?

What Have We Learned?

One of the biggest learnings in recent years is the effect of eccentric hamstring strength on the occurrence of hamstring strain injuries.

Ground-breaking research on the link came from a group of sports scientists from Australia with one key goal – to discover why hamstring injuries continued to be so prevalent in one of Australia’s most popular sports – Aussie Rules Football. Aussie Rules Football involves two teams of 18 on-field players competing to score points against each other by kicking a ball through their opposing team’s posts at each end of the oval-shaped field. Athletes in the top professional league (the AFL) in Australia play for 80 minutes and commonly run more than 10 miles in each game.

With support from AFL teams desperate to reduce their hamstring strain injury rates, the scientists (primarily Dr Anthony Shield and Dr David Opar) were able to collect comprehensive data by measuring athletes’ eccentric hamstring strength during the age-old Nordic Curl exercise in the 2013 pre-season period. That data was then compared against injury data compiled throughout the 2013 season, with some very interesting results.

Those results indicated that players who finished the pre-season with relatively low eccentric hamstring strength were more likely to have a hamstring strain injury. As a statistical cut point, players with eccentric hamstring strength below 279 newtons (roughly 63lbs of force) were 4.3 times more likely to have a hamstring injury in the upcoming season than their peers above 279 newtons.

The report also demonstrated that, to a large degree, the heightened hamstring injury risk caused by age7 could be largely overcome by increases in eccentric strength, as demonstrated by the below chart:

Probability of Hamstring Injury versus Hamstring Strenght
Figure 1. Opar et al., MSSE. 2015 Apr;47(4):857-65.

Using eccentric hamstring strength as an example, it is clear from the above graph that although unlikely to eradicate the occurrence of hamstring strain injuries in elite sport, it is possible to mitigate the occurrence and severity of injuries by utilising tools that provide objective measurements that can translate into science-backed risk matrices.

How to Measure Hamstring Strength?

The age of objective metrics and big data has well and truly hit the industry, and while not all metrics are created equal, new technologies – and a better understanding of their applications – are providing sporting teams with more and more actionable data every day.

Armed with objective data, preparation staff can identify at-risk athletes and take steps in their program design to address identified risks for specific players (such as putting them in a dedicated pre-hab program to build strength in the affected hamstring(s)). For years, we have heard the adage that programs should be tailored to the athletes’ unique requirements, but quite often this isn’t carried through in practice. The first step, of course, is to get the objective data in the hands of preparation staff.

Typically objective data on eccentric hamstring strength was procured by (at the gold standard) subjecting athletes to a 20-minute test on an isokinetic dynamometer. Testing by this method has few supporters in the elite sporting environment given the exorbitant cost of an isokinetic dynamometer, the time cost required to test players, the highly technical nature of the device and concerns of athlete soreness at the conclusion of testing. At the other end of the scale, handheld dynamometers offered a relatively cheaper alternative, but user error accounts for considerable discrepancy in data collection.

Fortunately, the elite and sub-elite sporting industry is far from immune to the onset of innovation and digital disruption. The significant gap between the isokinetic and handheld dynamometers has been filled by the NordBord – the next generation of diagnostic technology focused on arming strength and conditioning teams with a tool that can quickly, accurately and cost-effectively provide metrics that actually matter.

The NordBord

It was from Dr Anthony Shield and Dr David Opar’s study into the AFL that identified the need for the NordBord. Clubs wouldn’t allow their players to be consumed for extended periods on an isokinetic dynamometer and data from handheld devices would be too inconsistent. Accordingly, they developed their own field-testing device.

The NordBord embodies an innovative design with simplistic elegance and has been designed with familiarity, practicality and ease of use at mind. The device is relatively simple to use – players kneel on the NordBord and perform repetitions of the Nordic Curl exercise while the NordBord calculates (amongst other things) the peak eccentric hamstring strength of each leg independently.

Nordbord Hamstring Evaluation
Figure 2. NordBord Hamstring Evaluation

In less than 2 minutes on the device (once familiarised), preparation staff will have an indication of the athlete’s eccentric hamstring strength and between-leg symmetry. Then they can determine, by reference to the risk matrixes generated by Dr. Shield and Dr. Opar’s research, which athletes fall into the at-risk category. From there, they can customise pre-season routines to improve these figures into a safer ranges. The ability to benchmark and then retest ensures that the athlete only moves onto a full load when they are ready.

The NordBord empowers strength and condition professionals with real-time, quantifiable and objective data.

It is important to note that although the NordBord provides a specific figure that can be benchmarked, each athlete’s age and hamstring injury history must also be taken into account. But while these risk factors are non-modifiable in themselves, the effect these variables have on the propensity for injury can be reduced with an increase in eccentric hamstring strength (as demonstrated in the graph above, athletes in their late twenties can reduce their injury probability to levels comparable with their 18-year-old counterparts).

Metrics and data will drive elite athlete management and elite sporting clubs that fail to innovate will fall behind. Quick and efficient access to real-time metrics is why the NordBord should form a part of any elite sporting organisation’s screening and monitoring routine.

Tom Myslinski, Head Strength and Conditioning Coach at Jacksonville Jaguars, said the NordBord has given him “the ability to identify and address those at-risk athletes” on their roster.

“Hamstring strains can keep key players out of action for weeks so being able to determine which players are at risk, and do the correct work to avoid future injury in those players, is invaluable for us,” he said.

The NordBord is not limited to eccentric hamstring strength, and can also measure an athlete’s isometric strength. While research may less support isometric strength as a predictor or injury, it is undeniably a useful and low-impact alternative. This makes it ideal for testing players who are particularly weak or fragile, such as those returning from injury. Long have handheld dynamometers been used to measure isometric strength, with extremely variable results due to operator error. The NordBord instead removes the extra human factor and provides a stable, reliable platform for measuring isometric strength.

Incremental improvements are often overlooked during the preseason, but even small improvements can have major impacts towards the end of a season. The NordBord is equipped to detect these subtle changes, allowing them to be actioned upon when players are most malleable.

“… to determine which players are at risk, and do the correct work to avoid future injury in those players, is invaluable for us.” — Tom Myslinski, Head Strength and Conditioning Coach, Jacksonville Jaguars

Ultimately, it is in the interest of high performance and conditioning staff to take these proactive steps. Even a single injury prevented can save days or weeks where their attention is pulled away from their primary function: helping athletes win.

Proactive injury management can be easy, and with the proliferation of technology in the athlete management sector and athlete data amalgamators such as Kinduct, CoachMePlus and Kitman Labs, the NordBord becomes a high-value string that can easily be added to any team’s bow. Sporting organisations who are prepared to be innovative and dynamic have the opportunity to improve incrementally and measurably over time. Metrics and big data are here to stay, and metrics that matter can go a long way to reducing the occurrence of hamstring injuries in elite athletes.

The Far-reaching Implications of Hamstring Injuries

The implications of hamstring strains are far reaching, and go beyond lost game time for injured athletes. Even the psychological effects on injured athletes cannot be overlooked, especially when recurrent injuries can often plague athletes for their entire professional careers. Even once a player has completed the often lengthy rehabilitation process, confidence to perform in a high-pressure game environment is often reduced, and even a small reduction in performance or decision-making ability can have a massive impact on the outcome of a match. Player welfare is (or at least should be) the primary concern for all elite sporting organisations, so ensuring the implementation of the latest technology, data and injury prevention methods is crucial.

If we continue to explore the fallout from injury occurrences, support staff will echo the grievances of players, with huge amounts of time and effort required to successfully rehabilitate a player for the rigours of elite sport. And with these significant investments of time, the staff’s ability to manage the rest of the team can be adversely affected. Culturally, elite athletes are often known for their egos, but also for their expectations, and organizations with high rates of injury will often find it difficult to attract and retain players, as well as support staff. And with enough injury naturally comes declines in performance. And without drawing too long a bow, eventually these cultural and performance slips can have a negative impact on the financial viability of an organisation – as can salaries paid to an injured player who sits on the bench week after week, willing but unable to contribute.

If you could accurately and cost effectively test an athlete’s hamstring strength in under two minutes, would you? Well, you should certainly consider it.

Since you’re here…
…we have a small favor to ask. More people are reading SimpliFaster than ever, and each week we bring you compelling content from coaches, sport scientists, and physiotherapists who are devoted to building better athletes. Please take a moment to share the articles on social media, engage the authors with questions and comments below, and link to articles when appropriate if you have a blog or participate on forums of related topics. — SF

Reference

  1. Opar, D.A., J. Drezner, A. Shield, M. Williams, D. Webner, B. Sennett, R. Kapur, M. Cohen, J. Ulager, and A. Cafengiu, Acute Hamstring Strain Injury in Track‐and‐Field Athletes: A 3‐Year Observational Study at the Penn Relay Carnival. Scandinavian Journal of Medicine & Science in Sports, 2014. 24(4): p. e254-e259; Ekstrand, J., M. Hägglund, and M. Waldén, Injury Incidence and Injury Patterns in Professional Football: The Uefa Injury Study. British Journal of Sports Medicine, 2011. 45(7): p. 553-558; Elliott, M.C., B. Zarins, J.W. Powell, and C.D. Kenyon, Hamstring Muscle Strains in Professional Football Players a 10-Year Review. The American Journal of Sports Medicine, 2011. 39(4): p. 843-850.
  2. NFL Player Injuries
  3. Epidemiology of Hamstring Strains in 25 NCAA Sports in the 2009-2010 to 2013-2014 Academic Years, Sara L. Dalton, Zachery Y. Kerr and Thomas P. Dompier. Am J Sports Med
  4. Australian Football League Injury Report 2013
  5. 2014 AFL Injury Report
  6. Hamstring Injuries: Prevention and Treatment
  7. Arnason A, Sigurdsson SB, Gudmundsson A, et al. Risk factors for injuries in football. Am J Sports Med. 2004; 32 (1 Suppl.) 5S-16S.
Heart Rate Variability Chart

Interpreting HRV Trends in Athletes: High Isn’t Always Good and Low Isn’t Always Bad

Blog| ByAndrew Flatt

Heart Rate Variability Chart

Heart rate variability (HRV) monitoring has become increasingly popular in both competitive and recreational sports and training environments due to the development of smartphone apps and other affordable field tools. Though the concept of HRV is relatively simple, its interpretation can be quite complex. As a result, considerable confusion surrounds HRV data interpretation. I believe much of this confusion can be attributed to the overly simplistic guidelines that have been promoted for the casual-end, non-expert user.

In the context of monitoring fatigue or training status in athletes, a common belief is that high HRV is good and low HRV is bad. Or, in terms of observing the overall trend, increasing HRV trends are good, indicative of positive adaptation or increases in fitness. Decreasing trends are bad, indicative of fatigue accumulation or “overtraining” and performance decrements. In this article I address the common notions of both acute and longitudinal trend interpretation, and discuss why and when these interpretations may or may not be appropriate. We will briefly explore where these common interpretations or “rules” have come from within the literature, and then discuss some exceptions to these rules.

This article will mostly focus on the log-transformed root mean square of successive R-R interval differences (lnRMSSD), which is the vagal-HRV index used in popular smartphone apps. For several important reasons lnRMSSD appears to be the preferred HRV parameter for athlete monitoring.

  1. It can be easily calculated without specialized software
  2. It is reflective of cardiac-parasympathetic modulation
  3. It demonstrates greater reliability compared to spectral measures (e.g., HF power)
  4. It can be assessed in only 60 seconds
  5. It is less influenced by breathing rate, making it more suitable for field usage

Why a high HRV score is thought to be good and a low HRV score is thought to be bad

HRV-guided endurance training has been shown to be superior to pre-planned endurance training in healthy1,2 and clinical subjects3 for inducing improvements in aerobic fitness variables. Essentially, training with higher intensity/volume when HRV is at or above baseline appears to elicit greater training adaptations. This results in high (or within baseline) HRV being synonymous with “readiness.”

Acute decreases in HRV have been reported to occur following intense endurance training,4 resistance training,5 and competition.6 Therefore, low HRV is commonly thought to provide a reflection of acute fatigue from training or competing.
Where these interpretations can be misleading

Decreased HRV has been observed in a variety of athletes preceding competition as a result of heightened levels of excitement or anxiety.6,7 Further, lower vagal-HRV has been reported to be favorable in sprinters on the day of a race.8

HRV Data Set
Figure 1. Data I collected from a collegiate sprint swimmer leading up to a conference championship shows a marked acute decrease on the first day he competed, when he set a personal record. Wellness scores did not indicate fatigue, and he tapered his training load in the preceding weeks. The pronounced decrease in HRV on the day of competition can likely be attributed to anxiety/excitement.

A low HRV score as a result of fatigue also does not necessarily forecast impending reductions in performance. A small case study of 3 high-level tennis players showed that performance markers (VO2 max, single-legged counter-movement jump, and drop jump index) improved following a 30-day overreaching period. The athletes expressed their improved performance at the end of the training program despite showing decreases in RMSSD (between -13 and -49%).9

This was also evident in a recent study of ours with a collegiate female soccer team10 that assessed changes in HRV (weekly mean and weekly coefficient of variation [CV, a reflection of the day-to-day fluctuation in HRV scores]) and perceived wellness in response to weeks of varying training load. During a high-load training week, wellness scores and the HRV weekly mean were lower, and the HRV coefficient of variation was higher. All these changes indicate a higher presence of fatigue.

Having devised and implemented the training program, I interacted with and observed the athletes in terms of behavior, body language, etc. They were definitely experiencing fatigue. However, they all completed workouts of higher volume and intensity in both the weight room and during conditioning sessions. This indicates that they were still able to demonstrate their strength and fitness qualities despite fatigue.

Therefore, in the presence of fatigue reflected by HRV, performance may or may not suffer. HRV will typically show changes before performance decrements and thus may serve as an early warning sign of fatigue accumulation. But do not expect your or your athletes’ performance to be poor based on a low HRV score, as this certainly is not always the case.

Why an increasing trend is thought to always be a good thing

Increases in aerobic fitness have often been associated with increases in cardiac-parasympathetic activity in a variety of individual and team sport athletes. A common observation is that those who improve fitness also improve HRV, while those who do not improve fitness show either no change or even decreases. For example, a study by Buchheit and colleagues11 demonstrated that subjects who improved their 10K run time following a training program also showed a progressive increase in their HRV, while non-responders showed no meaningful changes. Large correlations between changes in HRV and maximum aerobic speed and 10K time trials were found.

A recent study of ours currently in press12 evaluated how early changes in HRV relate to eventual changes in intermittent running capacity in team-sport athletes. We found that athletes who demonstrated an increase in their HRV weekly mean and/or a decrease in their weekly HRV CV at the halfway point of a 5-week training program improved performance to a greater extent than those showing the opposite HRV changes. In light of studies like these, interpretation of an increasing HRV trend as being a positive response to training has become popular.

Progressive HRV Trend
Figure 2. A progressive increase in this athlete’s HRV trend can be interpreted as a positive response due to concurrent progressive improvements in perceived wellness (sleep quality, soreness, mood, fatigue), improved performance, and a steady training load.

Why interpreting an increasing HRV trend as always a good thing can be misleading

Unfortunately, an increasing HRV trend throughout training is not always a good thing and thus should not always be interpreted as such. In fact, several studies have reported increasing HRV trends in overtrained athletes predominately involved in endurance sports. For example, Le Meurr et al.13 showed decreased maximal incremental exercise performance and increased weekly HRV mean values in elite endurance athletes following a 3-week overload period, compared to a control group who saw no changes. Following a taper, performance supercompensation was observed along with a return of HRV toward baseline.

Why a decreasing trend is always thought to be a bad thing

The most common response to overload training is a progressive decrease in HRV. This is your typical alarm response to a stressor, where the sympathetic arm of the autonomic nervous system is activated. In this situation, resting HR is elevated and HRV decreases. With insufficient recovery time, HRV may not fully recover to baseline before the next training stimulus and thus will result in a downward trend when this cycle is perpetuated. An intense day of training can result in suppressed HRV for up to 72 hours post-exercise.14 With the higher training frequencies and training volumes often associated with overload periods, it makes sense that HRV will show a decreasing trend. Typically, HRV will respond first with a decreasing trend and performance decrements will follow if the overload period is sustained.

A study by Pichot et al.15 provides a good example of a decreasing HRV trend in response to overload training. They showed that middle distance runners saw a progressive downward HRV trend (up to -43%) during a 3-week overload period. In week 4, training loads were reduced and HRV recovered and exceeded baseline values.

HRV Swim Data Set
Figure 3. A data set I collected from a collegiate sprint swimmer. A progressive decrease in this athlete’s HRV trend is observed during an anaerobic overload phase with a progressive increase during the taper. The decrease in the trend was associated with fatigue, assessed via daily wellness questionnaires which also improved throughout the taper. We can confidently conclude that the decrease in this athlete’s trend was due to accumulated training stress.

Why and when a decreasing HRV trend does not necessarily reflect fatigue

Aerobic exercise tends to have a stimulatory effect on parasympathetic modulation, which can be observed in the HRV score the following morning. This is one reason why moderate aerobic exercise is often used as an effective recovery modality. However, exercise intensity is an important mediator of cardiac-parasympathetic responses to the training session. A recent study by Plews and colleagues4 featuring Olympic-level rowers found that training phases of high intensity (e.g., above the second lactate threshold) suppressed HRV, while phases of lower intensities (e.g., below the lactate threshold) increased HRV.

This is important to understand when interpreting an HRV trend over time. Phases involving moderate intensity aerobic work are likely to cause an increasing HRV trend, while phases of high intensity conditioning with minimal low intensity work will cause a decrease. The absence of low intensity aerobic work results in an absence of the stimulatory effects that this training type has on parasympathetic activity.

Further, the high intensity training will be more disruptive to homeostasis as a result of greater metabolic demand. In this situation, a progressive decrease in HRV can occur despite no meaningful increase in levels of fatigue. Therefore, you shouldn’t be alarmed if you observe a decrease in your HRV trend when limiting moderate aerobic work.

Collegiate Runner HRV Data
Figure 4. Weekly mean HRV trend of a collegiate runner16 showing a progressive increase in his HRV trend up to week 6, at which point the volume of aerobic work is reduced and the trend decreases. This decrease was not associated with fatigue or performance decrements, but simply due to changes in training content.

HRV Fluctuations
Figure 5. In this trend, daily HRV oscillates up and down in response to resistance training. At the middle of the trend, HRV remains elevated with little fluctuation and then eventually returns to daily oscillations. The middle of the trend represents a two-week period where daily aerobic work was incorporated into training and is likely responsible for attenuating typical daily fluctuations. Simply removing the aerobic training content resulted in a decrease in the HRV trend but did not include an increase in fatigue.

Conclusion

Monitoring HRV cannot be done effectively when following a black-and-white approach to trend interpretation (i.e., high = good, low = bad). Further, relying on an HRV score alone to assess training status will prove to be very difficult. HRV changes must always be taken into context, by keeping track of training load, training type/content, lifestyle factors (sleep quality, nutrition, stress, etc), and performance. These variables are complementary and provide a more complete picture of training status.

Users should therefore observe the HRV trend -> analyze in the context of sport and lifestyle demands (i.e., training load and psychometrics) -> determine the meaning of the change -> adjust training or lifestyle factors if necessary according to the goal of the current phase.

Since you’re here…
…we have a small favor to ask. More people are reading SimpliFaster than ever, and each week we bring you compelling content from coaches, sport scientists, and physiotherapists who are devoted to building better athletes. Please take a moment to share the articles on social media, engage the authors with questions and comments below, and link to articles when appropriate if you have a blog or participate on forums of related topics. — SF

References:

  1. Kiviniemi, A.M., Hautala, A.J., Kinnunen, H., and Tulppo, M.P. (2007). “Endurance training guided individually by daily heart rate variability measurements.” European Journal of Applied Physiology, 101(6), 743-751.
  2. Botek, M., McKune, A.J., Krejci, J., Stejskal, P., and Gába, A. (2013). “Change in Performance in Response to Training Load Adjustment Based on Autonomic Activity.” International Journal of Sports Medicine, 35(6), 482-488.
  3. Behrens, K., Hottenrott, K., Weippert, M., Montanus, H., Kreuzfeld, S., Rieger, A., and Stoll, R. (2014). “Individualization of exercise load control for inpatient cardiac rehabilitation: Development and evaluation of a HRV-based intervention program for patients with ischemic heart failure.” Herz.
  4. Plews, D.J., Laursen, P.B., Kilding, A.E., and Buchheit, M. (2014). “Heart Rate Variability and Training Intensity Distribution in Elite Rowers.” International Journal of Sports Physiology and Performance.
  5. Chen, J.L., Yeh, D.P., Lee, J.P., Chen, C.Y., Huang, C.Y., Lee, S.D., and Kuo, C.H. (2011). “Parasympathetic nervous activity mirrors recovery status in weightlifting performance after training.” The Journal of Strength & Conditioning Research, 25(6), 1546-1552.
  6. Edmonds, R.C., Sinclair, W.H., and Leicht, A.S. (2012). “The effect of weekly training and a game on heart rate variability in elite youth Rugby League players.”
  7. Morales, J., Garcia, V., García-Massó, X., Salvá, P., Escobar, R., and Busca, B. (2013). “The use of heart rate variability in assessing precompetitive stress in high-standard judo athletes.” Int J Sports Med, 34, 144-151.
  8. Merati, G., Maggioni, M.A., Invernizzi, P.L., Ciapparelli, C., Agnello, L., Veicsteinas, A., and Castiglioni, P. (2015). “Autonomic modulations of heart rate variability and performances in short-distance elite swimmers. European Journal of Applied Physiology, 115(4), 825-835.
  9. Thiel, C., Vogt, L., Bürklein, M., Rosenhagen, A., Hübscher, M., and Banzer, W. (2011). “Functional overreaching during preparation training of elite tennis professionals.” Journal of Human Knetics, 28, 79-89.
  10. Flatt, A.A. and Esco, M.R. “Smartphone-derived heart rate variability and training load in a female soccer team.” International Journal of Sports Physiology and Performance. In press.
  11. Buchheit, M., Chivot, A., Parouty, J., Mercier, D., Al-Haddad, H., Laursen, P.B., and Ahmaidi, S. (2010). “Monitoring endurance running performance using cardiac parasympathetic function.” European Journal of Applied Physiology, 108(6), 1153-1167.
  12. Flatt, A.A., and Esco, M.R. “Evaluating individual training adaptation with smartphone derived heart rate variability in a collegiate female soccer team.” J Str Cond Res. In Press.
  13. Le Meur, Y., Pichon, A., Schaal, K., Schmitt, L., Louis, J., Gueneron, J. and Hausswirth, C. (2013). “Evidence of parasympathetic hyperactivity in functionally overreached athletes.” Med Sci Sports Exerc, 45(11), 2061-71.
  14. Stanley, J., Peake, J.M., and Buchheit, M. (2013). “Cardiac parasympathetic reactivation following exercise: implications for training prescription.” Sports Medicine, 43(12), 1259-1277.
  15. Pichot, V., Roche, F., Gaspoz, J. M., Enjolras, F., Antoniadis, A., Minini, P., and Barthelemy, J.C. (2000). “Relation between heart rate variability and training load in middle-distance runners. Medicine and Science in Sports and Exercise. 32(10), 1729-1736.
  16. Flatt, A.A. and Esco, M.R. (2014). “Endurance performance relates to resting heart rate and its variability: A case study of a collegiate male cross-country athlete.” J Austral Strength Cond. 22:48-52, 2014.
Athlete Dives Across Finish Line at Cross Country Meet

A Comparison of Three Competing Cross Country Programs

Blog| ByJohn Brumund-Smith

Athlete Dives Across Finish Line at Cross Country Meet

By John Brumund-Smith

Practice is fascinating to me. Coaches are fascinating to me. While I love going to other coach’s practices, unfortunately, I simply don’t have much time to because I’m at my own practices. However, since I do not coach in the fall, I recently had the time and opportunity to visit some successful Cross Country programs in Lake County, Illinois. This article will compare and contrast their programs and attempt to find out what makes them so successful. I focused primarily on the boys’ programs, since that is where most of my experience in coaching lays.

If you are the type of person who just loves spoilers, scroll down to the bottom of the article to find out how the three teams did at their Sectional Championships. The end of this article will be, in part, a preview of the athletes at the IHSA State Cross Country Championships.

Here is a quick breakdown of the three programs I had the pleasure of following (rankings are from the weeks I visited them):

Grayslake Central High School

  • Head Coach: James Centella
  • Boys’ and Girls’ programs are combined
  • Defending Illinois Class AA Boys State Cross Country Champions
  • Boys are ranked 4th in Class AA
  • Girls are ranked 15th in Class AA

Lakes Community High School

  • Boys’ Head Coach: Travis Shepherd
  • Girls’ Head Coach: Keith West
  • Boys are ranked 13th in Class AA
  • Girls are ranked 6th in Class AA

Lake Zurich High School

  • Boys’ Head Coach: JB Hanson
  • Boys qualified for State for 8 straight years
  • Boys are ranked 4th in Class AAA

The first thing I noticed that all three of these programs had in common was how overwhelmingly positive all of the coaches are with their athletes. Through three different schools, four different head coaches and three different assistant coaches, I never heard a negative word. All forms of communication were positive or corrective in nature. Part of this, perhaps, may have been due to the power of observation, but I do not think so. I have gotten to know all four of those head coaches a bit from coaching against them in the spring. None of them are among the screamers and ragers that are somehow still prevalent in certain high school sports.

The first thing I noticed that all three of these programs had in common was how overwhelmingly positive all of the coaches are with their athletes.

Obviously, the programs shared a lot in common, but they also had their own unique qualities. First, let me go over what happened at each practice before I delve into more specific comparisons.

Grayslake Central High School

The Rams are the defending boys Illinois Class AA State Cross Country Champions, which they won in a landslide, scoring just 54 points. They placed sixth in 2014, 17th in 2013, and 19th in 2011. They return Jack Aho, the defending state champion, along with his brother Matt, who placed seventh at the state meet. The GLC girls placed ninth last year at State.

I met Coach James Centella in the basement of the school just before 5:45 a.m. on a pitch-black Friday morning. Although held during a time when most rational people would much rather still be in their beds, the weather was ideal for distance running: 60 degrees, still, and very fresh after a light rain. The one hindrance, other than the early hour, was the darkness. The rare “black moon” made visibility incredibly difficult. If the team meeting and warmups lasted a little longer than usual, that was OK.

“Announcements, bring it in!” Centella said jovially, as his team milled about in the hallway. Some general announcements followed, about what time the bus left in the morning (6:50 a.m.) and what sort of jobs different athletes had at the meet (getting the tarp, getting the tent, etc.), and information about ordering the conference meet shirt. Coach Centella did not have to hype his team up before a hard day of practice or really speak much at all about what would take place that day. Routine would dictate the practice. As expected, Centella said they would be doing their usual pre-meet day, which meant a 30-35 minute run on their usual path. The exact prescription for each runner was nicely laid out on a printed spreadsheet posted on the team bulletin board.

After the short meeting, the athletes went right outside to the track for a series of stationary exercises like lunges, leg swings, and knee grabs. The activities were social, with the athletes in clumps talking to each other as they went through the motions. Occasionally, some athletes would need some gentle urging to complete the exercises. At the conclusion of the exercises, enough light had peeked through to allow the team to start their run.

Thankfully, Grayslake Central High School is located just across the street from Central Park and the grounds of Grayslake Middle School. The athletes only have to cross one road (very low traffic at 6:00 in the morning, of course), and they can complete the rest of their run on the various trails in the park. There is no set course. Athletes know how many minutes they have to complete, and are able to come up with their own route. Only occasionally do the coaches have to tell an athlete to either speed up, slow down, or get moving entirely. For safety, they are encouraged to run in a group.

During the run, Coach Centella and his assistants trotted around to make sure everybody was on task. For the most part, everything ran very smoothly. Between the boys’ and girls’ teams, there were almost 100 athletes trotting around the park. Because they had different running assignments and started at slightly different times, they trickled back to the track at different times.

Once back at the track, another routine started. There were strides, hurdle drills, and mini-band exercises to be completed. The coaching staff roamed around to supervise, but only occasionally needed to correct or motivate an athlete. “Don’t bend at the waist,” Coach Centella said to an athlete doing a mini-band exercise. “Squat.” While he was helping out some younger athletes with the mini-bands, his studs were running their 100-yard strides on the turf football field. When the athletes were done with their routines, they were free to go, but not before having some watermelon brought by one of the team moms.

As is the case at most practices, the last athletes to leave were the best ones. Ask even a layperson to pick out the best distance runners of the group, and they would almost certainly point at Jack and Matt Aho. Tall, long, and lean, the Aho brothers barely look like they break a sweat, regardless of the pace.

Jack is the defending Illinois Class AA State Cross Country Champion, and holds track bests of 4:08.79 in the mile and 9:00.7 in the 3200-meter run. Matt, who finished seventh at the 2016 State CC meet, has track bests of 4:27.91 in the 1600-meter run and 9:25.05 in the 3200m. The latter time was just 0.33 seconds away from qualifying him for the 2016 Illinois Class AAA State Track & Field Championships, where his brother Jack finished as the runner-up in the 3200 meters. There are different enrollment cutoffs for cross country and track in Illinois, which is the reason that Grayslake Central is in the largest division for track, but the middle division for cross country.

Grayslake Central did not just win the state championship in 2016. They dominated, scoring just 54 points, while runner-up Mahomet-Seymour scored 121. In addition to the Aho brothers, Eli Minsky, currently a junior on the team, earned All-State honors with a 25th place finish. The rest of the team graduated in 2016: John Girmscheid (23rd), Jack Battaglia (26th), Danny Vincent (51st), and Alden Aaberg (108th).

The current crop of Rams has held pretty steady at a fourth-place ranking in the AA, while the girls, who placed ninth at State in 2015, were ranked 10th at the time of my visit. The girls return Megan Girmscheid (39th), Elizabeth Aho (80th), Greta Ruhlman (124th), and Riley Acthemeier (146th) from last year’s ninth-place team.

Going into the championship season, Coach Centella is hoping both of his squads can advance to the State Championships, which has become an expectation recently for the Rams.

Cross Country Competitors Matt and Jack Aho
Image 1: Brothers Matt and Jack Aho definitely pass the eye test. They look to once again lead the defending State Champions from Grayslake Central onto the team podium in 2016.

Lakes Community High School

In their 12-year history, the Eagles have only had one team qualify for the IHSA State Cross Country Championships. Their girls’ team qualified for the AA meet in 2008, the second year Illinois moved to three classes. The boys have never qualified as a team, but have had two individuals qualify in their history: Blake Franson (2008) and Ryan Prais (2009, 2010, 2012).

A little under nine hours after leaving the Grayslake Central practice, I got a chance to see how their new rivals at Lakes Community High School practiced. The rivalry between the two schools stems from the fact that they are both charter members of Illinois’ newest conference, the Northern Lake County Conference.

While the Lakes boys’ and girls’ teams technically run two separate programs, they are more apart than different. Because they have no assistant coaches, Travis Shepherd (head boys’) and Keith West (head girls’) basically act as each other’s assistants, in addition to running their own programs. Lakes is the only team in the new conference with two head cross country coaches. All the other teams have one head coach who oversees both programs. So, in a sense, Lakes is fortunate, though their situation is certainly not ideal.

The team meets in a lower hallway in the athletic wing of the school. They started with a quick meeting, then headed outside to what had continued to be a great day for running: 64 degrees and slightly cloudy. Both programs started out with an easy jog, followed by dynamic stretching led by their respective coaches.

Like the practice at Grayslake Central, today’s practice was simply a pre-meet day for the athletes at Lakes. Some of the varsity members were not even at practice, having been given the option to run on their own. The remaining members took off on their 2.5-mile “pre-meet” loop, which started on the gravel trail winding around the side of the school and took them across Grass Lake Road to a series of athletic fields. Shepherd and West trotted around with them, monitoring the athletes who needed to be monitored and shouting out general encouragement and jokes.

Lake Eagles Cross Country Team
Image 2: Senior Jeremy Wallace (blue sweatshirt) leads the Lakes Eagles on their pre-meet jog around the campus athletic fields. The boys’ and girls’ teams sometimes jog together, but separate into their groups for practice after the run.

As the athletes got back from their easy jog, they again separated into their groups: boys and girls. Lakes is blessed with a slight hill just outside their meeting place. The boys performed three strides and then a series of “wicket drills” up the hill. Coach Shepherd used verbal cues to help correct their form as they ran the wicket drills over the mini-hurdles, crediting the cues he learned from current York coach, Charlie Kern.

Coach West held a different philosophy for the girls, having them sprint down the hill while focusing on lengthening their stride and feeling fast. “Happy runners mean fast runners,” he said, smiling as the girls sprinted down the slight decline.

The Lakes program in general is an interesting blend of philosophies and compromises. Clearly, the closeness of the boys’ and girls’ programs has its advantages, but acting as each other’s assistant coaches can come with downsides. For example, the day after my visit, the varsity athletes competed at the Peoria Invitational (on the state meet course), while the junior varsity competed at Antioch’s Harland Invitational. This meant that Coach West would not be able to accompany his varsity girls to the Peoria Invitational, where they finished a best-ever second place. Instead, he went with both JV teams to Antioch. Since Coach West has kids and Coach Shepherd does not, it made sense for Shepherd to take the three-hour trip to Peoria while West took the 15-minute trip to Antioch’s course.

The two coaches are under no obligation to mimic each other as far as workouts or philosophies go, but an almost-inevitable shift to the center has been occurring in the three years they have coexisted as head coaches. Being exposed to another coach’s training methods and styles can help any coach realize what they are doing well and what they can do better. (You will note that this is part of the point of this article.)

A coach exposed to another coach’s training methods and styles realizes what they can do better. Share on X

Both coaches are convinced they have the best team in the school’s short history. The girls are hoping to qualify as a team for the first time since 2008, Coach West’s first year as head coach. Both programs also have potentially the best athlete in the school’s history. Senior Jeremy Wallace ran a school record 15:09.8 at the Peoria Invitational, while freshman Olivia Schmitt has come awfully close to the girls’ record.

Lake Zurich High School

Few teams in recent Illinois history have had the sustained success of the Lake Zurich Bears. The boys have not lost a dual meet since 2007, notching 66 wins in a row. They have also qualified for the IHSA State Championships eight years in a row, topping out with a runner-up finish in 2010. Last year they placed fifth, and return their top four athletes in 2016.

Practice at Lake Zurich High School starts in a cramped classroom with only 15 desks for the almost 50-strong team. If not for the throngs of short-short wearing kids seated all over the floor, you might confuse it with an actual class. Every athlete holds a binder and a pencil. Their coach, JB Hanson, sits on the desk in front and whistles to get their attention. By now, the athletes know the drill. They open up their binders, ready their pencils, and pay attention.

At least one day a year, each senior has the opportunity to present to the team. The binders are not only logbooks for the daily workouts, but a place where the athletes take notes on the presentations given by the seniors and coaches at the start of practice.

Today was senior Andrew Rifkin’s day to present. He gave four quotes and his interpretation of the quotes, and related each of the quotes to his own experience at Lake Zurich High School. Here are his quotes:

“Failure is just a fork in the road. You determine which fork to take.”

“Whether you think you can or you think you can’t, you’re probably right.” – Henry Ford

“Never let your head hang down, never give up and sit down in grief. Find another way. And don’t pray when it rains if you don’t pray when the sun shines.” – Satchel Paige

“The pain of regret is far worse than the pain of discipline.”

Lake Zurich Senior Andres Rifkin
Image 3: Lake Zurich senior Andrew Rifkin delivers his quotes to the rest of the team. Each senior has at least one day of their own to present to the team.

Andrew’s teammates took notes as he spoke. Getting almost 50 high school boys crammed up against each other in a crowded space to be quiet and listen is a small miracle. Andrew’s explanations of what the quotes meant to him were the best part of his presentation. When relating the Henry Ford quote, Andrew shared a personal story about how he got cut from the golf team his freshman year. He then went out for cross country, and turned the failure of getting cut from golf into the success of being on the cross country team.

Andrew ended the presentation with two open-ended challenges:

“What kind of legacy do you want to leave on the team or on the school in general?”

“How satisfied would you be if your high school career ended today?”

Speeches like that from a senior makes the coach’s job easy. JB Hanson added a couple of his own thoughts to Andrew’s comments, saying, “I would be in the category of not being satisfied with my high school career.” He talked about how he did not work all that hard in high school, but that he was unaware that he was not working hard.

He then went over personal best times from yesterday’s timed mile, noting that 22 athletes recorded their all-time bests. After he read each name, the team gave two claps in unison. Hanson made a special note of a few of them, mentioning one athlete who had a 22-second PR, and another who was only the third freshman in his coaching career to break 5:00 in the mile. Hanson then covered general information (practice time on Friday, meet stuff for Saturday, plans for the rest of the week) before sending the athletes out for the day’s activities.

The practice started outside, as it does every day at Lake Zurich, with a one-mile warmup on the track. That was followed by the captains leading some simple drills like toe walks, ankle walks, lunges, leg swings, etc. The track was busy with activity. In addition to the boys’ and girls’ cross country programs, the football team was practicing on the turf, and the soccer team was preparing for their game later in the afternoon. The boys dodged Gatorade jugs as they trotted their way around the track. On a 54-degree, windy, drizzly, overcast day, hundreds of athletes remained focused on the task at hand. Such is sports.

Lake Zurich Cross Country Warm Up
Image 4: A busy day outside at Lake Zurich High School. The boys’ cross country team finishes up their one-mile warm-up jog while the football team practices on the turf. The soccer team is setting up for their game as well.

Stud athletes are like racehorses; they will go too hard if there’s no jockey up there pulling on the reins.

After the warmup, all of the members of the team headed off on an easy run, having looked up their mileage and paces on the wall of the team room earlier in practice. Almost all the athletes were prescribed between 5 and 8 miles. Tomorrow, the athletes will run just as far, but as part of a Fartlek workout. Knowing that, there was good motivation to not run too fast today, which is a bigger problem for top programs than running too slow is. Stud athletes are like racehorses; they will go too hard if there’s no jockey up there pulling on the reins.

And boy does Lake Zurich have some studs. One interesting aspect I noticed during the team meeting, which could certainly be inconsequential, was that the best athletes on the team (who also happened to be seniors) were seated on the floor. On many teams, the studs or the seniors would insist on sitting at the desks. Certainly, the desks are more comfortable and might be seen as a status symbol, like sitting in the back of the bus. But those kinds of symbols were apparently unimportant at Lake Zurich. The studs sat on the floor.

How those studs became studs is a fairly interesting story. For four years, opposing coaches have known about current senior, Matt Pereira. The long-legged, always-smiling Pereira finished as the runner-up at the 2013 North Suburban Conference Cross Country Championships as a freshman, then finished 69th at State. In track that year, he got even better, winning Conference in the 1600-meter and 3200-meter runs, then earning his first All-State honor by placing eighth in the 3200-meter run at the State Championships. Anybody who runs a 9:12.66 in the 3200 meters as a freshman has to be considered a prodigy.

Pereira took another step up as a sophomore in cross country, placing third at the State Championships with a 3-mile time of 14:22. He was joined at the state meet by two other members of the Lake Zurich class of 2017: twin brothers Kyle and Brian Griffith. Kyle ran cross country as a freshman, but Brian did not. Both went out for baseball in the spring of their freshmen year, but got cut and joined the track team. After running a 2:04 in the 800-meters, Brian realized he had some running talent and decided to give cross country a try in the fall of his sophomore year.

Brian Griffith finished fourth just among Lake Zurich underclassmen at 2014 IHSA State Cross Country Championships—Pereira, his brother Kyle, and freshman Pat Burns all beat him. Five months later, during their sophomore track season, Brian had passed them all and was winning invitationals.

That was a scary thought for area coaches. Matt Pereira, the kid who had dominated the conference the past year, might not even be the best runner in the sophomore class at Lake Zurich. Brian Griffith and Matt Pereira both made the IHSA State Track & Field Championships individually and on a relay that spring. Griffith placed 11th in the 800-meter final with a time of 1:55.92, while Pereira did not advance out of the 1600-meter prelims. They combined with Kyle Griffith and senior Justin Shim to finish ninth in the 4x800m Relay, with a time of 7:51.30.

Both Griffith brothers made a huge leap their junior year of cross country. After being beaten by Pereira by 84 seconds at the 2014 IHSA State Cross Country Championships, Brian Griffith finished just one second behind his teammate in 2015. Pereira was fifth overall in 14:29, while Griffith was seventh in 14:30. Kyle Griffith improved tremendously as well, taking 45 seconds off his 2014 time to finish 21st overall in a time of 14:44. Lake Zurich had three of the seven best juniors in the entire state.

Matt Pereira made history a few weeks after the State Championships, but for a bit it looked like the long high school season had cashed him out. He finished a disappointing 67th at the Nike Cross Midwest Regional Championship. But a week later, Pereira rebounded in a major way by finishing seventh at the Foot Locker Midwest Regional Championships, running an amazing time of 15:13.6 on the hilly 5000-meter course at the University of Wisconsin Parkside. That performance qualified him for the most prestigious high school cross country race in the United States, the Foot Locker National Championships, where he finished 24th in the nation. Drew Hunter, the Virginia Prep athlete who set the indoor high school record in the mile with a time of 3:57.81 a few months later, won the race going away.

All three juniors made the State Championships individually in the spring of 2016: Brian Griffith (800m), Kyle Griffith (1600m), and Matt Pereira (3200m). Brian Griffith was once again the top athlete, running 1:54.64 to make the 800-meter final, where he finished 10th.

Coach JB Hanson has been there through it all. There were precious few meets remaining as I visited his practice; just Conference, Sectionals and, almost assuredly, State.

How Do These Programs Compare to One Another?

What you have read so far is just a snapshot of one practice from each program. Below, I will compare and contrast how the programs operate on a daily basis.

Coaches

All three schools have a different setup for their coaching staffs. Grayslake Central completely combines their boys’ and girls’ programs. James Centella is the head coach for both programs, and both of his assistants help with both programs as well. Lakes has a separate head coach for boys and girls, but no assistants—they’re it. Travis Shepherd is the head coach for the boys, while Keith West is the head coach for the girls. Both act as each other’s assistant. Lake Zurich has perhaps the most desirable coaching scenario, with each program having their own head coach and their own assistant. The two programs help each other out here and there, but ultimately, they run independently.

Theory

Coach Centella at Grayslake Central said he gets a lot of his workout and training ideas from Drew Hunter’s coach, Tom Schwartz. This is the second time I have mentioned Drew Hunter in this article, so he must be pretty good. Basically, they do two workouts a week at GLC. If they have two meets that they run hard in, those are their only workouts for the week. Whether they run hills or not is dependent on where the championship meets will be at the end of the season. This year, with nothing but pancake-flat courses on the horizon, the need to train for hills is minimal. Part of their philosophy includes some top speed running. Many coaches believe that the “strides” their athletes do before or after a run constitute top speed running. Coach Centella will occasionally have his athletes do 6x40m top speed with an easy one-lap recovery jog.

Travis Shepherd at Lakes runs a relatively standard Jack Daniels program, with some Greg McMillan wrinkles thrown in. They were able to get a grant from the Lakes Booster Club for 22 heart rate/GPS monitors, which help them immensely in their training. Lakes does what Shepherd calls “two and a half” workouts a week, on Tuesdays and Wednesdays, with meets on Saturdays. Their long runs max out at 90 minutes for the elite athletes, and they do a long run at least every 10 days. Shepherd believes in running V02 intervals in October, which would include around 3 miles’ worth of repeats at race pace with full recovery. On “easy” days, Shepherd will sometimes have his athletes do lactic acid tolerance training, 4x300m repeats at half-mile pace (45-50 seconds) with a 400m jog recovery. They also lift weights twice a week, mainly doing mini-band work and power lifts. Coach Shepherd was kind enough to share a two-week training block with me.

Cross Country Training Plan
Figure 1: The training plan for the Lakes boys’ team, for the last two weeks of September 2016. Coach Travis Shepherd runs a relatively standard Jack Daniels program, with some Greg McMillan wrinkles thrown in.

Keith West coaches the Lakes girls using what he calls a “watered-down” version of the training he learned at Loyola University (Chicago) from his old coach, Gordon Thomson. He adapts their training every year. This year, he started their hard workouts a month later in the season, which has shown immediate benefits. The athletes seemed fresher in their early-season races this year than they had in the past. West also has the top athletes running about 25 percent more than they have in the past, but that is due to those athletes upping their mileage in the summer. He states that their off-season work was better this past summer than it has ever been, which is a big reason the Eagle girls are having such a remarkable season. One of his favorite workouts is running a tempo on Wednesdays, with the girls doing four or five 1200m repeats with about 90 seconds of rest. They do not lift much, and instead do injury-prevention circuits.

When I asked Lake Zurich coach, JB Hanson, about their training, he replied, “We’re a Paavo program.” Paavo, of course, is Paavo Nurmi, the “Flying Finn” who won nine Olympic gold medals and set 22 world records. Part of the Paavo program means Coach Hanson will assign the athletes to different groups, levels A-N, depending on their ability. He has a bigger range of athletes than most teams, by virtue of the fact that his top athlete finished 24th in the nation last year. Unlike Grayslake Central and Lakes, he bases their distance runs on miles, not minutes. They complete an average of three workouts a week once they have a base under them.

Pre-Run and Post-Run

Thankfully, most distance coaches have seen the value of strength and coordination in their athletes, and have adapted their practice routines accordingly.

All the practices I visited fell under the “easy run” moniker. Grayslake Central and Lakes both had pre-meet days, while Lake Zurich had a Critical Threshold (CT) day. Yet, while the norm used to be for coaches to just let their athletes trot their miles and then send them home, all three programs I visited did some sort of balance, coordination, functional strength, and dynamic stretching activity both before and after practice. All had some sort of stride or race-pace running. None of them did any static stretching. Thankfully, most distance coaches have seen the value of strength and coordination in their athletes, and have adapted their practice routines accordingly.

Facilities

Grayslake Central is located right next to a park and a middle school, which both provide lots of grass and paved trails. They only need to cross one street to get to a good chunk of prime running space, so that is where they spend the majority of their time. Lakes has perhaps an even better setup. They have a crushed-gravel trail wrapping around on the west side of their high school, and plenty of athletic fields surrounding the school grounds as well. In fact, they have the ability to field a very nice cross country course right on their school grounds. Just outside the door where they meet as a team, they also have a beautiful hill at about a 5-percent incline. The hill, which has both a paved and a grass section, is wonderful for all sorts of training. Lake Zurich has the least-advantageous setup, being located right in the middle of suburbia. But they have a lot of field space on their campus as well, plus plenty of delightful neighborhoods in the surrounding area suitable for running in.

Trail for Cross Country Training
Image 5: Many programs would love the crushed-gravel trail winding around Lakes Community High School. The cross country team also benefits from a hill next to the school that has about a 5-percent incline, and both paved and grass sections.

Dual Meets

Unfortunately, all three programs have to deal with constant dual meets on their schedule. Most high school athletic programs follow a somewhat similar schedule to what the college programs in their sport follow. For example, high school and college football teams play one game a week. High school and college basketball teams play two and occasionally three games a week. But in cross country, when most college programs are running one race every other week, these high school athletes are expected to race twice a week. Though these weekday dual meets can have some advantages, ultimately, most coaches who are subjected to them feel they are a chore.

Grayslake Central and Lakes are both in the newly established Northern Lake Country Conference. The teams are required to run four duals meets (some are actually triangular meets) against each other in order to determine a “dual meet” champion. Lake Zurich belongs in the North Suburban Conference, which is where Lakes was until the conference split up in the summer of 2016. The conference used to have two different seven-team divisions, and the dual meets would determine the division champions. Now there are eight teams in the conference, and no divisions. The dual meets, to the dismay of basically every single coach, count for 25 percent of the conference championship. In theory, your team could win the North Suburban Conference meet and not be crowned conference champions.

Lake Zurich has a 66-game winning streak in dual meets. They run their athletes hard when they have to in order to win, and at other times run the meets they figure they can win more easily as a tempo workout. Grayslake Central operates basically the same way. They only run hard if they have to, especially since they only run two workouts per week, and a hard meet counts as a workout. Lakes generally takes the same approach, and will sometimes even rest their varsity from an invitational.

Extras

Being part of a team is, of course, more than just workouts and exercise. That is a training group, not a team. A high school team, especially, needs ways to keep the athletes interested. All three programs I covered have active Twitter accounts, which has become essential in our internet age. (You can follow Grayslake Central, Lakes, and Lake Zurich at these links.)

Grayslake Central and Lakes both have “theme days” at practice, where the athletes spice it up by dressing in pajamas, mismatched clothes, neon, or as twins. Fun apparel days were mentioned in my article, “The Power of Apparel in Sport,” so I am happy to see such days working so well for top programs. Lake Zurich runs a little bit more serious of a program, and does not do apparel days. They do, however, have the freshman boys face off against the freshman girls in a dance-off the Monday after the conference meet. The freshman boys, Coach Hanson noted, have dominated the previous battles.

There are dozens of other little nuances here and there that make each of these programs unique, from spaghetti dinners to fundraisers to team outings, to a multitude of other memorable activities most athletes are certain to remember more than their average mile pace.

All three programs I visited were very comparable in certain ways and very unique in others. All the coaches are constantly tweaking their programs to try to get the best and most enjoyable experience for their athletes. Just following them around for one practice was extremely entertaining for me, and I thank them all tremendously for agreeing to be a part of it. Hopefully, all of you reading this article can take something from one of these programs to help make your own team better.

The Results

And now for the results:

Conference

In the first year of the Northern Lake County Conference, the Grayslake Central boys scored a dominating victory with just 25 points. The Rams swept the top three spots, with Jake Aho (14:14), Matt Aho (14:32), and Eli Minsky (15:14). Lakes finished second with 52 points, led by Jeremy Wallace (15:15) in fifth place. Nine of the top twelve places in the eight-team conference went to athletes from Grayslake Central and Lakes. On the girls’ side, Grant Community High School won with 41 points, while Lakes earned second with 59 points, and Grayslake Central came in third with 74 points. Lakes freshman Olivia Schmitt (18:19) finished third, followed in fourth by Megan Girmscheid (18:28) of Grayslake Central.

Grayslake Central was not the only team I covered that dominated their conference meet with a 1-2-3 finish. Lake Zurich scored just 21 points at the North Suburban Conference meet, with Brian Griffith (15:17), Matt Pereira (15:22), and Kyle Griffith (15:31) sweeping the top three spots. Collin Luell (15:45) of Zion-Benton was the only athlete to break up a 1-2-3-4 Lake Zurich sweep, beating LZ’s Patrick Burns (15:47) for fourth place.

Sectionals

The goal for all of the programs I covered was to qualify for the IHSA State Championships, which is only possible by finishing among the top five teams at the Sectional Championships. All the teams I covered first made the Sectional by qualifying out of the Regional Championships.

Grayslake Central and Lakes were both placed in the Belvidere Sectional of Class AA, easily the most loaded Sectional on both the boys’ and girls’ sides. For the boys, four of the top seven and nine of the top 24 ranked teams in the state would compete at Belvidere. Grayslake Central came in seeded fourth in the state, but second in the Sectional behind Crystal Lake Central. Lakes came in ranked 11th in the state and fifth in the Sectional. The girls’ Sectional looked to be even tougher, hosting five of the top six ranked teams in the state! Lakes was ranked sixth in the state and fifth in the Sectional, while Grayslake Central was ranked 14th in the State and seventh in the Sectional. Only 25 teams total would qualify for the State Championships, and the Belvidere Sectional for both boys and girls had nine of the top 25 ranked teams in the state. Just five from each would qualify.

Lake Zurich would face some stiff competition in their Class AAA Sectional in Waukegan as well. The Bears were ranked fourth overall in the State, just ahead of the fifth- and sixth-ranked teams from Hersey and Prospect, respectively. Overall, the Waukegan Sectional was not as deep in its division as the Belvidere Sectional though, with only five teams ranked in the top 25.

The girls were up first on Saturday, October 29, at the Belvidere Sectional. With so many top-ranked teams, there was little room for error. Certainly, this was a race the Lakes girls would like to have back. Needing to finish in the top five to advance, they finished eighth, just 14 points away from their State dreams. Adding to the sting was the fact that their top runner, Olivia Schmitt, missed qualifying as an individual by one place. She ran 18:19 to place 15th overall, and finished so close to the final individual qualifier—Sophia Oury of Hampshire—that she could have almost reached out and touched her.

Which girls’ teams earned that fifth-place spot and a trip to the State Championships? Grayslake Central. Despite having their top athlete, Elizabeth Aho (yes, she’s related to Jack and Matt), finish in just 28th place, the Ram ladies crammed all of their top five in the first 57 runners to sneak away with a team score of 212. They narrowly edged out Boylan Central Catholic (214), Woodstock (214), and Lakes (226) for that coveted fifth spot.

The boys’ race would be just as exciting, especially if your last name was Aho. Jack (14:36) and Matt (14:54) once again smoked the competition for a 1-2 finish. Their teammates did their jobs as well, and Grayslake Central came away with their second Sectional team title in a row. Just like their female counterparts, the Lakes boys came in seeded fifth in the Sectional and left with an eighth place finish. The silver living for the boys, however, was that senior Jeremy Wallace’s 12th place finish in 15:35 earned him a trip to the State Championships, just the third athlete in program history to do so.

Over at the AAA Sectional in Waukegan, the Lake Zurich boys once again imitated Grayslake Central by finishing 1-2 individually. Brian Griffith edged out teammate Matt Pereira, this time 14:51 to 15:00. Kyle Griffith finished sixth in 15:14, and the Bears easily took home their second Sectional title in a row with a score of 79.

Both the boys’ and girls’ teams from Lakes ended their season three places away from their ultimate goal. Despite the outcome from the most difficult Sectional in the state, it would be hard to argue against both programs experiencing their most successful year ever. True, the Lakes girls made the State Championships as a team in 2008, but was that collection of girls better than the current crop? At Sectionals on the same course back in 2008, the top five Lakes girls ran 18:50, 18:51, 19:27, 19:57, and 20:53 (average time 19:35). This year’s team ran 18:19, 19:20, 19:54, 20:00 and 20:03 (average time 19:31). The 2008 team finished third, even though there were only four Sectionals back then. The 2016 team finished eighth, with the teams in AA spread out over five Sectionals instead of four.

Evidence of the distance runners in Illinois getting better can be shown on the guys’ side as well. Ryan Prais of Lakes, who qualified for State individually in 2009, 2010, and 2012, got faster on the State meet course every year, but got a worse place every year, too! He ran 15:31 for 16th in 2009, 15:22 for 35th in 2010, and 15:19 for 40th in 2012.

With coaches learning from each other, sharing and copying ideas, and helping nourish what has become an incredible running community, I hope this great sport will continue to flourish, and the times will continue to drop.

Onto State

The IHSA State Cross Country Championships are quite the spectacle. Hosted at idyllic Detweiller Park in Peoria, Illinois, the meet has seen the exploits of such running greats as Craig Virgin, Tom Graves, Jim Spivey, Donald Sage, Jorge Torres, Matt Withrow, Evan Jager, Chris Derrick, and Lukas Verzbicas. On Saturday, November 5, it will host this year’s crop of exceptional talent.

Jack Aho of Grayslake Central has a great chance to repeat at the IHSA Class AA State Cross Country champion. Brian Griffith and Matt Pereira of Lake Zurich should both contend for the individual title in Class AAA. Their senior-laden teams have a chance to earn a trophy by finishing in the top three. Many of the athletes profiled in this article will have a chance to earn All-State honors by finishing in the top 25 in their division.

Girls’ results can be found here, while boys’ results can be found here.

Since you’re here…
…we have a small favor to ask. More people are reading SimpliFaster than ever, and each week we bring you compelling content from coaches, sport scientists, and physiotherapists who are devoted to building better athletes. Please take a moment to share the articles on social media, engage the authors with questions and comments below, and link to articles when appropriate if you have a blog or participate on forums of related topics. — SF

Soccer Goalie

Football: Still the Beautiful Game?

Blog| ByChris Gallagher

Soccer Goalie
Photo credit Maxisport / Shutterstock.com

Football—sorry, soccer (that word always sticks in the throat) —is the global game. It is the most popular sport in the world, with genuine global appeal. Everyone stops for the World Cup, and it is estimated that 600-700 million people watch the World Cup final.

When I was growing up, I wanted to be a footballer, but it turned out that I’m a bit crap at football. So, instead, I decided to combine my natural affinity for science-based subjects at school with my passion for sport. I studied sports science, and ultimately became a strength and conditioning coach. If asked as I was completing my education, I would have described my dream job as being a sports scientist for the famous Rangers Football Club of Glasgow, Scotland. What could be better than training the players of the team you idolised as a child, taking them through warmups on match day, and having a front-row seat in the dugout on match day?

In my short career as a strength coach, I have worked in football and rugby, and I currently work with Olympic and international athletes in athletics, rowing, and squash. I seem to have moved away from football in recent years. This was not a conscious decision. However, it was a conscious decision to seek out opportunities to work with athletes at increasingly higher levels of performance, and in sports and environments where physical preparation, the application of science, and the applied knowledge of best practices were at the forefront of athletic development.

This opening preamble sets the scene for the reason why, just today, I was once again dismayed to see another “strength” training video from the world of elite football. (Actually, the video is two to three months old, but it only just made its way onto my social media radar tonight.)

Juventus Football Club

The Need for Better Training in Football

I assume that the majority of readers are based in North America and, therefore, are not perhaps familiar with the Juventus Football Club. Juve, also known as The Old Lady ([La] Vecchia Signora) is the most successful team in Italian football and one of the most successful teams in European—and, therefore, basically World—football. The team is the elite of the elite and crème de la crème, when it comes to the realm of football. Their black-and-white-striped kit is instantly recognisable and unmistakable.

Aspiring coaches, sports scientists, and players would eagerly seek out and follow the example they set: “If it’s good enough for footballing superstars like Gianluigi Buffon and Gonzalo Higuaín, then it’s what I must be doing.” It is quite frustrating, therefore, to once again see such seemingly low-level training being promoted by the elite of world football.


Video 1: Juventus Football Club players participate in a group workout labelled as “At work in the gym.” However, the exercises shown in the video are extremely low-level training exercises more often used in warmups. Football teams need to stop promoting these types of exercises as serious strength training techniques.

And this is not the first time that football has let itself down in such a fashion. My mind immediately jumps back to the famous videos of Atletico Madrid, the finalist in the Champions League (European football’s premier competition) in two out of the last three seasons.

Football appears unwilling to join the modern world of athletic development. Football is a special sport, where athletes apparently do not need to develop basic levels of strength and power.

This is not a war cry for football to take on an exclusively powerlifting or Olympic weightlifting focus. But dressing up an overly elaborate warmup as “functional” strength training is blasphemous to a strength and conditioning coach who loves the “beautiful game.”

There is nothing wrong with many of the exercises in the video. I have used lots of them in warmups, as part of an injury rehabilitation or prevention work. But after a few suspension trainer rows, some hip mobility, and some planks, you can be sure my athletes will then go and do some actual training.

Many knowledgeable strength coaches, sports coaches, and personal trainers are now fully aware of the “con” that is functional training. Any training that improves an athlete’s ability to compete in their sport is functional. So, despite the message first preached by functional gurus, squats, bench presses, and any other barbell exercises are very often functional.

Functional training is the “Emperor’s New Clothes” of training. Everyone knows it’s bullshit, but they don’t want to point it out for fear of being outcast by their kind and/or the gurus. So, they all carry on pretending they can see the “functional” benefits. The big issue with a lot of these so-called functional exercises is that they fail to obey a basic law of training, and that is progressive overload. If the training does not stress the athlete beyond their current capabilities, then there is no stimulus for the body to adapt and improve.

Training must include progressive overload in order for the body to adapt and improve. Share on X

As previously stated, the exercises demonstrated by the Juve players and coaches are not, in and of themselves, bad or wrong. But they are insufficient to develop a world-class footballer for the demands of the game. If that is a Juve “strength” session, they may want to consider including some exercises that actually develop strength: that require their athletes to produce force and overload their neuromuscular system.

Coaches and Trainers Want to Do Serious Training

Football is the beautiful game. It is the most popular sport in the world for good reason. But, it seems to me, as a sports performance practitioner not currently operating in European football, that there are fundamental issues with its philosophies and concepts of athletic development. This problem is not pervasive throughout all of football. I know sports scientists and coaches doing excellent jobs of changing attitude and behaviours, educating, and building strong cultures. But there do appear to be issues with some of the real heavyweights of European and World football in adopting modern, effective training practices.

As an outsider looking in, I believe that the ambitious strength and conditioning coach who wants to work with the best athletes, cultures, and coaching staff, in the highest level environments, would be better off working in sports like American football, rugby, or track. The biggest clubs in European football do not seem to offer an environment for an ambitious, educated, and experienced strength and conditioning coach. There is no possibility of complete job satisfaction and professional fulfilment from having athletes perform glorified warmups and bastardised physio rehab protocols, when they could be working with a prop forward, line backer, or 200-meter sprinter, and doing some serious training.

Since you’re here…
…we have a small favor to ask. More people are reading SimpliFaster than ever, and each week we bring you compelling content from coaches, sport scientists, and physiotherapists who are devoted to building better athletes. Please take a moment to share the articles on social media, engage the authors with questions and comments below, and link to articles when appropriate if you have a blog or participate on forums of related topics. — SF

Penn Relays

Book Review: Coaching Track & Field Successfully

Book Reviews| ByJohn Brumund-Smith

Penn Relays
Photo credit Aspen Photo / Shutterstock.com

Coaching Track & Field Successfully is a comprehensive educational book by track guru, Mark Guthrie. Using tried-and-true methods, personal success stories, positive examples, photographic demonstrations, and tips from experts, Guthrie covers all areas of track and field, in a straightforward manner that can benefit coaches and athletes of all abilities and experience levels.

Coach Guthrie had unusual success in his 19 seasons as the head boys Track & Field coach at the University of Wisconsin-La Crosse, where his teams won 22 NCAA Championships. This book was written in 2003, at the height of Guthrie’s success, when his teams were in the middle of nine consecutive NCAA titles, and while he had 13 NCAA event champions and one Olympic champion (Andrew Rock) on his roster. Before coaching at UW-La Crosse, Guthrie had tremendous success as a high school coach at Fennimore (WI) and Naperville North (IL). After UW-La Crosse, he had success as both an assistant college coach in Division 1 at the University of Wisconsin and as head college coach in Division 1 at Central Michigan University, showing Guthrie to be a proven winner on virtually every level. The variety of his experiences and successes shine in Coaching Track & Field Successfully.

Before delving into the techniques and strategies for each different event that are typical of most training books, Guthrie spends the first six chapters going over general coaching methods, procedures, philosophies, and implementations. Some pieces of advice that he gives aspiring coaches hoping to develop their own coaching philosophy are to be yourself, exude confidence, stay calm, and serve as an example. He also gives specific examples of oft-ignored coaching tools, such as printed practice schedules, team policies and procedure sheets, and daily workout handouts.

There are plenty of other important tips and techniques available in this book that will help improve your own coaching.

In addition to philosophies and general coaching advice, Guthrie breaks down every event in track and field from a technical and tactical standpoint. Guthrie himself writes the chapters on the sprints, relays, hurdles, and high jump, and employs some of his top-notch assistant coaches to write the rest of the chapters on their areas of expertise. Dr. Phil Esten (distance), Joshua Buchholtz (pole vault), Evan Perkins (long and triple jump), and Dennis E. Kline (throws) all write excellent chapters on the training, methods, and techniques of their various events, complete with pictures, charts, training maps, and detailed explanations.

Coaching Track and Field Successfully

The world of track and field contains many different philosophies on each of the various events. While this book attempts to cover the scope of those varying philosophies, the experts ultimately give their advice based on their own evolved philosophy. Coach Guthrie’s philosophy on running the 400 meters, for example, emphasizes longer, slower intervals with little time to develop speed and acceleration, even contending that athletes should never run faster than race pace during training. That advice conflicts with the short-to-long program emphasized by some other coaches. But even if general issues like these underlying philosophies are out of touch with your own values, there are plenty of other important tips and techniques available in this book that will help improve your own coaching.

The last two chapters in the book focus on coaching meets, a highly underrated aspect of the sport. Again, Guthrie fills in what most coaches might overlook, such as relaxation, mental recall, pre-meet routines, and expectations. He stresses details, even encouraging coaches to provide an itinerary and a list of items to pack.

Perhaps the most valuable part of the book is when Guthrie digresses from the organized structure and gives personal examples from his coaching career. In one such example, he talks about the way he adapted in his very first coaching position when the school did not have a track: They drilled holes into the sidewalk to install blocks, painted lines in the parking lot, poured concrete for throwing rings, used a tractor to dig a hole for the jumping pits, etc. He ended the anecdote with a great quote: “The biggest tool or stumbling block you have for maximizing your current facility is your imagination.”

Coaching Track & Field Successfully is straightforward and masterfully written, and manages to be both simple and comprehensive at the same time. By exposing the reader to not only his own vast knowledge of the sport, but also to that of his expert assistant coaches, Guthrie provides the tools that can help any level of track and field program achieve success.

Since you’re here…
…we have a small favor to ask. More people are reading SimpliFaster than ever, and each week we bring you compelling content from coaches, sport scientists, and physiotherapists who are devoted to building better athletes. Please take a moment to share the articles on social media, engage the authors with questions and comments below, and link to articles when appropriate if you have a blog or participate on forums of related topics. — SF

Block Start

Breaking Down the Start: Before and After Report

Blog| ByChris Korfist


Block Start

In this article, I break down the workout I developed for an athlete featured in Acceleration and Power: Breaking Down the Start. I also include pictures from my initial assessment and from four weeks after he started the program.

Before participating in the training program, his best time on acceleration block 9.2 m was 1.79 seconds. After four weeks of training, his best time was 1.61. (Note: The start used a touch pad and does not include reaction time. When using a touch pad, athletes can begin to push before the thumb releases the start button. The finish transmitter was placed at 10 meters, the watch triggers 0.8 m before the transmitter, and the timed distance was 9.2 m).

I do not directly train this athlete. Some athletes send me videos, and I do an assessment and build a workout for them.

Day 1: Block 10’s (cycle of 2-3 weighted + 1 unweighted)

Day one is form day. We work some actual starts on this day, and the block work is for 10m. This works great when timed with a Freelap system or a Swift Speedlight timer.

With the beams set through an iPad, a coach can get splits for the distance that the athlete runs. When the athlete completes the distance, the coach receives an immediate force/velocity curve. This always helps determine which direction to go for setting up a training program. It also has a reaction function to measure reaction times from a signal, which especially helps in track. We’ve had athletes drop times based only on their improvements from this function.

When starting, the initial push needs to bring the athlete’s torso up by driving hips forward. The push from the back leg should be explosive and powerful. It’s important to have a good push from the back leg to move the center of mass forward. If the athlete pushes from the front, they lose this initial movement that’s so important for sprinters (JB Morin’s research).

My coaching cue is “boom-boom.” Push from the back foot and then the front foot. From this movement, the pelvis starts its job in the acceleration. The pelvis of the swing leg needs to start driving up the torso.

This is the big difference between runners who have a great start and those who have an average start. When the hips drive forward, they create length and space for the foot to land underneath, rather than in front of, the center of mass.

To further help this position, the coach can give a cue to keep the angle of the knee as acute as possible during the drive phase. If the coach is watching from the side or assessing film, the swing leg knee should not stop moving forward before the plant leg’s toe off.

There should be some hang time in the first steps of acceleration. Of course, the fancy arm split will also create forward movement and hang time. At this stage, if the foot lands too far in front, the hamstring has to do the job of the rectus femoris, and true triple extension will not occur. In fact, this is why some people pull their hamstring coming out of the blocks.

After the first (or balance) step, an athlete should strive for hips to reach 60-80 degrees of anteflexion, acute knee angle, a dorsiflexed foot, and free hip up. The knee is still moving forward or suspended at toe off. If the knees are even in the stance phase and the swing leg knee is lower than the stance leg, the athlete lacks stiffness.

All of this happens very fast, so we need to slow the whole process down. I like to take a heavy band, sled, EXER-GENIE, or Run Rocket and make it heavy. When the athlete starts, they focus on thinking they are like a gazelle.

The runner moves the hip up and forward while keeping the swing leg angle between the calf and hamstring tight for as long as possible. The chest should be upright at a 45-60 degree angle. When the leg comes down, the emphasis is to land “behind” the body and drive forward.

The support from the band also allows the athlete to stay low. I like to contrast 2-3 of these runs with a normal acceleration. To shake things up and challenge the runner’s form with various surfaces, the coach can put mats in the area of the start.

If this athlete were training with me, we would add the 1080 Sprint and go three contrasting starts and rotate. I like the heavy work for horizontal force, and the 1080 for smaller amounts of force for the actual start and a free start.

Day 2: Explosion Exercises

Day two is an explosion session where the athlete focuses on his first two steps out of the hole. This runner has a problem getting his chest up, so this is the focus of the session. The Swift SpeedMat would be helpful here to record jump heights.

1. Basic Box Jump

The first exercise is a basic box jump. The athlete finds a box that’s about the height of their mid-shin. They put the front leg of their start on the box which is placed off to the side. The athlete should allow as much dorsiflexion as possible and push the hips back. The amount they bend will depend on how they look in the blocks.

In this runner’s case, I don’t want him to go down very far because he lacks the stiffness to do so. He needs to develop the snap up. So he’ll go down to about 80 degrees (90 is vertical). From there, he initiates the movement with his hips driving forward and snaps his body straight up in the jump. His leg on the ground will drive forward as he tries to bring his knee as high as possible.

To make this drill more difficult, the coach can place a high box diagonally so the second step has to slam down on top of it and then the athlete can drive from that leg also. When they get stronger, they can drop the torso lower.

2. Bound Uphill on Moderate Angle

Another drill is to bound up a hill of moderate angle; parking decks have the perfect angle. I like to add some lateral motion as well. Again, the focus is on hip movement, knee angles, and stepping “behind” the body.

3. Good Morning to a Step

I like this drill because it’s similar to a start regarding hip movement. Keep the weight light to avoid creating slack or poor drivers.

4. Crouch to Stairs

Crouch to stairs is similar to the Good Morning to a step. Start from a bent position and have the athlete work their way up 2 to 3 stairs. They key is the hang time when stepping down to the stair. It is the “foot from above” principle that allows us not to decelerate when trying to accelerate. Watch the first part of this video.


Day 3: Speed Work

So we don’t get away from speed work, I’ll add a day of fly 10’s with some extra drills.

1. Fly 10’s with No Arms for Time

Do fly 10’s with no arms. I call it “hugs not pugs.” This stance forces the athlete to drive to their big toe more. We take time on this as well.

2. Single Leg Cleans

To help drive the pattern of fly 10’s with no arms, add single leg cleans to a toe.

3. High Knee Skips Uphill

High knee skips uphill force the hips to drive the knees up and forward. The skip creates tension in the body between knee lifts and allows time to complete the knee action.

4. Lateral High Knees Uphill

Lateral high knees up a hill are like a Pom line doing the can-can. The height of the ramp pushes for high hip movements, and the angle drives to the big toe.

5. Daily Toe Pops Uphill

Daily toe pops up a hill drills rigidity and ankle stiffness. When an athlete does ankle pops on a flat surface, the bounce allows them to move forward. Or in some cases, they use their neck to help move forward (seahorse). This is not ideal.

To make the drill better, have the athlete keep the ankle rigid on contact. The ankle has to rock forward to create movement. When an athlete does a toe pop up an incline, the ankle stays stiff for the landing but must bend forward to move the energy in the body to propel forward. The athlete can do one or two legs.

At this point, wait until the athlete’s times stop improving. Then do one speed workout in a seven-day period and film the run. Based on this, the coach can make some decisions on what to work on next.

Sprint Acceleration Before and After Photos

Here are the pictures from my initial assessment and post-workout four weeks later. The pictures on the left are the before shots, and the photos on the right are the after shots. Although the surfaces and shoes vary in the videos, all the timing was done on a track with same shoes and weather conditions. All times recorded were using a Freelap timer.

Toe off on first step
Photos 1 and 2. Toe off on the first step. The athlete shows an improved horizontal drive and less spinal curve. He also has a sharper angle in his knee which will delay ground contact.


First step side view
Photos 3 and 4. The first step, side view. Immediately his shin angle is lower (improved rate of force development (RDF) or more efficient use of horizontal force), and his foot placement is more underneath his center of mass. His spinal alignment could improve.


Mid-Stance on the first stride
Photos 5 and 6. Mid-stance on the first stride. He has a better shin angle and forward lean. His swing leg is in a better position with a higher knee.


Approaching Toe-Off
Photos 7 and 8. Approaching toe off. Shin angle has improved. His knee has a sharper angle still. Photos 9 and 10. Toe off. Again the angle is sharper, and the swing leg is in a much better position.


Toe off.
Photos 9 and 10. Toe off. Again the angle is sharper, and the swing leg is in a much better position.


Foot contact is better positioned
Photos 11 and 12. Contact is better positioned. The foot will land more underneath the body, and the angles are more horizontal.


Four-point stance from the back
Photos 13 and 14. From the back, the stance is balanced.


Toe-off from the back
Photos 15 and 16. Toe off. He has a much better drive through his big toe. Notice how his hips are more square, and the carriage of his swing leg is improved.


Mid-stance from the back
Photos 17 and 18. Mid-stance. His hips are square, and the push looks like it will be more forward rather than off to the side. Carriage of the swing leg is higher, as previously noted. Photos 19 and 20. He has more of a horizontal drive, and the hip of his swing leg is higher.


Improved horizontal drive
Photos 19 and 20. He has more of a horizontal drive, and the hip of his swing leg is higher.


Higher foot carriage
Photos 21 and 22. This shot shows how his foot carriage is higher due to a higher hip on the side of the swing leg.


Toe-off with square hips
Photos 23 and 24. Toe off. Again, his hips are square resulting in better ground contact. In the before pic, his swing leg is about to hit crooked.


Toe-off with improved power
Photos 25 and 26. Toe off. The square hips give him a more powerful look.


Toe-off from the front
Photos 27 and 28. Front toe off. His body is more square.


Toe-off again
Photos 29 and 30. Toe off. Again, his body now is more square.


To learn more about the whole process, come to the Track and Football Consortium IV in Chicago on Dec. 2-3.

To have your workouts customized, check out Slow Speed School.

Since you’re here…
…we have a small favor to ask. More people are reading SimpliFaster than ever, and each week we bring you compelling content from coaches, sport scientists, and physiotherapists who are devoted to building better athletes. Please take a moment to share the articles on social media, engage the authors with questions and comments below, and link to articles when appropriate if you have a blog or participate on forums of related topics. — SF


  • « Go to Previous Page
  • Page 1
  • Interim pages omitted …
  • Page 156
  • Page 157
  • Page 158
  • Page 159
  • Page 160
  • Interim pages omitted …
  • Page 164
  • Go to Next Page »

Primary Sidebar

Latest Posts

  • The Six Absolutes of Perfect Technique
  • Building a Better High Jump: A Review of Stride Patterns
  • How We Got Our First Sprint Relays to State in Program History

Topics

  • Changing with the Game
  • form and technique
  • Game On Series
  • Getting Started
  • high jump
  • Misconceptions Series
  • Out of My Lane Series
  • Rapid Fire
  • Resistance training
  • Summer School with Dan Mullins
  • The Croc Show
  • track and field
  • What I've Added/What I've Dropped Series

Categories

  • Blog
  • Buyer's Guide
  • Freelap Friday Five
  • Podcasts

COMPANY

  • Contact Us
  • Write for SimpliFaster
  • Affiliate Program
  • Terms of Use
  • SimpliFaster Privacy Policy
  • DMCA Policy
  • Return and Refund Policy
  • Disclaimer

Coaches Resources

  • Shop Online
  • SimpliFaster Blog
  • Buyer’s Guide
  • Freelap Friday Five
  • Coaches Job Listing

CONTACT INFORMATION

13100 Tech City Circle Suite 200

Alachua, FL 32615

(925) 461-5990 (office)

(925) 461-5991 (fax)

(800) 634-5990 (toll free in US)

Logo of BuyBoard Purchasing Cooperative. The word Buy is yellow and shaped like a shopping cart, while Board and Purchasing Cooperative are in blue text.
  • Facebook
  • Instagram
  • Twitter
  • YouTube

SIGNUP FOR NEWSLETTER

Loading

Copyright © 2025 SimpliFaster. All Rights Reserved.