• Skip to content
  • Skip to primary sidebar
SimpliFaster

SimpliFaster

cart

Top Header Element

  • Facebook
  • Instagram
  • Twitter
  • YouTube
  • Login
  • cartCart
  • (925) 461-5990
  • Shop
  • Request a Quote
  • Blog
  • Buyer’s Guide
  • Freelap Friday Five
  • Podcast
  • Job Board
    • Candidate
    • Employer
    • Facebook
    • Instagram
    • Twitter
    • YouTube
You are here: Home / Blog

Blog

Soccer Striker and Goalie

The Use of RPE in Team Sports

Blog| ByTroy Cole

Soccer Striker and Goalie

The RPE scale (rate of perceived effort) is a common tool used to assess training intensity in individuals as well as teams. RPE values give a reference point for an individual’s internal load which can be compared with others during a similar session. A team’s sport scientist and coaches can take this data to plan sessions with specific intensities and manipulate training loads to fit into microcyles. When working on a budget in a team setting, there are benefits and challenges when using RPE scales.

RPE: Training Intensity and Variety

The use of the RPE scale is growing in popularity in team sports because the data collection is easy and it accurately assesses the internal load placed on an athlete during a training session. When I started serving as Head Athletic Trainer and Director of Sports Science for the Wilmington Hammerheads, I had played eight years in the lower leagues of professional soccer.

In lower division professional athletics, coaches and players constantly play an ominous guessing game when it comes to training load. As a player, I experienced two distinct problems with training.

First, players either were training too little or too much depending on their role on the team. Starters who played every minute of every game were asked to perform the same training intensity as players who missed games and were fresh for every training session. Reserve players buzzed in training but were blowing wind and coming up short against the demands of a league match.

Players often felt stuck between a rock and a hard place. God forbid, they told the coach they were unfit in games as a reserve player or, even worse, felt “leggy” during a session on Monday morning.

Second, coaches didn’t vary training. I remember some seasons as a player when I prayed for two games in a week for one simple reason—training monotony. With certain coaches, I knew we were doomed in the five-day training week between Saturday games. We would spend ninety minutes each day training at the same intensity all week. My teammates and I learned why the older veterans pressed cruise control during the week and why the younger, hungry players were smoked by match time on Saturday.

Using the hi/lo model dating back to Charlie Francis in 80’s, it’s easy to vanquish training monotony by increasing or decreasing the planned RPE for a weekly microcycle. Hence, in my new role with the Hammerheads, I was determined to monitor training load (volume x intensity) with objective (training time) and subjective (session RPE) data.

The RPE data helps plan the year, month, week, and daily training for the team and the individual players. Oh, and it cost nothing, which is another huge plus when a team has a limited budget. In theory, conducting this system seems like a no-brainer in my role as Director of Sports Science. As you know, theory is always best explored during experimentation, so expect road blocks when collecting RPE data in a team setting.

What is RPE?

RPE is a way to measure one’s subjective physical intensity. An athlete will describe the physical exertion by giving their effort a number value. There are a variety of scales used to determine an RPE score with numbers ranging from low to high. The low value correlates with easy effort, and the high number value correlates with extremely hard effort.

The Borg Rating of Perceived Exertion is a common RPE scale designed to give a value closely linked to a person’s heart rate. The scale ranges from 6 to 20. Six means no exertion at all and 20 means maximum exertion. Knowing that this scale correlates to an individual’s heart rate helps explain why the scale starts at 6. The number is simply multiplied by 10 to estimate what heart rate is reached during the time the person is asked to give a score.

Figure 1. The Borg Rating of Perceived Exertion is one way an athlete can subjectively rate their physical intensity. It was designed to correspond to a person’s heart rate. © Gunnar Borg, 1970, 1985, 1994, 1998.1
# Level of Exertion
6 No exertion at all
7
7.5 Extremely light (7.5)
8
9 Very light
10
11 Light
12
13 Somewhat hard
14
15 Hard (heavy)
16
17 Very hard
18
19 Extremely hard
20 Maximal exertion

Here are some guidelines for using the Borg scale:

  • Nine corresponds to very light exercise. For healthy people, it’s like walking slowly for some minutes.
  • Thirteen is somewhat hard exercise, but it still feels OK to continue.
  • Seventeen, very hard, is very strenuous. A healthy person can keep moving, but they have to push themselves. It feels very heavy, and the person is very tired.
  • Nineteen corresponds to extremely strenuous exercise. For most people, this is the most strenuous exercise they’ve ever experienced.

In my practice, I chose an even easier RPE scale of 1 to 10. One represents just standing, and 10 is the hardest game the athlete ever played.

Rating of Perceived Exertion Scale
Figure 2. My athletes and coaches find this scale easier to use than the Borg scale for reporting and analyzing information.

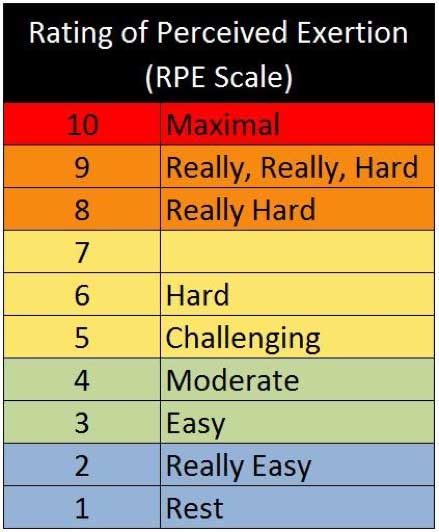
I find that this is an easier number for our coaches and players to understand while correlating it with Banisters model (training load in minutes X by session RPE= ___arbitrary units). For example, an individual’s training session lasting 60 minutes with their subjective RPE score of 7 would look like 60 x 7= 420 arbitrary units.

Why is RPE Important?

Rating training intensity is a very subjective measure. You can visit a local park to see the discrepancies. Look at a game of pick-up basketball, and you may notice each player has a different level of internal pain.

Imagine a shirtless, 6’3”, former D1 player making the game look easy as he blows past the middle-aged dude with the headband profusely sweating and sucking wind. Although you may not witness a scene as clear cut as this example, you get the point. No two people feel the same exercise the same way.

RPE is also important when planning sessions. We know the basic training variables to increase or decrease load using the FIT principle (frequency, intensity, and time). The amount of intensity is the major factor when deciding how each and every exercise will look. Frankly, this is the common difference between matches and training.

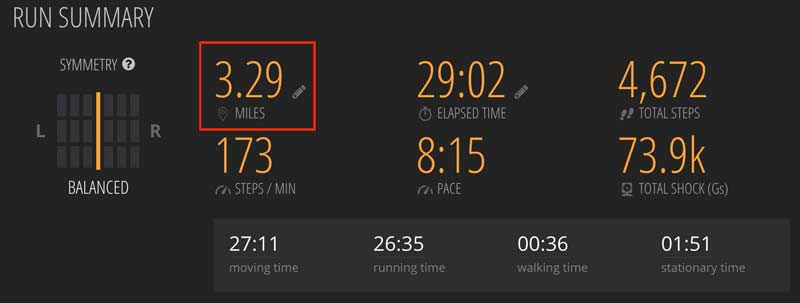
Think about a time you and your significant other walked two miles on the beach and chatted about life. Now think about the gut wrenching feeling you had in high school or college when coach told you to perform the Cooper’s Test (a two-mile test). The work done is the same, but the intensity changes everything. One leaves you relaxed and ready to eat dinner and the other leaves you upchucking behind the bleachers.

Once again an extreme example, but it shows what a big difference intensity plays on a session. In simpler terms, one can go longer when intensity (RPE) is lower and only last a fraction of the time when the intensity is high.

Does RPE Monitoring Enhance Decision-Making?

Although we can get as many data values that we want, everything comes down to this one all-encompassing question: Why? In our case, we have an eight-month season with eight pre-season competitions and thirty to thirty-five matches all over the United States. It’s crucial we have an objective measure to help us make decisions.

Our coaching staff’s major decisions revolve around when to work and when to rest. My job as Athletic Trainer/ Director of Sport Science was on the line when it came to a decision between work and rest.

In terms of work, I had to ensure our team was ready to handle the increasingly high demands of match fitness. I also greatly appreciated the notion of rest simply so our players could adapt to the stresses placed on them. Otherwise our treatment table could become overbooked.

I believe that the concept of rest is the most misunderstood and abused concept in team sports, especially soccer. Using RPE’s and monitoring training load can help coaches to understand the importance of rest.

RPE’s and the monitoring of training load help coaches understand the importance of rest. Share on X

When we look at session RPE data for individuals, clear trends become noticeable. This can be a life saver by opening up conversations among the coaching staff and players. At the very least, when something out of the ordinary occurs, the return on investment from data collection will provide rewards when it sparks conversations.

As mentioned, data collection also helps coaches plan correctly. When prescribing a specific training load, the coaching staff targets a specific intensity level to match the adaptations they want to occur. This helps hit the intended weekly team training load in a calculable way and avoid the dangerous “too little” or “too much” scenarios.

You can take this one step further and create a realistic training plan to progressively increase training load from week to week and keep the levels of progression safe at about a 10% increase.

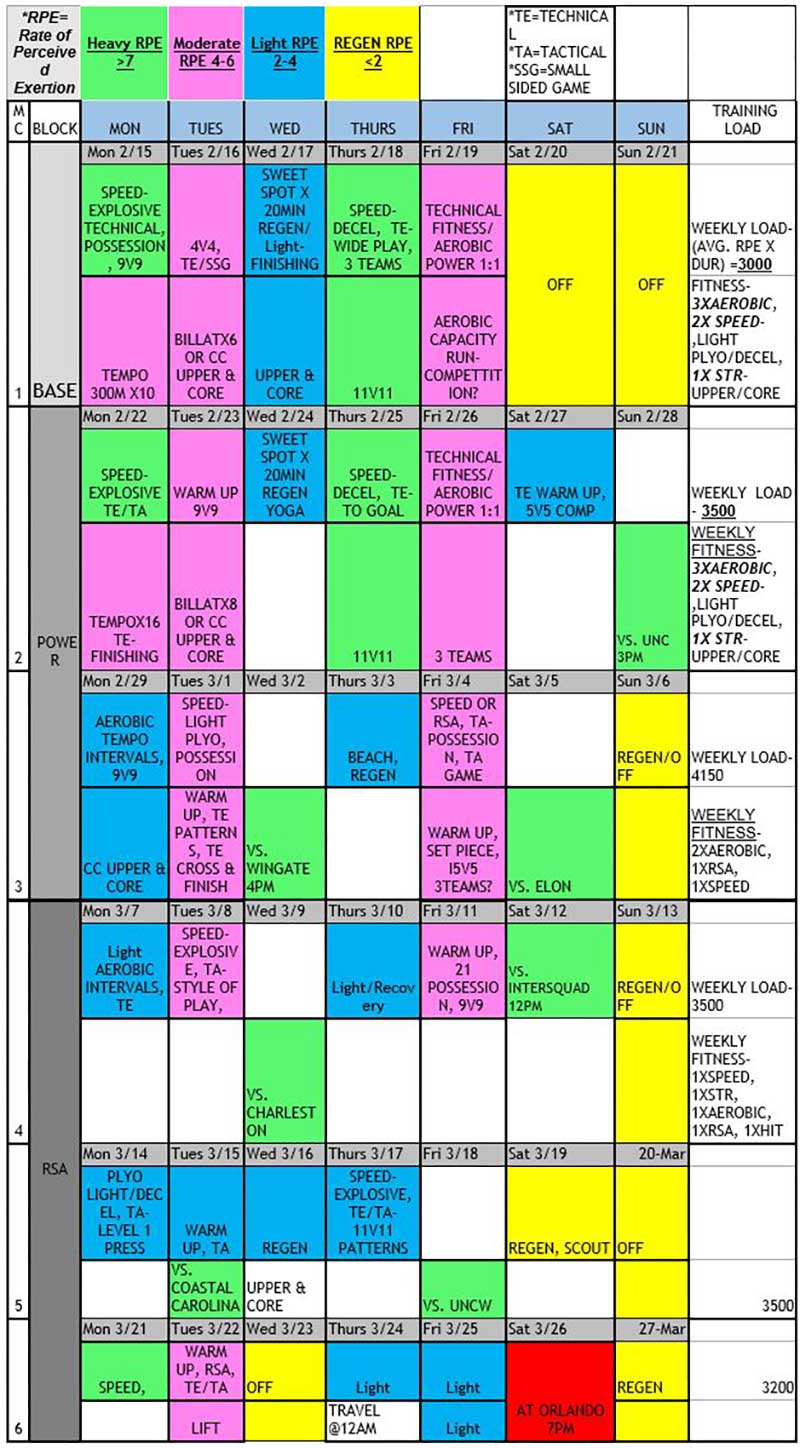
Before an athlete ever stepped foot onto our team, we made decisions about how we wanted our pre-season training to play out regarding volumes and intensities based on the RPE data. After the first day, however, I quickly learned we still had issues with the practical implementation.

Below is an example of how our technical staff used session RPEs in our pre-season mesocycle. It shows a slow progression of increased training load and, in theory, increased team fitness.

RPE Rate of Perceived Exertion
Figure 3. This chart is an example of a pre-season mesocycle using session RPEs to plan volumes and intensities.

Challenges with RPE Collection and Implementation

I was the only one gathering, monitoring, implementing, and analyzing data, and it didn’t take long to encounter problems with collecting a simple number value from each player. Please keep in mind that I was also the Head Athletic Trainer in charge of treatment/rehabilitation, immediate evaluation and care of players, on top of practice preparation, warm up, in-practice second assistant coach duties, and cool down.

My initial plan was to troll the players at the end of each session for an unbiased RPE value that was not tainted by their teammates’ answers. I carried a clipboard with the RPE 1-10 chart to remind players what the numbers meant and silently asked each player to rate their number. I did this immediately after training to get their true exertion assessments.

I soon realized this was an unfathomable task on top of the ten other duties I had. Determined to keep the process in place, I had the players fill out the form upon entering the locker room after training. I emphasized that their scores should not be affected by their teammates. The accuracy of the data was tainted right away, but we continued to keep this plan in place throughout the season.

Next, issues started to arise with practice plans. When making a session longer due to low-intensity work or RPE, you risk a coach’s on-the-fly decision to increase the intensity intended. For example, a routine Thursday training session with a tactical and technical emphasis before a Saturday match ends up taking longer because the team doesn’t perform well. The coach demands they work even longer and harder to get things right and until he’s satisfied.

It’s easy to see how this can happen. But now a moderate to light session with a planned RPE of 4 to 5 and 70 minutes long turns into a 7 RPE session that’s 85 minutes long. This leaves players gassed, pissed, and unable to fully recover for the important match.

Despite these challenges, I believe there are many positive reasons to use RPE measurements as part of a team’s sport science on a budget.

Practical Applications

For coaches who want to start using RPE data, my most important advice is to be clear with your coaching staff about how this can help with major issues.

The first step is to get the coaches to buy-in to how RPE data can improve their system and help improve results for the team and the players. In my brief meeting with the technical staff before the season started, my message was a bit over their heads, which diminished the emphasis on the data’s importance. Imagine a coach hearing jargon like rate of perceived exertion. They’ll instantly check out.

A team’s health, wellness, and preparedness rely on the intensity of loads during training. Share on X

Instead, focus on the idea that the team’s health, wellness, and preparedness for the season relies massively on intensity during training. When they understand that we want to use the RPE to measure intensity and keep track of players, they will listen more intently. Next, with the cooperation and authority of the whole coaching staff, you can set up a system to make the players responsible for this measure.

Please note, players also need to understand how this helps them. This is where your trust as a sport scientist is truly tested. In my situation, I focused on asking only a little from them and giving back a lot. My message to the players was very clear: My goal was to keep them healthy throughout the season and keep them as fresh as possible for matches.

In return, I asked the players for three measures (all of them free of cost):

  • Weigh in/Weigh out daily (hydration monitoring)
  • Google Form Wellness Questionnaires biweekly (wellness monitoring)
  • RPE Collection (training load monitoring)

Even though my coaches and players understood the principles behind the model, I also enlisted the older veterans (“locker room guys”) to get involved. I’m lucky that I have authority over all player monitoring; if players don’t fill out the RPE sheet, I charge a monetary fine.

When I switched from collecting the data myself to having the players self-report their numbers, I gave them direct instructions to keep their number unbiased by not comparing their numbers to the rest of the team. I also knew this would be close to impossible.

Figure 4. RPE (1-10). Excel form used by my players to report their values. With this data in hand, I immediately punch the players’ values into my computer.
PLAYER MON TUES WED THURS FRI SAT SUN
Player 1
Player 2
Player 3
Player 4
Player 5

Figure 5. RPE (1-10) form with all values listed for each player and the average for the team. I use these to develop training loads for the players and the team.
PLAYER MON TUES WED THURS FRI SAT SUN AVG
Player 1 8.5 9 4 2 9 2 5.75
Player 2 7.5 8 4 3 2 8 5.42
Player 3 6.5 4 8 3 8 2 5.25
Player 4 7 5 2 4 10 2 5
TEAM AVG 7.38 6.5 4.5 3 7.25 3.5 5.35

Now I had values for each player individually as well as a team value for a normal training week. Next, I factored in the training time (volume) to come up with player training load values and team training load values.

Figure 6a. Training Load.
DAY TRAINING VOLUME (MIN) AVG DAILY RPE TRAINING LOAD
MONDAY 105 7.38 774.38
TUESDAY 0 0
WEDNESDAY 70 6.5 455
THURSDAY 100 4.5 450
FRIDAY 80 3 240
SATURDAY 90 7.25

652.5
SUNDAY 45 3.5 157.5
WEEKLY TOTALS 490 5.35 2729.38
WEEKLY AVG 70 5.35 389.91

Training Load
Figure 6b. Both charts show the training loads planned for the week. I give them to the coaches so they can easily visualize the information and see any trends. (These show made-up training volumes.)

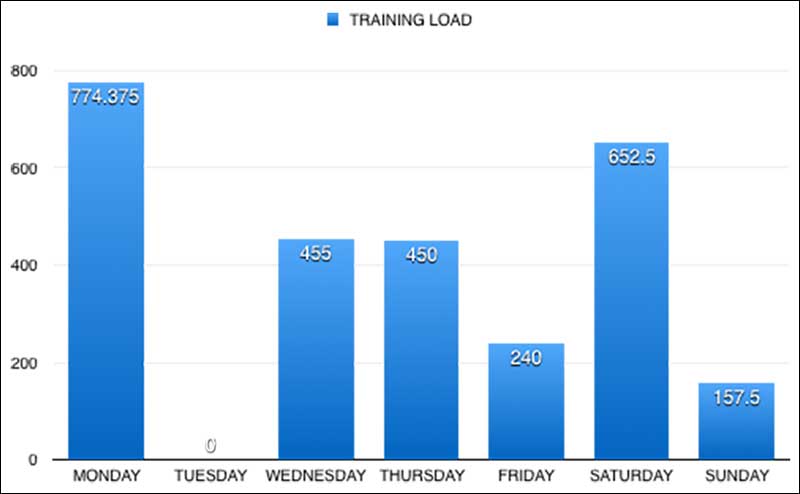
The charts are my way to get visual data into the coaches’ hands and strike up conversations with them. The charts also give the sports scientist an opportunity to point out a trend and continue the education process. The graphics help coaches to know, understand, and see what the data values represent and their importance to the team’s performance. You must be able to communicate this information clearly or don’t use it at all.

Conclusion

Using RPE is an easy and harmless way to gather important information. If you want to monitor training load, collecting RPE can be used along with minutes on the training pitch or in the gym to create a dual point measure using an external load with an internal load. Beyond that, you can look for trends of fatigue in individual players and talk to them.

When deciding to collect RPE’s from your players, first and foremost you must be able to communicate your reasoning to the players and coaches. Next, you must implement a system that can be kept up consistently for the year. Only then will you be able to use this process to organize training sessions and make decisions based on the data you receive.

References

  1. Borg, G.A. (1982). “Psychophysical Bases of Perceived Exertion.” Medicine and Science in Sports and Exercise, 14(5), 377-381.
  2. Impellizzeri, F.M., E. Rampinini, A.J. Coutts, A. Sassi, and S.M. Marcora (2004). “Use of RPE-Based Training Load in Soccer.” Medicine and Science in Sports and Exercise, 36(6), 1042-1047.

Since you’re here…
…we have a small favor to ask. More people are reading SimpliFaster than ever, and each week we bring you compelling content from coaches, sport scientists, and physiotherapists who are devoted to building better athletes. Please take a moment to share the articles on social media, engage the authors with questions and comments below, and link to articles when appropriate if you have a blog or participate on forums of related topics. — SF

Running Gait Analysis

Understanding Gait Analysis in Sport

Freelap Friday Five| ByBruce Williams

Running Gait Analysis

Dr. Bruce Williams practices at the forefront of biomechanical evaluation and treatment of foot, ankle, and lower extremity conditions. For over two decades, he has harnessed the power of cutting-edge medical technologies, such as pressure mapping, to identify and treat high-pressure areas in the feet. Many patients seek Dr. Williams because he uses digital video and kinematic shoe analysis to identify and treat poor body alignment and function. He also uses digital foot scanning to specially design hyper-customized foot orthotics for shoes, providing a tremendous leap forward in the fight against lower extremity pain.

Freelap USA: The pelvis plays a role in transmitting forces and influencing recovery mechanics for lower extremity and foot function. Many therapists and coaches think foot strengthening, like core and hip training, will correct foot and ankle function. Can you explain the independent relationships seen in a foot strike (ground up) that must be considered when evaluating performance and injuries? How do anatomical structure and function interact, and what are some issues that can’t be modified easily with exercises?

Dr. Williams: There is no question that the hip and pelvic musculature, along with the core, can have a positive influence on lower extremity and foot function. Unfortunately, this only works about 50% of the time. When hip and core strengthening exercises do not deliver, the foot is usually to blame. Foot function and structure are often not understood well. Structure is just that—boney structure that cannot change without injury or surgery.

For example, if an athlete has a long first metatarsal that’s flexible in its dorsiflexion motion, there will be minimal pressures under the 1st metatarsal head and higher pressures underneath the great toe. The lack of stiffness in this part of the foot combined with the metatarsal’s length can lead to a functional restriction of the 1st metatarsal joint’s (MPJ) motion, called functional hallux limitus.

While the 1st MPJ’s range of motion may be good to excellent (dorsiflexion greater than 65 degrees), the joint will not properly dorsiflex if something is not done to assist the 1st MPJ to plantarflex at the proper time in the athlete’s gait cycle.

The athlete can try to strengthen the peroneus longus musculature and even the foot’s intrinsic muscles to potentially raise the arch of the foot. But if these don’t show a regular, repeatable increase in the pressures under the 1st MPJ, the problem will persist.

The literature shows that strengthening exercises can increase the cross-sectional area in small muscles, but no study has shown regular improvement in the pressures under the 1st MPJ with prolonged activity (running 3-5 miles). I’m not against strengthening exercises. I just want proof that it works the way therapists and coaches want it to. Until then, I’ll stick with what does work.

Often the only way to alleviate this functional and structural issue is to tape the foot or use a custom or customized foot orthotic. Testing with pressure mapping has shown regular benefits and improvement in the pressures sub 1st MPJ by taping and orthotic modification.

Freelap USA: Many coaches and athletes are uncomfortable with orthotics and don’t consider shoe design a factor in injuries. Barefoot running has calmed down since injury patterns like stress fractures have forced a moderation of approach. Can you share how cleat design and surfaces can increase various injuries in football and soccer?

Dr. Williams: I’ve written a chapter for an upcoming book specifically about this subject and US Football. The surface area of cleats has a huge influence on knee, ankle, and foot injuries. It’s now common to see multiple athletes injured and out for the season, or most of it, because of non-contact injuries from pre-season training and games.

Shoe stiffness greatly effects pivoting motions for players and can keep the best off the field. Share on X

The type of cleats used can have a huge effect on pivoting motions for receivers and defensive backs. This can lead to torque at the knee and ankle that can end a season or a career. Plantar placement of cleats, for example, and the segmental rigidity of shoes can influence the pressures under the 5th metatarsal.

Soccer Running
Image 1. Research on different surfaces is hard to decipher since each cleat pattern, shoe type, foot function, and player load will cloud the data. Every athlete should be individually profiled to rate risk patterns.

Most professional athletes have a significant restriction in their ankle dorsiflexion range of motion which causes the heel of the foot to rise early and for a prolonged time. This increases the opportunity for cleats to stop foot rotation in relation to the knee and ankle and increase pressures under the fifth metatarsal, leading to huge risks.

This year, a video showed a player’s Achilles tendon rupturing as he battled another player while blocking. You could see his shoes dig into the turf and the unfortunate rotation of his foot to his leg and how this increased his risk of injury. Shoe stiffness and cleats are big barriers to keeping the best players on the field. It is unfortunate that the NFL is not doing more to look into this scientifically.

Freelap USA: You have a special evaluation system to connect very complicated joint systems to pressure mapping. Can you tell us how one can learn to evaluate the foot and ankle complex, ranging from simple things a coach can do to more sophisticated actions physical therapists and podiatrists can take?

Dr. Williams: It’s imperative to complete a comprehensive foot and ankle evaluation when using and interpreting pressure mapping data output. The foot and ankle have very specific functional and structural segments that contribute to overall foot function during gait.

Foot Pressure Map
Image 2. The pressure profiles of ground contact are illustrated with regional area charts like the ones above. Forefoot and rear foot measures are useful and require the correct technology and education.

If you don’t have this basic evaluation data, then you won’t be able to fully appreciate what pressure mapping data means and how best to improve upon foot and ankle function. It’s one thing to notice a high-pressure area of the foot with pressure mapping; it’s something entirely different to understand the foot’s underlying function and know why and when that high-pressure area occurs.

Foot and Ankle Analysis
Image 3. Clinical evaluation of the foot and ankle require very detail-oriented medical professionals who can accurately extract foot function and foot structure data.

My evaluation system is the Mercury XML. It’s a segmental foot and ankle evaluation tool that will echo pressure-mapping output about 80% of the time. It is repeatable and teachable to any practitioner. It’s simple and takes about ten minutes with practice. The system is taught online via Skype or in-person and on site for universities and teams. Video tutorials are available as well.

Freelap USA: With pressure mapping, what are the differences between in-shoe pressure and some of the wearable devices like Runscribe and the IMU (inertial measuring units) tibial device? Many sports teams want wearable systems for data but don’t understand how some metrics are not actionable.

Dr. Williams: In-shoe pressure systems use sensors that fit into an athlete’s shoes. Most of these are somewhat wireless; they’re not tethered to a computer. But most of them still have cables running down the legs attached to shoe sensors and up to a belt holding a data logging system. There’s at least one new pressure mapping sensor on the market that is 100% wireless with no belts or cables. All of these systems have varying degrees of speed with which they gather data, measured in hertz. In general, the higher the hertz, the more data you can gather per second.

Running Foot Pressure Map
Image 4. Dr. Williams encourages walking analysis because these baseline measures are useful after injuries when athletes can’t jump or run. Walking analysis is easy and very convenient for teams wanting valuable information about foot function.

The number of sensels per foot sensor is also important. We all expect HDTV output in our images, but many of the newer systems don’t have the same number of sensels in their foot sensors as some older systems, so the data points are significantly fewer and less granular.

IMU devices are great for gathering positional and rotational data at different leg and foot segments. They are getting smaller all the time; most are now the size of a car key fob. Their data output is said to be within 80-90% of some of the best video capture hardware and software available in university gait analysis labs. Some, like Runscribe, can attach to the back of the shoe and provide pronation velocity and maximum pronation along with other information. These are great contributory tools for getting the most data you can about athletic movement.

While many teams are using these devices now, I think they’ll quickly realize the systems provide very little actionable data regarding foot and ankle function and how these segments affect overall athletic gait.

“Inertial measuring units combined with pressure mapping provide significantly more actionable data of foot and ankle function.”

Combined with pressure mapping, IMU’s can provide significantly more actionable data. Without pressure mapping, the data will not provide enough information to know where, what, and how to approach the roles of the foot and ankle in athletic movement.

Freelap USA: Finally, will you explain the pros and cons of 3-D printing and other orthotic fabrication processes? Many of the scanning systems used to create athletic orthotic devices skip the clinical side of the process, and this could spell disaster for an athlete.

Dr. Williams: Orthotic fabrication is a special pet peeve of mine. There are many ways to create orthotic devices. CAD/CAM systems are available in labs and for in office-creation of devices. There are many types of materials for creating orthotics with many varying densities. Startup companies are now making 3-D printing available, attempting to disrupt the traditional orthotic market.

No matter what type of manufacturing process you choose, you need to do a thorough foot and ankle exam to make sure you know the important variables to affect in the foot to improve your athlete’s problems and movement patterns. The way you take a cast or scan of the foot is also very important.

Many of the startups use still pictures of the feet, or pressure mats, (either on or off weight-bearing) as the basis for their orthotic devices. Most practitioners, PT, DPM, Chiro, and others use Plaster of Paris or foam boxes for their casts or laser scans for their images for orthotic manufacture.

Any of these are appropriate when done by an experienced practitioner who knows exactly how to position the foot to maximize the orthotics function. Ultimately, the most important element is the prescription of the device itself. Regarding ankle joint restriction and other issues, most startups only provide a foot bed with no prescription elements. The Mercury XML provides an orthotic prescription to maximize the output of the orthotic device as well as prescription elements for taping.

Since you’re here…
…we have a small favor to ask. More people are reading SimpliFaster than ever, and each week we bring you compelling content from coaches, sport scientists, and physiotherapists who are devoted to building better athletes. Please take a moment to share the articles on social media, engage the authors with questions and comments below, and link to articles when appropriate if you have a blog or participate on forums of related topics. — SF

Swift Performance SpeedMat with Female Athlete

Building Better Jumpers: Jump Testing as Training

Blog| ByJoel Smith


Swift Performance SpeedMat with Female Athlete

I’ve been training to jump higher ever since I can remember. For years, my main measurement tool was how high I could get my hand on a basketball net, then the rim, and eventually the square on the top of the backboard. In high school, running parallel to this, I began the magic of measurement via a crossbar suspended between two metal standards—an event known to many as “high jump.”

Our brains need what is known as “knowledge of result” or “KR,” as Frans Bosch often alludes to, in order to hit new levels of performance. Knowledge of result (how high did you jump/how far did you throw/how fast did you run) is what gives our subconscious mind the means to determine whether what we are doing in training is actually working. The subconscious mind often cares less in regards to many traditional cues and instructions.

Knowledge of result isn’t only numbers. It can also revolve around body positions, such as keeping the head fixed after clearing a hurdle, where the brain must self-organize a strategy for the body to work in this context.

A Jump Mat Helps Give Context to ‘Knowledge of Result’

In jumping for more than two decades, and coaching jumps for just over one decade now, I’ve realized how important it is to provide athletes with context and “knowledge of result” through a variety of means. This helps them understand how their bodies are working and adapting, not only on the conscious level, but also the subconscious one.

To this end, at age 24, I finally took a substantial leap and purchased a “Just Jump” mat. It was a significant investment for a poor graduate school student working for UPS and valet parking cars to make ends meet. (I actually thought that I could get the cost reimbursed at the time, and that I would be able to use the jump mat in tandem with the force plates at our biomechanics lab, but neither of these ended up happening.)

Contact times in jumping provide a more important ‘knowledge of result’ than height readings. Share on X

The Just Jump mat became one of my favorite tools for years to come, and all of my track athletes were tested on standing vertical jumps contrasted against the 4-jump test. We also used it quite often in the context of plyometric contacts—for the life of me, I don’t know why the plyometric function isn’t in the current system (it was in the old model). The KR that comes from contact times in jumping is, in my mind, probably more important than any sort of height reading as far as track jumpers (and jumpers of all types) are concerned.

Training With the Speed Mat

In terms of knowledge of result of testing though, there are a few areas where things can be better. It has been said (and I firmly believe it) that getting more data from doing fewer things is the optimal path leading to improved coaching intuition (as opposed to a little data on a lot of things, which just leads to confusion). This is one area where I was like a kid on Christmas morning when I started to utilize the Speed Mat in basic tests, such as the 4-jump counter-movement jumping and cadence. (It’s actually five jumps on the Speed Mat.)

Here is what I mean. The Speed Mat offers tests such as vertical jump, assessing both height and power. It has a 5-jump option that enables you to track the wave pattern of each jump. (Did the athlete get better on each jump, i.e. a reactive athlete, or did they get worse? Or were they totally erratic, such as a player who just has no plyometric ability and needs to improve direction of force off the ground?)

Although the simple output box of the Just Jump gave effective data to coaches on a rather binary level, a lack of options on the same tests (and dropping plyometric contact time) was holding it back.

Not only does the Speed Mat have great “training = testing” features such as cadence and a single jump reactive strength index (RSI), but its app-based nature also allows an evolutionary process as we advance in these training and testing ideals. Although app-based systems do require an extra step in setup, they more than make up for it by being able to offer better tracking, and evolving over time with tests and metrics.

One thing I am looking forward to seeing down the line is Bosco’s 15-jump fast and slow twitch indicator test, as described to me by Henk Kraaijenhof. It’s a thing of beauty to get on a mat for 10 seconds and instantly have a good idea what your fast-to-slow twitch percentage is, as well as all the related implications for micro- and meso-cycle constructions.

In a more real-time view, the RSI function on the Speed Mat is a great “priming” modality for any plyometric session. As Curtis Taylor mentioned on Episode 21 of the Just Fly Performance Podcast, contact times are one of the first things he looks at when starting a plyometric program in fall training. If you coach the plyometric around the constraint of contact time, you know the muscle-tendon and motor-control layout you are building is one that an athlete can build on down the line.

In acute session training, I can use the Speed Mat to help athletes understand which combination of ground contact time and height will yield the optimal outcome, and then take this movement pattern to all other plyometrics done in the session. This is a great contextual tool for any coach.

If you are familiar with Charlie Weingroff, then you know his mantra of training = rehab and rehab = training. With jump testing, I think I have a model of testing = training and training = testing.

As far as testing and data go, I agree with what I’ve learned from Carl Valle, that you are winning if you can make the training the test, and therefore engage in minimal distractions before or through the course of the workout. I think we occasionally forget that we are, in fact, coaches, and our primary mission is to train athletes and not undertake a barrage of assessments through each workout.

Jump testing with the Speed Mat provides a model of testing = training and training = testing. Share on X

In addition to excess testing taking time, it can also become a distraction from the flow-state of training, and buying into the day’s work. After decades of the coaching game, I think we can agree that athletes who are continually cued or measured after every single exercise fall into movement paradigms that don’t lead to optimal results.

So, what are some aspects of the Speed Mat that I’ve found incredibly useful in my marriage of training and measuring?

  • The alternation of power and maximal jump height options
  • Using cadence for training or a canned test system under constant constraints
  • RSI can set the tone
  • Looking at the 5-jump in the context of RSI, peak power, and jump curve progression

Mental Gains and Alternating Quantification Types

One thing I’ve begun to understand over the years is the value of not measuring everything in the exact same way, over and over. When you get so hung up on one specific type of measurement, it can become de-motivational over time, especially when particular numbers become a self-fulfilling prophecy on the athlete’s end for the day’s work. Fluid periodization is certainly important, but the mental stress of having a singular key performance indicator at the beginning of each session can become a drag.

I’ve come to realize that when I suspect that athletes will be lower than average in a given exercise with attached feedback (such as a Kaiser jumper), I’ll alter the constraints of the test, or even cover up the output readout. This is so athletes won’t get discouraged if I’m trying to keep the intensity level of the strength session lower.

In the same vein, I really like that the Speed Mat has the capability of not only measuring vertical jump height (and it does so in metrics, which is a contrast to just jump or Western vertecs) but also vertical jump power. I’ll use the SpeedMat as an alternative vertical jump test because my athletes aren’t looking at the centimeters jumped, but rather the power, which is a function of their bodyweight and height. This gives them motivation for the day, even if their output is down, and keeps that intent of the drill, which is so important for continued progress.


Video 1: The Speed Mat doesn’t measure just vertical jump height, it also measures vertical jump power. When it’s used as an alternative vertical jump test, athletes look not at the centimeters jumped, but at their jump power, which gives them motivation even if their output is down.

Cadence and the Forgotten Art of Contact Time Overload and Rhythm

If I had to explain what data I’m most fond of when it comes to various force plate and jump mat tests, I’d say that contact time tells me more about an athlete’s ability to produce force usable in sport (particularly jumps) than absolute height does. I’ve had high jumpers who tested mediocre at pretty much every test in my battery, but had the ability to land a depth jump from a 60-70cm box with ninja-like qualities and also register plyometric contact times of .16-.17 on high hurdle hop drills.

In a similar vein, I’ve always enjoyed the lateral barrier hops exercise for time. This movement requires fine coordination of muscular contraction and relaxation, as well as fast vertical stiffness against resistance. There is also a lateral component, which is important for building sprint and jump stabilizers and synergists. Pre-tensioning is a must to get a good rate over the barrier, as muscle slack is the enemy of rapid angular joint velocities in the lower limbs in conjunction with vertical stiffness (sounds like a common linear activity we all know well).

To up the ante on this particular movement, a Speed Mat set to cadence can be utilized to give instant feedback on an athlete’s rate of movement.

View this post on Instagram

A post shared by Joel Smith (@justflysports)


Video 2: The lateral barrier hops exercise requires fine coordination, fast vertical stiffness, and pretensioning. Add to this movement by using a Speed Mat set to cadence, which gives instant feedback on the athlete’s rate of movement.

RSI Can Set the Tone

The RSI is a great way to set the tone for a workout, and you can use it as a contextual tool to improve the quality of the ground contacts in the rest of the plyometric workout. What I’ve found over time is that many athletes don’t ever get the sensory and quantitative feedback to understand what it’s like to get off the ground in under .20 seconds. The use of a feedback system, such as the RSI function on the Speed Mat, is a great way to start a session in a manner that allows athletes to “refer back to the warmup” to find a sensation that they can plug into their current plyometric activity.


Video 3: The RSI function on the Speed Mat is a great “priming” modality for any plyometric session. The feedback from the Speed Mat helps athletes understand what it’s like to get off the ground fast enough to get into reactive territory.

In this regard, RSI is a massive help. It’s also a great way to assess early over-reaching, since the highest order of speed strength and the length of foot contacts in every activity is the first thing to “go” when an athlete enters into heavy training. Even in these cases, athletes can still hit good barbell numbers, to the delight of the strength coach, whether or not the motor patterning that exists in this scenario is completely optimal. As with anything, the balance here is up to the planning scheme of the coach, whether it’s planned periods of creating a negative hormonal balance to overshoot later, or training that hangs its hat completely on the finest neural quality in the short (or long) term.

What Can the 5-Jump Tell You About Your Athletes?

Compared to a singular countermovement jump, a 5-jump tells us quite a bit about the ability to display force quickly (and accurately) in the vertical plane. A 5-jump is more informative of neuromuscular fatigue, since the highest order of speed strength is the first domino to fall when an athlete starts delving into the realm of overreaching. The wave of a 5-jump test is also a great way of telling, and training, an athlete’s level of coordination and accuracy in producing rapid vertical forces. If an athlete has trouble doing it once (Single response RSI jump), chances are that they will reach that neural edge rather quickly in the course of a multi-jump test, but it does really tell you what the athlete is prepared to do.


Video 4: A 5-jump test gives a lot of information on the ability to display force quickly on the vertical plane. This includes neuromuscular fatigue, since speed strength is the first thing to go when an athlete begins overreaching.

Five Jump Test
Image 1: The wave of a 5-jump test is a great way of telling, and training, an athlete’s level of coordination and accuracy in producing rapid vertical forces.


Generally speaking, anterior-chain dominant athletes have respectable vertical jumps, but somewhat poor 5 jumps. For posterior-chain dominant folks, it’s often the opposite.

A bonus with a multi-jump test is that athletes can’t cheat the landings quite as well, either. I consider a 5 jump an RSI test with a greater accuracy requirement.

An Efficient and Beneficial Training Solution

After training jumpers for many years in track and field and team sport, and even as slam-dunk specialists, I’ve come to understand where testing and training can merge and create more efficient and beneficial training solutions. In this regard, the Speed Mat is a valuable tool, and has unlimited potential within the scope of contact mat readouts.

Since you’re here…
…we have a small favor to ask. More people are reading SimpliFaster than ever, and each week we bring you compelling content from coaches, sport scientists, and physiotherapists who are devoted to building better athletes. Please take a moment to share the articles on social media, engage the authors with questions and comments below, and link to articles when appropriate if you have a blog or participate on forums of related topics. — SF


Weight Room

Communication Is the Holy Grail: Training Insights From the Shop Floor

Blog| ByChris Gallagher

Weight Room

Just the other day, I had some really awesome coaching experiences with athletes that had little to do with the kilograms lifted, the meters run, or the physiology of training.

I have been coaching for a few years now, but in terms of communicating with athletes—really getting underneath the hood and understanding what makes them tick—and getting the best out of the person and the athlete, I am still learning. In this respect, I will probably always be learning.

I frequently see and read about the work of coaches like Brett Bartholomew and Bryan Mann, who talk about the need to connect with the individual. We all know athletes are not unfeeling robots, or just numbers on a spreadsheet. But you only get better at this aspect of coaching by experiencing more situations that challenge you to coach the person, and not just churn out programs and generic cues.

Don’t Take Away the Fun

The first big conversation was with a racket sport player about his competition schedule. We discussed whether he was over-competing and was, as a result, underprepared in comparison with his rivals. I had computed a load of data and research, and drawn up comparisons with his direct rivals, his own previous schedules this year, and his performances in seasons past. I highlighted every little aspect that supported the reason I thought my opinion was the correct one.

Over the course of the conversation, I was enlightened to a very significant point: A point that is sometimes too easy to lose sight of. As a strength and conditioning coach looking at the optimal way to plan training and competition for the greatest chance of success, I look solely at the science and application of this information and data.

Squash Athlete
Image 1: My first conversation was with a racket sport player about his competition schedule. While I was worried that he was undertraining because he was going to too many competitions, he was looking forward to the tournaments because they were fun for him. Coaches need to realize that many athletes train for a sport because they find it fun.

When I spoke to the athlete about why he had entered certain tournaments at that point in the season, when I would have recommended traveling less and staying home to train more, he told me that he wanted to enter these competitions because he had played in that country before and had fond memories of the fun that he had. Athletes training for their sport because they like to compete and have fun. Who’d have thought it?!

Coaches need to remember that athletes train for sport because they like to compete & it’s fun. Share on X

I still think my strategy for the coming seasons is more valid, more viable, and more appropriate for delivering success. My view on the over-competing issue hasn’t changed. But I had been so wrapped up in helping this athlete achieve success that I had forgotten why he plays his sport in the first place: Because it’s fun.

He is driven, he is motivated, and he is successful. He really wants success. And if I deliver information on the best way to achieve this, then he is smart enough to listen and follow it. It’s good to take a step back sometimes and remember why any athlete gets involved in their sport and continues to play it. If we take them to a place where it isn’t fun anymore, then they will eventually stop competing.

Help Athletes Understand Changes to Training

The second conversation I had was with a track and field athlete. She had been training in track and field for a number of years but, in terms of training in a high-performance program, this is Season One.

Talking to her, it was clear that she was struggling to get her head around new ways of training. The training is now more focused, more structured, and consistent but progressive. She needed to know why things are done a certain way and why she can’t train the way she used to.

I thought she might be frustrated that, with the change in the way things were done, there was currently less consistency in the motor output. This is basic Motor Learning theory, right? Her performances are going to be less stable as we change from old bad habits to newer, and hopefully more-efficient, performances. This is obvious to me and the coaches reading this. But it’s a strange and uncomfortable place to be for an athlete who had been used to “success” and achieving that success a certain way.

Highjump Athlete
Image 2: My second conversation was with a track & field athlete whose training had changed from what she was used to. She was struggling with both the mental and physical challenges of the new high-performance program, and needed to reach a greater understanding of the reasons behind the change.

Year One of a high-performance program is going to be as much of a mental as a physical challenge for her. Her questions were about whether this is the way in which other elite athletes train. The short answer is “yes.” While there will be differences in the nuts and bolts of the program, the fundamental philosophies, structures, and patterns will have a lot in common.

Initially, the conversation was somewhat challenging, but I think it proved beneficial for both of us. Sometimes it is good to be challenged or questioned, with the athlete searching for answers and a greater understanding of the “why” behind the “what.” It made me really think about what she is doing and where she is going, and the small part I play in that.

Connect With Athletes as Individuals

These two conversations gave me a good opportunity to make a deeper connection with the athletes involved. They helped me understand each one’s individual motivations as an athlete, and what makes them tick as a person.

These are the real moments in coaching. The moments when you get to connect with people, educate athletes, and, hopefully, give them a greater understanding of where they are going, what they are doing, and why.

Since you’re here…
…we have a small favor to ask. More people are reading SimpliFaster than ever, and each week we bring you compelling content from coaches, sport scientists, and physiotherapists who are devoted to building better athletes. Please take a moment to share the articles on social media, engage the authors with questions and comments below, and link to articles when appropriate if you have a blog or participate on forums of related topics. — SF

Eccentric Training with Barbell

How to Incorporate Eccentric Training

Blog| ByDominique Stasulli

Eccentric Training with Barbell

Eccentric training is an undervalued component of many resistance training programs and can significantly increase an athlete’s strength and responsiveness in many sports. By following the simple guidelines below for various techniques, a coach can safely incorporate eccentric movements into any program design and reap the benefits.

The Science

Every action that requires a part of the body to move in space is made of concentric and/or eccentric muscle contractions.

When muscles contract and produce a force that exceeds the force applied to the muscles, the muscles shorten in a concentric contraction. The movements are usually powerful, like when weight is squatted up from the lowest position to the top of the movement. Or when weight is bench pressed from the chest to full arm extension. The quadriceps and the pectoral muscle groups, respectively, are the primary concentric movers.

When a muscle lengthens while under an external force that exceeds the force of the contraction, the muscle fibers elongate in an eccentric contraction. Eccentric movements oppose their concentric counterparts. When the weight during a squat or bench press is returned to the starting position, the muscles contract eccentrically.

Eccentric actions produce 20-60% greater force than concentric actions. And lower levels of neural activity occur, leading to a high force-to-neural activation ratio. Eccentric movements have the potential to increase both concentric and eccentric strength and hypertrophy; their slower, less technical nature develop the strength and hypertrophic elements of muscle fiber rather than neural development.

In every sport involving running, jumping, and throwing, eccentric movements provide critical force to the stretch-shortening cycle. In the long jump, for example, jumpers plant their foot before the fault line, causing an eccentric lengthening of their leg’s extensor muscles immediately before a forceful concentric takeoff into the sand pit. The muscles’ quickest maximal (eccentric) stretch leads to the greatest increase in concentric force on takeoff. Unfortunately specific exercises to improve eccentric contractions are often neglected in resistance training programs.

A muscle’s quickest maximal (eccentric) stretch leads to the greatest increase in concentric force. Share on X

Research shows that eccentric overload training with supramaximal loads of 100-120% of an athlete’s one-rep maximum develops maximal strength better than concentric-only training. It’s likely that muscle hypertrophy is induced when muscles are subjected to greater tension under a load where one can perform more volume without excessive fatigue; the energetic cost of the eccentric activity is lower than concentric activity.

I’d like to emphasize the importance of recovery here. Although metabolic cost is low, eccentric activity places more stress and strain on the muscles’ contractile elements, causing greater muscle damage. Upper limb muscles are even more susceptible to damage because of the shape of the individual muscle fibers. Eccentric exercise targets Type II (slow-twitch) fibers more than Type I, which also contributes to muscle damage.

Methods to Incorporate Eccentrics

There are four common techniques for incorporating eccentric exercise into a resistance training program.

  1. The 2/1 technique: An athlete lifts a weight concentrically with two limbs and lowers the weight eccentrically with one limb, making the load twice as heavy for the eccentric movement. For strength development, perform sets of 3-5 reps per limb with a 60-second rest interval.
  2. The two-movement technique: This is appropriate for experienced athletes since they must combine a compound, multi-joint exercise with an isolation exercise. For example, an athlete performs a power clean followed by a 5-second reverse curl. Or they do a close-grip bench press followed by a 5-second triceps extension. They should perform 4 to 5 sets of 5 reps with 1 to 2 minutes rest between sets.
  3. The slow/superslow technique: The athlete exaggerates the length of the eccentric phase. When loads are a lighter percent of the one-rep max, this phase should last 10 to 12 seconds. Higher percentages call for 4 to 5 seconds.
  4. The negative/supramax technique: An athlete only performs the eccentric movement of an exercise, so it’s necessary to have at least one spotter. Standard protocol calls for one repetition at a load of 110-130% of the concentric 1-RM for 8-10 seconds. Perform heavier loads for less time. The athlete can do 3 to 10 sets of single reps. This technique is more demanding than the others and should be incorporated conservatively.

Reference

Mike, J., C.M Kerksick, and L. Kravitz (2015). “How to Incorporate Eccentric Training Into a Resistance Training Program.” Strength and Conditioning Journal, 37(1), 5-17. doi:10.1519/SSC.0000000000000114.

Since you’re here…
…we have a small favor to ask. More people are reading SimpliFaster than ever, and each week we bring you compelling content from coaches, sport scientists, and physiotherapists who are devoted to building better athletes. Please take a moment to share the articles on social media, engage the authors with questions and comments below, and link to articles when appropriate if you have a blog or participate on forums of related topics. — SF

Boxer Training with Bag

Detraining: The Loss of Training-Induced Adaptations in the Short Term

Blog| ByCarmen Bott

Boxer Training with Bag

The reality in the world of high performance strength & conditioning is that athletes will face interruptions in their training at some point or another. In some cases, injuries occur. Some are very minor and training can resume as planned with some modifications. Other times, medical interventions are necessary followed by complete rest of varied durations.

It is also worth mentioning that athletes also voice their worries over losing their physiological adaptations when coaches employ periods of active rest or tapers. For both the strength & conditioning coach and the athlete, it is important to have a general understanding of what happens to an athlete’s ‘physiology’ during a short-term period of detraining. It is important to understand the potential effects and understand the mechanisms of any changes in physiological capacity.

This brief article categorizes ‘Detraining’ as part of the Principle of Reversibility. This principle is broadly defined by stopping or markedly reducing physical training leading to an induction and a partial or complete reversal of adaptations earned from training. As mentioned previously, interruptions in training could include illness, injury, active rest cycles or other reasons.

Detraining is defined as: “the partial or complete loss of training induced anatomical, physiological or performance adaptations as a consequence of training reduction or cessation” (80). Training cessation implies a “temporary discontinuation or complete abandonment of systematic programme of physical conditioning” (80).

A taper, on the other hand is “A progressive non-linear reduction of the training load during a variable period of time, in an attempt to reduce the physiological and psychological stress of daily training and to optimize (sports) performance” (80).

Timelines Defined

Losses of training-induced adaptations differ depending on the duration of the period of insufficient training stimulus (80). A 4–week block (short-term) is the reference point for this article.

Populations Examined

It is also critical to mention, “Some detraining ‘effects’ are not the same when we compare the elite athlete with several years of training history to the previously sedentary, recently trained person who engages in activity for health-related purposes versus performance purposes.”(Bott and Mujaika, 2016).

This article discusses the process of detraining, during a 4-week period (short-term), as it pertains to each system of the body. Within each system, the article attempts to compare the “endurance-trained athlete” to the “recently trained person” – two very different populations.

Finally, it is worth mentioning that the endurance-trained athlete is defined not exclusively as an endurance athlete (marathoner, road cyclist etc), but rather an athlete who possesses a relatively high aerobic capacity. However, in the studies reviewed for this article, exact capacity values were not clearly defined.

Systems of the Body

1. The Cardiorespiratory System

Maximal Oxygen Uptake (81)

  • Shown to decline with short term (<4 weeks) training cessation in highly trained individuals with large aerobic power scores.
  • The % loss is somewhere between 4 and 14%.
  • Essentially, some studies are showing the higher trained, the bigger the decline.
  • Conversely, that of the recently trained has been shown to decline to a much lesser extent (3-6%).

Blood Volume (81)

  • Total blood volume as well as plasma volume have been shown to decline by 5-12% in endurance-trained athletes. This essentially limits End-Diastolic Volume (the phase where the heart fills up with blood – large amounts are good) and consequently the End-systolic volume (the amount of blood left in the heart after it contracts to push the blood out – small amounts are good)
  • Plasma volume can decline in the first 2 days of inactivity so this has implications for tapering.
  • In recently trained individuals there is also reduce blood volume (red cell mass and plasma) so this effect is not limited to those more trained.

Heart Rate (81)

  • As a result of the decrease in plasma volume, there is a relatively acute increase at submaximal and maximal workloads (5-10%). This is important if a coach is using heart rate as a means of monitoring intensity.
  • However, this effect is reversed when plasma volume is expanded.
  • Stabilizes after 2-3 weeks without training
  • Resting heart rate unchanged in endurance-trained individuals
  • In recently trained individuals: Resting Heart Rate and Maximum Heart Rate can revert quickly to pre-exercise levels but Submaximum HR is not affected.

Stroke Volume (81)

  • Since blood and plasma volume decreases, stroke volume follows suit and is reduced.
  • Reduction in maximal aerobic capacity shown by endurance-trained athletes.
  • After 12 – 21 days of cessation, a reduction of 10-17% has been reported along with a corresponding 12% reduction in Left ventricular end-diastolic dimension.
  • No observations have been summarized on recently trained persons.

Cardiac Output (81)

  • The increased Heart Rate values resulting from detraining does not counterbalance the decrease in stroke volume in endurance-trained athletes.
  • Thus, cardiac output is reduced substantially (8%) with 21 days without training in endurance-trained athletes.

Cardiac Dimensions and Blood Pressure (81)

  • Some researchers observed no change in such a short time.
  • Some observed a 25% decrease in Left Ventricular wall thickness and a 19.5% reduction in LV mass after only 3 weeks in endurance-trained athletes.
  • A reduction in LV mass and a higher total peripheral resistance could lead to increases in mean arterial pressure during exercise when an individual becomes detrained.
  • In recently trained individuals who trained for 8 weeks lost all positive effects on systolic blood pressure (SBP) and diastolic blood pressure (DBP). They were completely reversed.

Ventilatory Function (82)

  • A decline in maximum ventilatory volume is observed in highly trained individuals
  • This often declines parallel to VO2 max (maximal oxygen consumption)
  • There is no commentary on recently trained individuals on this characteristic

Endurance Performance (82)

  • A loss in the characteristics of cardiorespiratory fitness lead to performance impairments in endurance-trained individuals
  • Slower times to complete distances
  • Shorter exercise times to exhaustion are performance indicators
  • In recently trained individuals (6-12 weeks of training), 2 weeks of training cessation did not sufficiently reduce time to exhaustion.

2. The Metabolic System

Substrate Availability and Utilization (82)

  • In endurance-trained athletes, the increase in the respiratory exchange ratio (RER) at both submaximal and maximal exercise intensities results in a higher reliance on carbohydrate metabolism
  • Insulin sensitivity also decreases which is linked to decreased lipid mobilization during exercise
  • There is an observable reduction in GLUT-4 transporter protein content – Skeletal muscle stores glucose as glycogen and oxidizes it to produce energy. The main glucose transporter protein that mediates this uptake is GLUT4, which plays a key role in regulating whole body glucose homeostasis.
  • Also, a decrease in muscle protein lipoprotein lipase activity. Lipoprotein lipase breaks down fat in the form of triglycerides, which are carried from various organs to the blood by molecules called lipoproteins. This leads to a decrease in HDL cholesterol (the good guys) and increase in LDL cholesterol (the bad guys)
  • With respect to individuals recently trained, all values of insulin, RER and GLUT-4 go back to initial levels (pre-training levels).

Blood Lactate Kinetics (82)

  • Endurance-trained athletes have been shown to respond to a standardized submaximal swim with higher blood lactate levels after only a few days of training cessation.
  • This is accompanied by a lowered Bicarbonate level
  • LT occurs at a lower % of VO2 max
  • *Muscle’s oxidative capacity may fall as much as 50% in one week.
  • In recently-trained individuals, lactate levels did not change with cessation of exercise, even after 6 weeks of training. It is presumable that it takes several months, if not years to significantly improve lactate threshold in previously untrained individuals.

Muscle Glycogen Stores (83)

  • Negatively affected by training cessation in as little as one week due to rapid decline in glucose to glycogen conversion and rapid decrease in glycogen synthase activity.
  • No specifics on particular populations.

3. The Muscular System

Muscle Capillarization (83)

  • Declines or doesn’t change in such a short amount of time
  • In highly trained athletes, it still remains 50% higher versus sedentary controls
  • With recently trained individuals, levels still remain higher than pre-training values after 4 weeks of inactivity
  • This indicates the robustness of this adaptation.

Arterial-Venous Oxygen Difference (83)

  • Data available is sparse
  • Indicates no change in 21 days, lending support that the decline in VO2 max is likely due to central factors: decreased stroke volume.

Myoglobin Level (83)

  • In both trained and recently trained individuals, cessation did not affect myoglobin levels in such a short period of detraining.

Enzymatic Activities (84)

  • Citrate synthase (the enzyme in the first reaction of the Kreb’s cycle in aerobic metabolism) activity decreases between 25 and 45 % with short term training cessation in trained athletes.
  • Decreased muscle oxidative capacity is reflected by significant (12-27%) reductions in enzymes that facilitate ATP production in aerobic pathways (beta-hydroxyacyl CoA-dehydrogenase, malate dehydrogenase and succinate dehydrogenase)
  • Lipoprotein lipase activity in muscle tissue decreases, favoring storage of adipose tissue
  • Glycolytic enzymes decreased only slightly with the exception of glycogen synthase which decreased 42% after only 5 days
  • All of the above information pertains to trained athletes
  • For those recently trained, mitochondrial enzyme activities have been shown to decline to pre-training levels.

Muscle Fiber Characteristics (84)

  • Human skeletal muscle is highly plastic tissue and improvements in measurement techniques have allowed the human muscle to be studied in a more functional context (Harridge, 2007).
  • It is the properties of muscle which are altered by changes in physical activity (Harridge, 2007).
  • Harridge’s review discusses, specifically, the contractile machinery of the muscle and how it is sensitive to mechanical loading. Should those loads be removed for a period of time due to injury, specific fiber types will atrophy.
  • Disuse, due to detraining, has the effect of causing slow to fast transformation of muscle fiber type expression. This may lead coaches to blindly conclude this as being an ideal adaptation for speed and power.
  • What one must keep in mind is the atrophy that comes with disuse negates any benefits of slow-to-fast transition in terms of fiber function.
  • Mean fiber cross-sectional area in Type 2 fibers, can decrease in 2 weeks
  • Percentage distribution of fiber types were unaltered in recently trained individuals during 4 weeks of inactivity.

*The mechanisms of fiber transitions are beyond the scope of this article.

Strength Performance (84)

  • Strength-trained athletes showed slight, but non-significant reductions in Bench Press, Squat and Vertica Jump after 2 weeks without training
  • However, it is important to note that swimmers were not able to demonstrate same force to the water (power) after 4 weeks of inactivity.
  • In recently trained individuals, after 4 weeks of inactivity, strength was still higher than pre-training values.

4. The Endocrine System (84)

  • Decline in insulin sensitivity
  • Unaltered catecholamine levels at rest and after submaximal exercise
  • Glucagon, cortisol and Growth Hormone did not change with 5 days of inactivity in endurance athletes
  • Strength trained athletes show positive anabolic hormone changes after 14 days of inactivity, with:
    • Increased GH levels
    • Increased Testosterone levels and T:C Ratio
    • Decreased Cortisol levels

Short-term Detraining Re-Cap

  • “The partial or complete loss of a training-induced adaptation in response to an insufficient training stimulus” (85).
  • Short term is defined as less than 4 weeks of inactivity.
  • Losses depend on the training status of the subject.

Conclusions and Implications for Tapering

  • Rapid decline in VO2 max with highly trained athletes.
  • Much less in recently trained individuals.
    • Due to immediate reduction in blood volumes and reduction in stroke volume
    • Thus, endurance performance declines rapidly in trained athletes.
  • Higher reliance of CHO as a fuel source
  • Decreased muscle lipoprotein lipase activity
  • Lactate threshold lower at % of VO2 max
  • Muscle glycogen levels rapidly decline
  • Significant reduction in oxidative enzyme activities and thus reduced ATP production
  • Non-systematic changes in Glycolytic enzyme activities
  • Muscle fiber distribution remains unchanged
  • Fiber cross sectional area declines (atrophy) in strength and sprint trained athletes.
  • Strength can be maintained for up to 4 weeks of inactivity.
  • However, sport-specific power of athletes may suffer declines
  • Anabolic hormones may increase in strength-trained athletes

Works Cited

  • Harridge, Stephen D. R. (2007). Plasticity of human skeletal muscle: gene expression to in vivo function. Experimental Physiology. 92.5 783-797.
  • Mujika, I and Padilla, S. (2000). Detraining: Loss of training-induced Physiological and Performance Adaptations. Part 1. Short Term Insufficient Training Stimulus. Sports Medicine. 30 (2). 79-87.

Since you’re here…
…we have a small favor to ask. More people are reading SimpliFaster than ever, and each week we bring you compelling content from coaches, sport scientists, and physiotherapists who are devoted to building better athletes. Please take a moment to share the articles on social media, engage the authors with questions and comments below, and link to articles when appropriate if you have a blog or participate on forums of related topics. — SF

Squash Championship

What I Learned From the 2016 Men’s Squash World Championship

Blog| ByChris Gallagher

Squash Championship
Photo Credit WS Chen / Shutterstock, Inc.

Squash World Championship
Photo 1. Entrance to the tournament venue at the Wadi Degla PSA Men’s Squash World Championship 2016. Top players have sensational athletic skills.

Squash is an exceptionally tough sport where the top players exhibit phenomenal levels of athleticism, speed, power, and agility. I was fortunate to attend the 2016 Men’s Squash World Championships in Cairo, Egypt with players from the Hong Kong Sports Institute. As a strength and conditioning coach, I work with the number one ranked player at the Institute.
The head coach sent me to Egypt to experience the sport’s highest level to gain greater insight and knowledge by observing how the best players behave, prepare, and compete.


Video 1. Mathieu Castagnet dives for the ball and quickly recovers to hit a winning shot. Squash requires remarkable skills and physical abilities.

The sport has produced outstanding, talented athletes over the years including Jansher Khan, Peter Nicol, Nicol David, and the current number one in the world Mohamed El Shorbagy. Squash courts can be set up in spectacular locations for great sporting occasions—in front of the Pyramids of Giza, inside Grand Central station, and overlooking the Bund in Shanghai.

Squash Court
Photo 2. The view from the squash court at the China Open overlooking the Bund in Shanghai. Squash courts are easy to install, allowing for endless venue choices.

Squash is a Skill Game that Requires a High Fitness Level

At its core, squash is ultimately a skill game. If you don’t have technical and tactical skills, it doesn’t matter how fit you are. You can’t compete at the higher echelons of the game. This isn’t a groundbreaking concept and isn’t unique to squash. My job is to enhance the athletic capabilities of the athletes while the specialist sports coach teaches the intricacies of the sport.

A skilled player should never lose to an opponent because they lack physical fitness. Share on X

When watching elite squash players such as “Colombian Cannonball” Miguel Angel Rodriguez you understand just how important physical fitness is to the players. As I said, there comes the point when physical fitness won’t make up for a shortfall in squash skill. On the other side of the coin, a player should never lose to an opponent because they lack physical fitness.


Video 2. Rodriguez enhances his squash skills with excellent physical fitness, reinforcing how crucial strength and conditioning is to squash players.

Fitness, speed, and unbelievable reactions allowed Rodriguez to reach number four in the world, and he still resides in the top ten. Squash skill, technique, and tactics remain our training priorities. But having watched Rodriguez bounce around the court almost as fast as the squash ball reinforced how essential strength and conditioning is in modern squash.

Appropriate Training for Squash Players

It was with great surprise then that I saw some players following incredibly flawed training practices. At the hotel gym, I watched an imposing looking athlete come in for a training session in full power lifter mode. Knee sleeves, belt, weightlifting shoes. He went straight to the smith machine (granted hotel gyms are usually appallingly equipped), racked up 50kg, and grunted and groaned his way through some squats. These were working sets. On another occasion, I saw a young, up and coming potential star hitting some lunges after he exited the tournament. High rep sets of lunges with the 6kg dumbbells.

In squash training, players complete dozens if not hundreds of lunges during a week. The value of performing more high rep lunges under low load is a questionable practice to me and may only invite injury through overuse. We use lunges and single leg exercises in our players’ programs, but we tend to load them heavy to build max strength and related qualities.

Squat Rack
Photo 3. As Vern Gambetta says, “Don’t try to replicate the game in training, distort it.” Squash is still a sport where the latest knowledge and training concepts are not flowing down to all levels of the sport.

I also had the opportunity to talk to a player who used only old school bodybuilder methods and machine weights and had no real experience with free weights. We shared ideas with him, demonstrated some things, and I’m sure this will benefit his future squash training and performance.

Current knowledge & training concepts aren’t moving down to all levels of the sport of squash. Share on X

In the world of elite sports performance, we know American Football and Rugby use sports science, strength and conditioning, and modern training practices. My time in Egypt highlighted that squash is still one of many sports where the latest knowledge and training concepts are not finding their way down through all levels of the sport. The benefits of weight training and muscular strength to footballers and rugby players is clear but can still be a hard sell in other sports.

Learning Good Habits to Enhance Performance

I observed many positive things, too, while watching the stars of the game. The preparation, warm-up, and cool-down strategies of players Nick Matthew (former three-time World Champion from England) and Nicol David (the long-serving former female world number one) highlighted that longevity in elite sport is achieved only by consistent and long-term good habits.

On game day, I saw both Matthew and David in the gym going through morning stretching, mobility, and activation routines to ensure they were optimally prepared for evening competition. I suspect it’s this dedication, professionalism, and attention to detail that took them to the very peak of the sport and kept them there for so many years.

Speaking of Matthew, I was fortunate to share a bus ride with him from the hotel to the competition venue and pick his brain about squash, training, and his life in sport. We had interesting conversations about working for the EIS, British Cycling, and Shane Sutton. The most interesting story was his personal account of how his attitudes about training have changed.

Like other athletes I’ve met in squash and several other sports, Matthew has an exceptional attitude toward training. His work rate and commitment to athletic development are exemplary. So much so that he was perhaps guilty of over training at times during his career. Matthew openly admitted that he would stress out if he couldn’t train hard in the lead up to, and the day before, a competition. Between game days, he always wanted to be on the court sharpening his skills (at some tournaments, the players get days off between matches).

Unfortunately he was struck down with a knee injury going into the Commonwealth Games which prevented him from training as he normally would before the competition. Even during the week of competition, he didn’t train normally due to his knee injury and travel logistics. Matthew went on to win the Gold medal, and he realized training wasn’t everything. As Dan Pfaff would say, “training is overrated.” It took Matthew until his early 30’s and a knee injury to learn this fact.

Experienced senior athletes, especially, don’t need to train hard every day before and between competitions. Playing squash almost daily every week for many years, athletes won’t lose their touch because they don’t play the day before, or the day in between, matches.

Preparing for Major Competitions

When it comes to a major competition, athletes do all the hard work during the months and years before the competition. Once players arrive at the competition venue, they’re not going to develop new athletic abilities or greatly enhance their competition performance. Training at this late stage will likely mess up all the months and years of hard work. The analogy of “polishing the car” during the final weeks or days before the major championships is the best approach to optimize performance. You won’t add any horsepower at this late stage; you’ll only put miles on the clock that might lead to the breakdown of a vital part.

The flip side is that preparation is very individual. Athletes have their crutches. Things they need to feel, do, or experience to believe they’re fully prepared for optimal performance. The coach’s job is to mentally prepare athletes to perform their best rather than prepare them physically.

On match day, some athletes want to have a session with their coach, some want to hit by themselves. Some like to talk tactics with the coach and some like to have their space, to avoid distractions and other people, to be alone with their music and headphones. I witnessed the challenge Hong Kong coach Faheem Khan faced managing his players’ individual personalities and preferences at the World Championships.

A coach must be adaptable and empathetic to work with the different characters and needs among their athletes. Although we understand that athletes don’t need to put in any work this close to the competition, if the athlete is accustomed to and wants to put in sweat and effort on the court, we need to work with their preferences and idiosyncrasies.

Hong Kong Squash Court
Photo 4. Hong Kong’s Max Lee warms up with Gawad of Egypt for the third round encounter. Gawad went on to be crowned World Champion for the first time.

The World Championships went quite well for our guys. While I only work with one of them, I was the strength and conditioning professional from the Institute on this trip, and I helped look after all our guys in the competition. Two players in the main draw progressed to the last 16 and one more to the round of 32. They all lost to a former World Champion, the then reigning World Champion, or the player who went on to become World Champion. They gave a good account of themselves.

As to the importance of professionalism, preparation, and good habits, I was pleased to see the evidence of our athletes’ education and their dedication to their development. Even after tough losses and match finishes late in the night, it was pleasing to see our athletes leading themselves through their cool-down and recovery protocols.

The squash season is long, busy, and unforgiving. The World Championships may have ended for our guys, but the next World Series event was to begin only a couple of weeks later—the next level of competition below the World Championships that’s somewhat equivalent to the Diamond League.

Plans A, B, C, and D

When the tournament was over for our players, we still had the odd day at the end of the week in Cairo. As ever, when training away from home, you never have access to the equipment and facilities you’re used to or need. Everyone wants to undertake the most effective form of training but, for a myriad of reasons, it’s not always possible.

Coaches must be flexible, adaptable, and creative. In a hotel gym with only a handful of machines and dumbbells or a competition venue with minimal equipment and facilities for recovery and cool down, you have to make do with what is there. You have a plan A, but you also put together a plan B, C, and D if you can.

Whenever I travel with athletes, I scout out the venue, the hotel, and the local area looking for opportunities. At the China Open, the hotel facilities were appalling with unsuitable treadmills and only a bench. By exploring the local area and discussions with a local gym owner, I was able to secure access to facilities nearby.

Squash Player Lifting Weights
Photo 5. Hong Kong Squash players are hitting a gym session at the China Open. On this trip, the hotel’s workout room was abysmal, so we arranged to work out at a local gym.

I saw these quotes on social media recently, and they couldn’t be more appropriate to this idea:

  • “Having a plan is important—having a plan B maybe even more so!” – Dustin Imdieke, ALTIS
  • “Plan B isn’t making it up on the spot—it’s called “plan” B—so let’s plan for it!” – Stuart McMillan, ALTIS

Take Away Points

  1. Squash requires exceptional levels of athleticism. In a skill based sport, physical fitness won’t take you to the top, but it’s criminal to fall short of your technical and tactical potential because your physical abilities are underdeveloped.
  2. Squash, like many sports, has a long way to go regarding education (throughout all levels of the game) about how optimal athletic development should look.
  3. “Don’t try to replicate the game in training, distort it” – Vern Gambetta
  4. Professionalism, dedication, and doing the little things well are vital to sporting success and the longevity of that success.
  5. Nick Matthew’s experience supports Dan Pfaff’s assertion that “training is overrated.” Some athletes take a long time or a key incident to learn the essential or basic messages. Young athletes should listen to, and benefit from, the experiences and mistakes of their predecessors.
  6. The analogy of “polish the car” is apt for major championships. You can’t make an athlete’s tournament with training at this late stage, but you can break it.
  7. Work with the individual and their personality. During a championship, the competition’s psychological component dominates, and you must give the athlete what they need to feel strong and confident going into the competition.
  8. Education pays off when athletes are given messages repeatedly and experience the benefits of these lessons. Every interaction with an athlete is an opportunity to educate.
  9. Have a plan. But be flexible and adaptable. Have backup plans. Once on site, scouting and exploration can help inform, strengthen, and enhance any backup plans.

Since you’re here…
…we have a small favor to ask. More people are reading SimpliFaster than ever, and each week we bring you compelling content from coaches, sport scientists, and physiotherapists who are devoted to building better athletes. Please take a moment to share the articles on social media, engage the authors with questions and comments below, and link to articles when appropriate if you have a blog or participate on forums of related topics. — SF

Seaside Runner

The Art of Recovery

Blog| ByDominique Stasulli

Seaside Runner

Overload Stress

As fitness professionals and coaches, we thrive on the fact that it’s our individualized and specific overload periodization that gets our clients/athletes to their goals. We put all the science into developing their program, and they implement it with full reliance on what we have on paper.

Long-distance endurance events require long-term training plans to build up the cycles/mileage properly without wearing down the body. There has long been debate over whether it is more beneficial to train more miles per week at lower intensity or fewer miles per week at a higher intensity. The consensus is to do what works best for your athlete. Some are anatomically and physiologically less gifted than others in their ability to withstand the impact of high-mileage or high-intensity work before injury sets in.

Every athlete has an overload ceiling that continually fluctuates based on the current cycle of training. For example, during base building or recovery cycles, the body can only handle minimal amounts of stress before experiencing overtraining symptoms. In later (stronger) phases, such as strength-endurance, the body typically endures great stress for a period of up to four weeks before needing a microcycle of recovery.

Daniels’ Running Formula lists eight principles of training, which include: stress reaction, specificity, overstress, training response, personal limits, diminishing return, accelerating setbacks, and maintenance. They are all equally important to consider when developing a training program. However, from personal and professional experience, the one that truly hits home is overstress.

Prioritizing Deload Weeks

For an athlete to regularly perform quality training sessions or to peak for competition, the progression of training stimuli must incorporate an appropriate amount of de-stressing in order to reap the benefits of the applied stress. Instead of trying to force the body to adapt by loading, then overloading, and then loading on top of the overload, allow the body to repair itself on a physiological level. This will actually speed performance gains and minimize the risk of injury. We can call it: “The less is more approach.”

Daniels mentions the fact that forcing an athlete to do a workout in less than ideal conditions, or that the body is not feeling well-equipped to handle, can lead to long-term physical and psychological damage. If training can be thought of as an internal stress on the system, consideration of the external stresses on the athlete needs to be a similar priority. These external stresses can include emotional stress, financial stress, school or work stress, or even social stress from friends and family. Even with the best training progression, if these factors are ignored, an athlete can suffer from overtraining symptoms and wind up sidelined.

Coaches should be concerned with both the internal stresses on an athlete, and the external ones. Share on X

Without consideration of an athlete’s individual circumstances, levels of stress, and reactions to training, the application of a cookie-cutter training plan can have disastrous effects. Each athlete has unique strengths and weaknesses that can be targeted with appropriate programming. Every member of a team performing the same workout can have a multitude of effects, depending on the person and the variables that contribute to a training outcome.

According to Zaryski & Smith (2005), intensity is the most critical factor in overload training; however, it must be balanced effectively with frequency and duration. Unfortunately, there is not a neat formula to calculate the ideal frequency/intensity/duration combination for a given athlete. There is a correlation to the level of experience and the training load/frequency/intensity that can be tolerated, but, again, this is not linear or guaranteed. This concept is known as structural tolerance and can be greatly improved over time, within limits.

Overload is defined as the concept of progressively building the load of physiological work so that the body overcompensates and adapts after a recovery period. The length of an athlete’s season—typically described in macrocycles of 12-14 weeks—will also determine how the program is structured. The nutritional intake and hydration level of these types of endurance athletes are critical to recovery and the ability to withstand subsequent overload stimuli (Zaryski & Smith, 2005). If an athlete is struggling to handle a particular workload that was previously handled without incident, it may be time to check whether either nutritional deficiency or dehydration is the culprit.

The Art of the Taper

Just as there is the need for manipulation in the training variables to stimulate adaptation, there is a need for the same type of manipulation when reversing the trend leading up to a competitive event. In researching more about the benefits of tapering for performance, I found an article that revealed the benefits of a nonlinear taper over the traditional step-down and linear tapers for peak performance. Mujika & Padilla (2003) state that a non-linear taper maintains training intensity by gradually reducing training volume (60-90%) and training frequency (no more than 20%); improving performance by about 3%.

The linear taper drops all variables gradually and proportionally, while the step-down taper drops all variables immediately at the beginning of the taper and maintains low levels of training up until performance. Although maximum recovery may occur with these latter two methods, maximum performance suffers. The maintenance of training intensity and relative frequency is necessary to avoid detraining, but the benefits of performance are not achieved without a reduction in other variables.

McNeely and Sandler (2007) state that the research on tapering is often conflicting, considering the difficulty in replicating the psychological stress that occurs leading up to a peak performance event. Many physiological improvements develop during a taper period, including VO2 max (with a taper of less than 14 days), hemoglobin (+14%), and hematocrit (+2.6%) increases in the first seven days of a taper, all of which help improve the oxygen-carrying capacity of the body. Sport-specific muscle power and contractility seem to increase with the taper as well, possibly due to changes in neuromuscular efficiency as fatigue slowly dissipates.

The idea is that, with reduced volume of training, strength-power mechanisms of adaptation are allowed to take shape. They are normally inhibited by the competing aerobic development that occurs during high-volume training. The peak of strength and power in muscle contraction is typically considered ideal for racing to peak performance.

The date of target competition will also designate when tapering (reduction of volume) needs to occur. The length of the taper will vary depending on the distance of the race, but it typically lasts from one to four weeks (Hug et al., 2014). A successful tapering phase leads to peak performance on competition day; this can be enhanced by preceding the taper with several weeks of overload training (up to a 50% increase), while maintaining intensity all the way through race day.

The physiological response to overload stress causes a high activation of the cardiac autonomic system, specifically the parasympathetic nervous system for the purpose of restoration and recovery. As the taper progresses and no new overload is introduced, the parasympathetic response decreases and the sympathetic tone returns to a balance. This has been indicated as a marker of improved race-readiness and performance.

Periodization, recovery, and tapering are each truly an artistic entity that requires individualized attention for each unique athlete, based on their ability and circumstances. To achieve long-term success without the hindrance of overuse injuries, the recovery phase should be emphasized as much as the build-up progressions.

Since you’re here…
…we have a small favor to ask. More people are reading SimpliFaster than ever, and each week we bring you compelling content from coaches, sport scientists, and physiotherapists who are devoted to building better athletes. Please take a moment to share the articles on social media, engage the authors with questions and comments below, and link to articles when appropriate if you have a blog or participate on forums of related topics. — SF

References

  • Daniels, J. T. (2014). Daniels’ Running Formula (3rd ed.). Champaign, IL: Human Kinetics.
  • Hug, B., Heyer, L., Naef, N., Buchheit, M., Wehrlin, J. P., & Millet, G. P. (2014). “Tapering for marathon and cardiac autonomic function.” International Journal of Sports Medicine, 35: 676-683.
  • McNeely, E. & Sandler, D. (2007). “Tapering for endurance athletes.” Strength & Conditioning Journal, 29(5): 18-24.
  • Mujiika, I. & Padilla, S. (2003). “Scientific bases for precompetition tapering strategies.” Medicine and Science in Sport and Exercise, 35(7): 1182-1187.
  • Zaryski, C. & Smith, D. J. (2005). “Training principles and issues for ultra-endurance athletes.” Current Sports Medicine Reports, 4: 163-170.
Fast Food Sandwich

Fast Food vs. Sport Supplements for Post-Exercise Glycogen Recovery

Blog| ByDominique Stasulli

Fast Food Sandwich

In recent years, the sports supplement industry has swelled. New products on the market claim to be better concentrated to deliver the greatest performance enhancement or post-workout recovery results over any natural food product. In contrast, with the rising tide of obesity in America, fast food has gotten a bad rap for being supremely concentrated with nutrient-scarce filler substances that lead to metabolic disturbances and increase the risk of heart disease later in life.

It seems unlikely that high-level athletes would opt for fast food over supplements to fuel their ever-repairing bodies, especially with the low-quality stigma attached to these dietary options. To assess this speculation, Cramer et al. (2015), tested the efficacy of carbohydrate replenishment in a randomized control trial comparing fast food and sports supplements post-workout. Their hypothesis presumed that common fast food items can provide adequate macronutrient replenishment equal to that of sports supplements.

The results agreed with the hypothesis: The rates of glycogen recovery were similar. No statistically significant difference in performance showed in the subsequent 20-kilometer time trial between groups, either.

The Details of the Study

The study involved 11 recreationally active men split into two groups: One received carbohydrate replenishment via fast food, and the other via sports supplements. Each had matching macronutrient ratios. Both groups were subjected to a 90-minute glycogen-depleting cycle ride, followed by a muscle biopsy of the vastus lateralis and a four-hour recovery period in which post-workout feeding took place at zero and two hours.

After the four-hour recovery period, the subjects took part in a 20km cycle time trial. Subsequent muscle biopsies were taken from each subject for analysis of their glycogen status. There was no statistical difference between the groups on any of the measured parameters, including muscle glycogen recovery, muscle glycogen concentration post-exercise, blood glucose, insulin, and blood lipid levels.

This study was well-designed, but lacked a strong sample size to warrant the best evidentiary support. There were surveys given to each of the participants to check for satiety levels in regards to zero- and two-hour post-workout feedings. The sports supplement group admittedly felt more full after the sports supplement feed at two hours, but otherwise expressed no feelings of discomfort or sickness from consuming either the fast food or the sports supplements.

The study was supported by previous research. Evidence from that showed that immediate glycogen replenishment post-workout can improve recovery by 45%, and a subsequent feed at two hours post-workout further enhances the storage process. The greatest concern would surround the “regulation” of dietary intake in the 24 hours prior to testing. The participants were told to track their daily intake and then repeat that diet the day before the second trial (seven days later), in order to mimic glycogen content going into the test. Undoubtedly, this can result in widely differing muscle glycogen content if the macronutrients were not fixed and standardized for the pre-test protocol. The study lacked standardization in this regard, but overall it was well methodized.

Innumerable research supports the correlation between fast food consumption and dyslipidemia, cardiovascular risk, and the obesity epidemic. However, there has been minimal research conducted on the acute effects of this food intake in healthy and active individuals. This type of study would be dangerous in the hands of the media, which could blow the data widely out of proportion. The population tested consisted of recreationally active men, and thus cannot be globalized to fit sedentary populations, high-level athletes, or even women. A longitudinal study is needed to determine the long-term effects of these dietary choices before fast food is given the green light for healthy, active populations.

This does not mean we shouldn’t challenge the idealized use of sports supplements as opposed to natural food sources, which may achieve the same effect with less artificial processing. Professional athletes will not likely adopt this habit any time soon; especially without valid and reliable evidence that fast food is healthy enough to support performance and training recovery in the elite world, where glycogen processing and efficiency reach an entirely new level.

Since you’re here…
…we have a small favor to ask. More people are reading SimpliFaster than ever, and each week we bring you compelling content from coaches, sport scientists, and physiotherapists who are devoted to building better athletes. Please take a moment to share the articles on social media, engage the authors with questions and comments below, and link to articles when appropriate if you have a blog or participate on forums of related topics. — SF

Reference

Cramer, M. J., Dumke, C. L., Hailes, W. S., Cuddy, J. S. & Ruby, B. C. (2015). “Postexercise glycogen recovery and exercise performance is not significantly different between fast food and sport supplements.” International Journal of Sport Nutrition and Exercise Metabolism, 25, 448-455.

Running Shoe Wearable

RunScribe Instructions for CSV File Export

Blog| ByTim Clark

Running Shoe Wearable

Editor’s Note: RunScribe Pro are small wearable devices that attach to a runner’s shoes and collect data such as stride pace, contact time, pronation velocity, horizontal braking, impact force, and other metrics. Given the large storage capacity of this wearable technology, RunScribe can store these metrics for every step of an extended workout or run. The RunScribe dashboard is primarily designed to provide feedback to distance runners, but it is possible to extract all the data into a CSV (Comma Separated Values) file for other types of activities and analysis. For example, tech savvy coaches could use RunScribe to collect metrics for sprints, hurdles, jumps, vaults, and other skilled and non-skilled events. The set of instructions below show how to export the data from the RunScribe devices to a CSV file that can be imported into Excel or Google Docs for further analysis. — SF

1. Contact RunScribe technical support and request that your account be upgraded to download CSV Run files.

2. Download the Runscribe app from the Apple app store or Google Play.

3. Follow app instructions to add a RunScribe device and select Left/Right foot and Heel or Laces mounting. If collecting data on multiple athletes with multiple RunScribe devices, rename each Runscribe with the athlete’s name/foot. The RunScribe name will be visible when viewing data online.

4. Take note of the last 4 digits of each scribe’s serial number, athlete name, and foot.

  • Serial
  • Number
  • Name Foot

5. Attach RunScribe devices to the shoes, ensure that they are tightly mounted for data accuracy, and go for a run. The RunScribe devices will automatically start recording when running is detected, and stop after a few minutes of no motion.

6. When finished, open the RunScribe app and click the sync button in the top right corner (internet connection required). Wait for the sync to complete.

7. To view data, go to the RunScribe Dashboard and log in. Runs are automatically named by the date of the run. Click on the date of the run you would like to download.

8. For accurate stride pace and stride length, the run must be calibrated by typing the total distance run (from a GPS watch or measured course) in to the box below.

RunScribe Dashboard
Figure 1. Calibrate the data by entering the total distance run.

9. To download data, click on the download symbol (highlighted in red below) on the top right of the page.

RunScribe CSV Menu
Figure 2. Select the download icon in the RunScribe Dashboard.

RunScribe CSV File Export
Figure 3. A menu will drop down with an option to download each individual file, described by foot and mounting location (i.e. Left/Heel, Right/Laces). Choose “Export CSV”, not “Download Fit File.”

As you click on each file to download, you will have the option to choose the file name. The default name is the Run number and scribe serial number (i.e. 46230-F97E6BC1.csv). It may be helpful to change the name from the scribe serial number to the athlete’s name and foot (such as Josh-RightLaces-Sep29.csv).

10. Open the run file in a spreadsheet application such as Microsoft Excel. The data is saved so that each row is a single footstep, and each column is a different metric. The metrics of the downloaded file are in the units given in the table below.

Column Metric Unit/Explanation
A Timestamp RunScribe Specific. To access time in minutes, type this formula =(A3-A2)/60000+Q2 into cell Q3 and drag the formula down for the entire run
B Step Number
C Stride Length Meters († calibration required)
D Stride Pace Meters/second († calibration required)
E Cycle Time Milliseconds
F Contact Time Milliseconds
G Max Pronation Velocity Degrees/second
H Pronation Excursion FS-MP This is the pronation from foot strike to maximum pronation. Units are degrees
I Pronation Excursion FS-MP This is the pronation from maximum pronation to toe off. Units are degrees
J Stance Excursion FS-MP This is the change in foot pitch from foot strike to maximum pronation. Units are degrees
K Stance Excursion FS-MP This is the change in foot pitch from maximum pronation to toe off. Units are degrees
L Braking Gs Horizontal Impact, measured in Gs (1G = 9.81 m/s2)
M Impact Gs Vertical Impact, measured in Gs (1G = 9.81 m/s2)
N Foot strike to maximum pronation time Milliseconds
O Foot strike type Foot strike type as defined by RunScribe algorithm. Range of 1-16, where 1 is large Heel strike and 16 is large forefoot strike.

† For calibration, see step 8.

Since you’re here…
…we have a small favor to ask. More people are reading SimpliFaster than ever, and each week we bring you compelling content from coaches, sport scientists, and physiotherapists who are devoted to building better athletes. Please take a moment to share the articles on social media, engage the authors with questions and comments below, and link to articles when appropriate if you have a blog or participate on forums of related topics. — SF

Team Sport GPS

The Use of GPS Technology in Team Sports

Blog| ByDominique Stasulli

Team Sport GPS

Since its first application to field and team sports in 2006, global positioning system (GPS) technology has been used to detect fatigue in matches, compare intensity profiles according to player position, compare competition skill levels, and identify the most intense periods of play.1 GPS is most commonly used and studied in the Australian Football League (AFL) but is gradually infiltrating such other sports as rugby, soccer, hockey, and American football.

With GPS data, coaches can design physical conditioning and plan appropriate recovery time following intense work according to the demands of each player’s position. As the technology continues to develop, it will become more useful for court-based sports, will help coaches determine appropriate training loads, improve recovery, and decrease injuries.

Quantifying Game Demands: Football

In contact sports like football, coaches using GPS can read real-time tackle and impact information instead of, or in addition to, time-consuming video analysis.2 A study by Wellman et al. (2016)6 examined the use of GPS and accelerometry with thirty-three NCAA Division I football players during their twelve regular season games. The researchers wanted to determine and quantify the differences in the demands of player positions during competitive games.

They found that wide receivers and defensive backs executed significantly greater total distance covered, high-intensity running, sprint distance, and intense acceleration and deceleration efforts compared to other offensive and defensive players.

Linebackers and defensive backs essentially covered the same total moderate- and high-intensity distance. Defensive backs, however, displayed significantly more sprint, maximal acceleration, and maximal deceleration efforts than any other defensive position.

Coaches can use this information to design physical conditioning specific to each player’s position and plan appropriate recovery after intense work.

Coaches can use GPS information to design position-specific physical conditioning & recovery time. Share on X

A similar study of AFL athletes found a substantial 11% decline in exertion per minute from a game’s first quarter to the fourth quarter, showing accumulated fatigue late in the game.7 During the four-year study, researchers tracked a significant increase in player demands. Mean velocity and intensity increased by 8-14%, possibly because of league rule changes made to increase the game’s overall speed.

Quantifying Game Demands: Soccer

There are few studies on GPS in soccer competitions because the International Federation of Football Association (IFFA) prohibits GPS use. A European study found that wide midfielders experienced the highest physiological demands in a match and center backs had the lowest.5 Wide midfielders and second strikers, the players with greater overall running performance, displayed a higher effort index (which shows mean speed on cardiovascular stress as measured with a heart rate monitor).

In elite soccer, GPS data showed maximal accelerations occurred six times as often as sprints, bringing into question the current belief that repeated sprint ability is essential to team sports.1 The data also showed clear differences in the players’ running performance when a game is tied or a team is behind or ahead of their opponent.1

GPS data can indicate player exhaustion and team fitness. Share on X

GPS can also track game fatigue by showing the difference between the highest running intensities during first and last fifteen minutes of the game. The differences can indicate player exhaustion and team fitness.2

Maximal Training Load: Injury and Illness

More studies need to be done to measure the maximum training load that athletes can sustain before increasing the possibility of injuries.2 Researchers have found that a spike in training load preceded 42% of illnesses and 40% of injuries.1

Maximal Training Load: Children

Load is especially important to monitor in youth athletes since they possess inherent differences in physiology, biomechanics, and metabolism.2 Unlike adults, children have smaller energy reserves between submaximal and maximal exercise; any given running speed is metabolically more expensive for a child than an adult. Many factors influence this including lower running economy (shorter legs = greater stride frequency, shorter stride length), less efficient mechanics (higher ground impact/braking forces, greater vertical “bounce”), and weak co-contraction of antagonistic muscles because the muscles are underdeveloped.

Since all movement is more costly and demanding for young athletes, their training must be adjusted accordingly. Using GPS can help monitor loads and intensities placed on kids in training to reflect their age and skill level accurately and decrease injuries.

Court-Based Sports

GPS technology has yet to be refined for court-based sports requiring rapid but confined movement patterns and continuous direction changes like tennis and basketball.4 A study by Duffield et al. (2010) sought to determine the accuracy and reliability of GPS devices for these types of sports. The technology was compared directly against a VICON motion analysis system. VICON is considered an accurate and reliable, although time-consuming, method of athlete tracking and analysis.

The GPS accuracy was measured at both 1 Hz and 5 Hz trials while the VICON output was 100 Hz. Both GPS trials showed the technology underreported distance, with error ranging from 2-25% depending on distance and speed. It also underestimated peak and mean speed, ranging from 10% to 30% during court-based movement drills.

There is clear evidence that the higher the movement velocity, the lower reliability of the GPS reading.1 Reliability should improve in the future as satellite communication and tracking becomes more precise. Cummins, Orr, and O’Connor (2013) found that increasing a device’s sampling rate from 1-Hz or 5-Hz to 10-Hz improved the GPS’ reliability during constant velocity as well as accelerating and decelerating movements.

We’ll need higher resolution technology before GPS can become mainstream in court-based sports.

Future Direction

During the next decade, we should see a miniaturization of devices, extension of battery life, and integration of other sensor data, including improvements in accelerometry heart rate, to help better quantify athletes’ efforts.1 Integrated technology refers to the combined use of GPS, heart rate, and accelerometry for a greater understanding of the metabolic cost and specificity of movement patterns.3

This integrated information will supply coaches with tactical data for play design as well as physiological data for fitness programming.1 Integrated data will also help coaches simulate competition demands in practice plays with appropriate intensities to avoid overloading their athletes.

Future researchers also may explore biophysical effects in pre- and post-game conditions, such as the effect of supplements on performance, core temperature changes, indirect calorimetry (to accurately measure calorie burn), and hormone responses to training and competition.3 With this information, coaches and athletes may be able to improve plans for recovery and subsequent training sessions.

References

  1. Aughey, R. J. (2011). “Applications of GPS Technologies to Field Sports.” International Journal of Sports Physiology and Performance, 6(3), 295-310. doi:10.1123/ijspp.6.3.295.
  2. Cummins, C., R. Orr, H. O’Connor, and C. West (2013). “Global Positioning Systems (GPS) and Microtechnology Sensors in Team Sports: A Systematic Review.” Sports Medicine, 43(10), 1025-1042. doi:10.1007/s40279-013-0069-2.
  3. Dellaserra, C. L., Y. Gao, and L. Ransdell (2014). “Use of Integrated Technology in Team Sports: A Review of Opportunities, Challenges, and Future Directions for Athletes.” Journal of Strength and Conditioning Research, 28(2), 556-573. doi:10.1519/JSC.0b013e3182a952fb.
  4. Duffield, R., M. Reid, J. Baker, and W. Spratford (2010). “Accuracy and Reliability of GPS Devices for Measurement of Movement Patterns in Confined Spaces for Court-Based Sports.” Journal of Science and Medicine in Sport, (13), 523-525. doi:10.1016/j.jsams.2009.07.003.
  5. Torreño, N., D. Munguia-Izquierdo, A. Coutts, E. Sáez de Villarreal, J. Asian-Clemente, and L. Suarez-Arrones (2016). “Relationship Between External and Internal Loads of Professional Soccer Players During Full Matches in Official Games Using Global Positioning Systems and Heart-Rate Technology.” International Journal of Sports Physiology and Performance, 11(7), 940-946. doi: 10.1123/ijspp.2015-0252.
  6. Wellman, A. D., S. C. Coad, G. C. Goulet, and C. P. McLellan (2016). “Quantification of Competitive Game Demands of NCAA Division I College Football Players Using Global Positioning Systems.” Journal of Strength and Conditioning Research, 30(1), 11-19. doi:10.1519/JSC.0000000000001206.
  7. Wisbey, B., P. G. Montgomery, D. B. Pyne, and B. Rattray (2010). “Quantifying Movement Demands of AFL Football Using GPS Tracking.” Journal of Science and Medicine in Sport, 13(5), 531-536. doi:10.1016/j.jsams.2009.09.002.
Hamstring Diagram

A Review of the NordBord Hamstring Testing System

Blog| ByRyan Cotter

Hamstring Diagram

What Is the NordBord?

The NordBord Hamstring Testing System is a fast and easy way to objectively measure eccentric and isometric hamstring strength. The NordBord is the brainchild of Vald Performance, a company based in Brisbane, Australia. Vald Performance is unique, in that the company was born out of a research group at Queensland University of Technology (specifically, Dr. Anthony Shield and Dr. David Opar). I believe that the company’s academic- and research-based origins have helped make a product that is not only easy to use, but also comes with evidence-based guidelines that help drive best practices.

The NordBord Hardware

The NordBord itself measures about 3 feet long and 2 feet wide, most of which is a large padded area for the athlete to kneel on. The pad has “integrated knee position guides” that allow for easy readings of the athlete’s knee position and help with maintaining consistency in knee position from one test to the next (important when calculating torque). Once kneeling, the athlete slips their ankles into the padded ankle hooks and can then perform many different testing protocols (described in more detail later).

Nordbord Ankle Hooks
Image 1: The NordBord measures approximately 3 feet by 2 feet, with much of its surface covered by a pad for athletes to kneel on. Positioning is easy, with athletes slipping their ankles into the padded, ergonomic ankle hooks.

The ankle hooks themselves are connected to two force cells that measure the force (in Newtons) at which the ankle hooks are being pulled. The force measured by the two force cells is transmitted in real time to a host computer/tablet via a USB cable.

Nordboard Underside
Image 2: The ankle hooks are connected under the Nordbord to two force cells, which measure the force (in Newtons) at which the ankle hooks are being pulled. This data then gets transmitted to a computer or tablet via a USB cable.

Nordbord Sideview
Image 3: Side view of the Nordbord, showing the USB cable connecting the host computer to the force cells under the unit. Note also the wheels on the “arms” of the Nordbord, which enable this to be easily moved.

Nordbord Hamstring Curl
Image 4: An athlete performing a Nordic Hamstring Curl. Most of NordBord’s research on hamstring strength as it relates to hamstring injuries focuses on eccentric strength displayed during this exercise. Therefore, the peak and average forces produced by an athlete during three consecutive Nordic Curls is the most useful of the data measured by the NordBord.

After 9 months of use and over 400 tests performed, the NordBord operates just like the first time. Share on X

The NordBord itself is simple and very durable. After nine months of use and over 400 tests performed, it looks and operates just like it did the first time I used it. The two steel arms that make up the base of the NordBord have wheels, making it easy to move around the weight room or to different buildings. It can be easily deconstructed by loosening four screws to separate part of the base arms from the pad. The ankle hooks also can be unscrewed for easier travel. That being said, it definitely isn’t something that is convenient to travel with. It still would need its own bag and someone to carry that bag (but if you have the manpower, anything can be done).

The Scorebord and the Dashbord

The software provided with the NordBord has two separate platforms, the “Scorebord” and the “Dashbord.” The Scorebord gives the practitioner and the athlete real-time feedback on how much force is being recorded by the force cells for both the right and left limbs, as well as the percent discrepancy between the two. You can also view the previous test scores or the average of multiple previous test scores on this screen. The real-time feedback and the previous scores are great for giving athletes something to shoot for and it increases competitiveness if you use it in a team environment. This can be enhanced by projecting the Scorebord onto a large screen, as shown below.

Nordbord Software Platform
Image 5: Both of the NordBord’s software platforms, the app-based Scorebord and the cloud-based Dashbord, can be projected onto a large screen. This makes it possible for multiple people to view the data at the same time.

The Dashbord is a cloud-based data storage platform. You can access player data on the computer with the Vald Performance software installed, and also through a web browser on any other device. One of the key features of the Dashbord is the ability to compare athlete scores as text or in a simple bar graph. The most useful feature is the ability to export data in Excel or .csv formats.

Vald Performance Dashboard
Image 6: The Dashbord screen, accessible through a computer with the NordBord’s software installed or through a web browser. One of its key features is the ability to compare athlete scores in text or simple bar graph format.

You can group tests by player, position, team, or test date, which makes for very easy data analysis on the back end. The exported data includes the raw scores for all of the tests selected, as well as other basic statistics for the selected population such as average, first quartile, and standard deviation for all tests included. All of this data can be exported in bar graphs and line graphs that show the force-time relationship of each rep. This all makes for even easier analysis and data visualization.

Nordbord CSV File Export
Image 7: An example of a force-time curve created from NordBord data and produced in the Dashbord. This can be exported into an Excel or .csv file.

Nordbord Excel File
Image 8: Screenshot of the summary data for a group of athletes exported into an Excel file. Basic statistics are provided at the top, and more detailed information is grouped below by each individual athlete/test.

The Metrics Gathered by the NordBord

The vast majority of the research on hamstring strength as it relates to hamstring injuries (HSIs) done by the NordBord research group (Shields, Opar, Timmins, etc.) focuses on eccentric strength displayed during a Nordic Hamstring Curl. Therefore, it seems that the peak and average forces an athlete is able to produce during three consecutive Nordic Curls is the most useful of the data measured by the NordBord (1, 2, 4).

After strength, the between limb strength asymmetry displayed by the athlete is a metric of secondary importance (1). However, the software allows for the practitioner to select between a number of different hamstring exercises, including the Razor Curl; a 30-degree, 60-degree, and prone isometric hold; and any custom protocols developed by the practitioner. Outside of peak and average forces produced, the software also provides peak and average toque.

Using the Data

Currently, we use the data to customize the volume, frequency, and mode of eccentric hamstring work that our athletes do. After an initial four-week block when every athlete does Nordic hamstring curls two times a week, we then test the athletes on the NordBord. It is worth noting that athletes tend to be very sore the following few days after testing on the NordBord, so an initial acclimation period where the athletes perform Nordic Curls regularly for a few weeks is advised. Our four-week acclimation block is as follows (each performed 2x/week):

  1. Week 1 – 2×3
  2. Week 2 – 3×3
  3. Week 3 – 3×4
  4. Week 4 – 3×5

After the initial acclimation block, we test all of our athletes on the NordBord using the three Nordic Curls protocol, and then make adjustments to their training based on the results.

Based on the current literature regarding eccentric hamstring strength and limb asymmetry, we look for our athletes to be able to produce >340 N of force in both limbs, with a between limb strength asymmetry of <15% (1,2). After testing, we put the athletes in one of three interventions based on their results.

Intervention 1 is for athletes who can produce >340 N of average force in both limbs and have a between limb asymmetry of <15%. These athletes will perform Razor curls (a more intense eccentric hamstring exercise) 1x/week. While these athletes can produce sufficient levels of force that statistically puts them at a reduced risk for injury (2), there is still value in having them continue to perform eccentric contractions on a regular basis to maintain the structural adaptations of increased hamstring fascicle length (4). Research suggests that these structural adaptations can dissipate in as few as four weeks following the cessation of eccentric hamstring training (4).

If the athlete displays an ability to produce >340 N of force in both limbs, but has a between limb strength discrepancy >15%, then they will perform band-assisted, unilateral Nordic Curls 1x/week. They will perform a greater amount of volume on the weaker leg (usually four sets compared to two) in order to try to bring up the strength levels of the weaker leg to that of the stronger one.

Band-Assisted Nordic Curl
Image 9: An athlete performs a band-assisted, unilateral Nordic Curl. The band allows the athlete to work the more distal portion of the hamstrings while in a position of increased knee extension.

If the athlete is not able to produce >340 N of force in either limb, then they will continue with regular bilateral Nordic Curls 1x/week and band-assisted bilateral Nordic Curls 1x/week. The band allows for the athlete to get into a position of increased knee extension and work the more distal portion of the hamstrings in that position.

Outside of using the data as a means to measure strength progress, the data can also be useful for return to play (RTP) protocols for athletes that experience a HSI. We currently require the athlete to be at 90% of their pre-injury strength values before they are able to fully participate in practice. Other markers go into this decision as well, but the NordBord provides useful, objective strength measures that ultimately help the medical staff in making RTP decisions.

The NordBord’s Value

In my opinion, the NordBord is the best available tool to quickly and easily assess eccentric hamstring strength, but it is by no means inexpensive. While Vald Performance offers different pricing structures to different clients, you can expect to pay around $5,000/year for the hardware, software, and support. The support is top shelf, and includes access to some of the leading researchers in the world when it comes to training to reduce the risk of hamstring injuries. If you can afford it, I don’t think there is a better option on the market.

The NordBord is the best available tool to quickly and easily assess eccentric hamstring strength. Share on X

However, the NordBord is still a luxury tool, and is by no means a necessity. Nordic Hamstring Curls work. If your athletes are compliant in terms of giving their best effort with the exercise, and the exercises are performed on a regular basis (minimum 1x/week), the athletes will get stronger. For example, our soccer players improved their eccentric hamstring strength by an average of 45 N in-season by performing Nordics only 1x/week (and never more than 15 total reps/session).

In the off-season, we have seen lacrosse players improve eccentric hamstring strength by more than 100 N in eight weeks by simply following the protocol outlined earlier in this article. However, the NordBord provides data that gives the practitioner objective feedback on exactly how strong the athletes are (which is useful for RTP protocols), as well as otherwise unobtainable more-nuanced information such as between limb strength discrepancies.

It’s the Best on the Market

If you are involved in a sport where HSIs are a primary concern (i.e., track athletes and most field-based sports), the NordBord provides objective, detailed, and actionable data to drive your programming. If you can afford the cost, there is nothing on the market better than the NordBord.

Since you’re here…
…we have a small favor to ask. More people are reading SimpliFaster than ever, and each week we bring you compelling content from coaches, sport scientists, and physiotherapists who are devoted to building better athletes. Please take a moment to share the articles on social media, engage the authors with questions and comments below, and link to articles when appropriate if you have a blog or participate on forums of related topics. — SF

References

  1. Bourne M. N., D. A. Opar, M. D. Williams, et al. (2015). “Eccentric Knee-flexor Strength and Hamstring Injury Risk in Rugby Union: A prospective study.” Am J Sports Med, 43: 2663-70.
  2. Opar, D. A., M. D. Williams, R. G. TIimmins, J. Hickey, S. J. Duhig, and A. J. Shield. (2015). “Eccentric Hamstring Strength and Hamstring Injury Risk in Australian Footballers.” Med. Sci. Sports Exerc., 47(4): 857-865.
  3. Timmins, R. G., J. D. Ruddy, J. Presland, N. Maniar, A. J. Shield, M. D. Williams, and D. A. Opar. (2016). “Architectural Changes of the Biceps Femoris Long Head after Concentric or Eccentric Training.” Med. Sci. Sports Exerc., 48(3): 499-508.
  4. Timmins R. G., M.N. Bourne, A. J. Shield, M. D. Williams, C. Lorenzen, D. A. Opar. “Short Biceps Femoris Fascicles and Eccentric Knee Flexor Weakness Increase the Risk of Hamstring Injury in Elite Football (Soccer): A Prospective Cohort Study.” Br J Sports Med Published Online First: doi:10.1136/bjsports-2015-095362.
  • « Go to Previous Page
  • Page 1
  • Interim pages omitted …
  • Page 152
  • Page 153
  • Page 154
  • Page 155
  • Page 156
  • Interim pages omitted …
  • Page 164
  • Go to Next Page »

Primary Sidebar

Latest Posts

  • The Six Absolutes of Perfect Technique
  • Building a Better High Jump: A Review of Stride Patterns
  • How We Got Our First Sprint Relays to State in Program History

Topics

  • Changing with the Game
  • form and technique
  • Game On Series
  • Getting Started
  • high jump
  • Misconceptions Series
  • Out of My Lane Series
  • Rapid Fire
  • Resistance training
  • Summer School with Dan Mullins
  • The Croc Show
  • track and field
  • What I've Added/What I've Dropped Series

Categories

  • Blog
  • Buyer's Guide
  • Freelap Friday Five
  • Podcasts

COMPANY

  • Contact Us
  • Write for SimpliFaster
  • Affiliate Program
  • Terms of Use
  • SimpliFaster Privacy Policy
  • DMCA Policy
  • Return and Refund Policy
  • Disclaimer

Coaches Resources

  • Shop Online
  • SimpliFaster Blog
  • Buyer’s Guide
  • Freelap Friday Five
  • Coaches Job Listing

CONTACT INFORMATION

13100 Tech City Circle Suite 200

Alachua, FL 32615

(925) 461-5990 (office)

(925) 461-5991 (fax)

(800) 634-5990 (toll free in US)

Logo of BuyBoard Purchasing Cooperative. The word Buy is yellow and shaped like a shopping cart, while Board and Purchasing Cooperative are in blue text.
  • Facebook
  • Instagram
  • Twitter
  • YouTube

SIGNUP FOR NEWSLETTER

Loading

Copyright © 2025 SimpliFaster. All Rights Reserved.