The RPE scale (rate of perceived effort) is a common tool used to assess training intensity in individuals as well as teams. RPE values give a reference point for an individual’s internal load which can be compared with others during a similar session. A team’s sport scientist and coaches can take this data to plan sessions with specific intensities and manipulate training loads to fit into microcyles. When working on a budget in a team setting, there are benefits and challenges when using RPE scales.
RPE: Training Intensity and Variety
The use of the RPE scale is growing in popularity in team sports because the data collection is easy and it accurately assesses the internal load placed on an athlete during a training session. When I started serving as Head Athletic Trainer and Director of Sports Science for the Wilmington Hammerheads, I had played eight years in the lower leagues of professional soccer.
In lower division professional athletics, coaches and players constantly play an ominous guessing game when it comes to training load. As a player, I experienced two distinct problems with training.
First, players either were training too little or too much depending on their role on the team. Starters who played every minute of every game were asked to perform the same training intensity as players who missed games and were fresh for every training session. Reserve players buzzed in training but were blowing wind and coming up short against the demands of a league match.
Players often felt stuck between a rock and a hard place. God forbid, they told the coach they were unfit in games as a reserve player or, even worse, felt “leggy” during a session on Monday morning.
Second, coaches didn’t vary training. I remember some seasons as a player when I prayed for two games in a week for one simple reason—training monotony. With certain coaches, I knew we were doomed in the five-day training week between Saturday games. We would spend ninety minutes each day training at the same intensity all week. My teammates and I learned why the older veterans pressed cruise control during the week and why the younger, hungry players were smoked by match time on Saturday.
Using the hi/lo model dating back to Charlie Francis in 80’s, it’s easy to vanquish training monotony by increasing or decreasing the planned RPE for a weekly microcycle. Hence, in my new role with the Hammerheads, I was determined to monitor training load (volume x intensity) with objective (training time) and subjective (session RPE) data.
The RPE data helps plan the year, month, week, and daily training for the team and the individual players. Oh, and it cost nothing, which is another huge plus when a team has a limited budget. In theory, conducting this system seems like a no-brainer in my role as Director of Sports Science. As you know, theory is always best explored during experimentation, so expect road blocks when collecting RPE data in a team setting.
What is RPE?
RPE is a way to measure one’s subjective physical intensity. An athlete will describe the physical exertion by giving their effort a number value. There are a variety of scales used to determine an RPE score with numbers ranging from low to high. The low value correlates with easy effort, and the high number value correlates with extremely hard effort.
The Borg Rating of Perceived Exertion is a common RPE scale designed to give a value closely linked to a person’s heart rate. The scale ranges from 6 to 20. Six means no exertion at all and 20 means maximum exertion. Knowing that this scale correlates to an individual’s heart rate helps explain why the scale starts at 6. The number is simply multiplied by 10 to estimate what heart rate is reached during the time the person is asked to give a score.
| # | Level of Exertion |
| 6 | No exertion at all |
| 7 | |
| 7.5 | Extremely light (7.5) |
| 8 | |
| 9 | Very light |
| 10 | |
| 11 | Light |
| 12 | |
| 13 | Somewhat hard |
| 14 | |
| 15 | Hard (heavy) |
| 16 | |
| 17 | Very hard |
| 18 | |
| 19 | Extremely hard |
| 20 | Maximal exertion |
Here are some guidelines for using the Borg scale:
- Nine corresponds to very light exercise. For healthy people, it’s like walking slowly for some minutes.
- Thirteen is somewhat hard exercise, but it still feels OK to continue.
- Seventeen, very hard, is very strenuous. A healthy person can keep moving, but they have to push themselves. It feels very heavy, and the person is very tired.
- Nineteen corresponds to extremely strenuous exercise. For most people, this is the most strenuous exercise they’ve ever experienced.
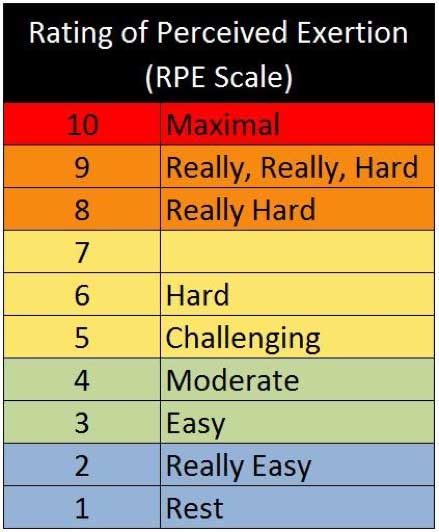
In my practice, I chose an even easier RPE scale of 1 to 10. One represents just standing, and 10 is the hardest game the athlete ever played.

I find that this is an easier number for our coaches and players to understand while correlating it with Banisters model (training load in minutes X by session RPE= ___arbitrary units). For example, an individual’s training session lasting 60 minutes with their subjective RPE score of 7 would look like 60 x 7= 420 arbitrary units.
Why is RPE Important?
Rating training intensity is a very subjective measure. You can visit a local park to see the discrepancies. Look at a game of pick-up basketball, and you may notice each player has a different level of internal pain.
Imagine a shirtless, 6’3”, former D1 player making the game look easy as he blows past the middle-aged dude with the headband profusely sweating and sucking wind. Although you may not witness a scene as clear cut as this example, you get the point. No two people feel the same exercise the same way.
RPE is also important when planning sessions. We know the basic training variables to increase or decrease load using the FIT principle (frequency, intensity, and time). The amount of intensity is the major factor when deciding how each and every exercise will look. Frankly, this is the common difference between matches and training.
Think about a time you and your significant other walked two miles on the beach and chatted about life. Now think about the gut wrenching feeling you had in high school or college when coach told you to perform the Cooper’s Test (a two-mile test). The work done is the same, but the intensity changes everything. One leaves you relaxed and ready to eat dinner and the other leaves you upchucking behind the bleachers.
Once again an extreme example, but it shows what a big difference intensity plays on a session. In simpler terms, one can go longer when intensity (RPE) is lower and only last a fraction of the time when the intensity is high.
Does RPE Monitoring Enhance Decision-Making?
Although we can get as many data values that we want, everything comes down to this one all-encompassing question: Why? In our case, we have an eight-month season with eight pre-season competitions and thirty to thirty-five matches all over the United States. It’s crucial we have an objective measure to help us make decisions.
Our coaching staff’s major decisions revolve around when to work and when to rest. My job as Athletic Trainer/ Director of Sport Science was on the line when it came to a decision between work and rest.
In terms of work, I had to ensure our team was ready to handle the increasingly high demands of match fitness. I also greatly appreciated the notion of rest simply so our players could adapt to the stresses placed on them. Otherwise our treatment table could become overbooked.
I believe that the concept of rest is the most misunderstood and abused concept in team sports, especially soccer. Using RPE’s and monitoring training load can help coaches to understand the importance of rest.
RPE’s and the monitoring of training load help coaches understand the importance of rest. Share on XWhen we look at session RPE data for individuals, clear trends become noticeable. This can be a life saver by opening up conversations among the coaching staff and players. At the very least, when something out of the ordinary occurs, the return on investment from data collection will provide rewards when it sparks conversations.
As mentioned, data collection also helps coaches plan correctly. When prescribing a specific training load, the coaching staff targets a specific intensity level to match the adaptations they want to occur. This helps hit the intended weekly team training load in a calculable way and avoid the dangerous “too little” or “too much” scenarios.
You can take this one step further and create a realistic training plan to progressively increase training load from week to week and keep the levels of progression safe at about a 10% increase.
Before an athlete ever stepped foot onto our team, we made decisions about how we wanted our pre-season training to play out regarding volumes and intensities based on the RPE data. After the first day, however, I quickly learned we still had issues with the practical implementation.
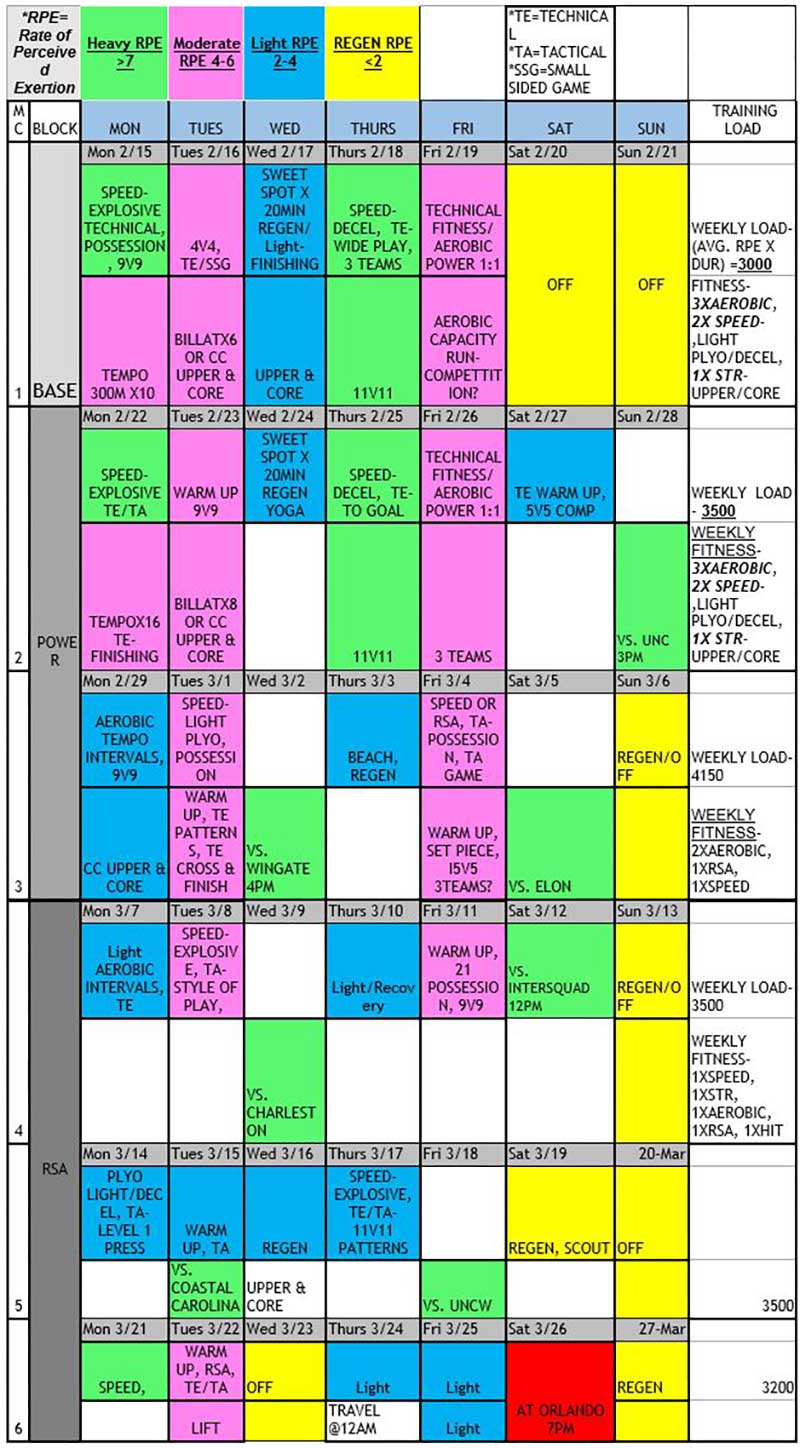
Below is an example of how our technical staff used session RPEs in our pre-season mesocycle. It shows a slow progression of increased training load and, in theory, increased team fitness.

Challenges with RPE Collection and Implementation
I was the only one gathering, monitoring, implementing, and analyzing data, and it didn’t take long to encounter problems with collecting a simple number value from each player. Please keep in mind that I was also the Head Athletic Trainer in charge of treatment/rehabilitation, immediate evaluation and care of players, on top of practice preparation, warm up, in-practice second assistant coach duties, and cool down.
My initial plan was to troll the players at the end of each session for an unbiased RPE value that was not tainted by their teammates’ answers. I carried a clipboard with the RPE 1-10 chart to remind players what the numbers meant and silently asked each player to rate their number. I did this immediately after training to get their true exertion assessments.
I soon realized this was an unfathomable task on top of the ten other duties I had. Determined to keep the process in place, I had the players fill out the form upon entering the locker room after training. I emphasized that their scores should not be affected by their teammates. The accuracy of the data was tainted right away, but we continued to keep this plan in place throughout the season.
Next, issues started to arise with practice plans. When making a session longer due to low-intensity work or RPE, you risk a coach’s on-the-fly decision to increase the intensity intended. For example, a routine Thursday training session with a tactical and technical emphasis before a Saturday match ends up taking longer because the team doesn’t perform well. The coach demands they work even longer and harder to get things right and until he’s satisfied.
It’s easy to see how this can happen. But now a moderate to light session with a planned RPE of 4 to 5 and 70 minutes long turns into a 7 RPE session that’s 85 minutes long. This leaves players gassed, pissed, and unable to fully recover for the important match.
Despite these challenges, I believe there are many positive reasons to use RPE measurements as part of a team’s sport science on a budget.
Practical Applications
For coaches who want to start using RPE data, my most important advice is to be clear with your coaching staff about how this can help with major issues.
The first step is to get the coaches to buy-in to how RPE data can improve their system and help improve results for the team and the players. In my brief meeting with the technical staff before the season started, my message was a bit over their heads, which diminished the emphasis on the data’s importance. Imagine a coach hearing jargon like rate of perceived exertion. They’ll instantly check out.
A team’s health, wellness, and preparedness rely on the intensity of loads during training. Share on XInstead, focus on the idea that the team’s health, wellness, and preparedness for the season relies massively on intensity during training. When they understand that we want to use the RPE to measure intensity and keep track of players, they will listen more intently. Next, with the cooperation and authority of the whole coaching staff, you can set up a system to make the players responsible for this measure.
Please note, players also need to understand how this helps them. This is where your trust as a sport scientist is truly tested. In my situation, I focused on asking only a little from them and giving back a lot. My message to the players was very clear: My goal was to keep them healthy throughout the season and keep them as fresh as possible for matches.
In return, I asked the players for three measures (all of them free of cost):
- Weigh in/Weigh out daily (hydration monitoring)
- Google Form Wellness Questionnaires biweekly (wellness monitoring)
- RPE Collection (training load monitoring)
Even though my coaches and players understood the principles behind the model, I also enlisted the older veterans (“locker room guys”) to get involved. I’m lucky that I have authority over all player monitoring; if players don’t fill out the RPE sheet, I charge a monetary fine.
When I switched from collecting the data myself to having the players self-report their numbers, I gave them direct instructions to keep their number unbiased by not comparing their numbers to the rest of the team. I also knew this would be close to impossible.
| PLAYER | MON | TUES | WED | THURS | FRI | SAT | SUN |
| Player 1 | |||||||
| Player 2 | |||||||
| Player 3 | |||||||
| Player 4 | |||||||
| Player 5 |
| PLAYER | MON | TUES | WED | THURS | FRI | SAT | SUN | AVG |
| Player 1 | 8.5 | 9 | 4 | 2 | 9 | 2 | 5.75 | |
| Player 2 | 7.5 | 8 | 4 | 3 | 2 | 8 | 5.42 | |
| Player 3 | 6.5 | 4 | 8 | 3 | 8 | 2 | 5.25 | |
| Player 4 | 7 | 5 | 2 | 4 | 10 | 2 | 5 | |
| TEAM AVG | 7.38 | 6.5 | 4.5 | 3 | 7.25 | 3.5 | 5.35 |
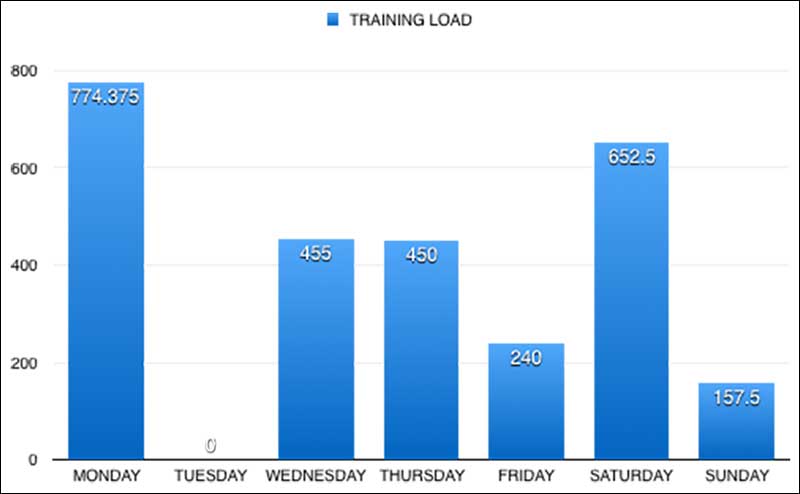
Now I had values for each player individually as well as a team value for a normal training week. Next, I factored in the training time (volume) to come up with player training load values and team training load values.
| DAY | TRAINING VOLUME (MIN) | AVG DAILY RPE | TRAINING LOAD |
| MONDAY | 105 | 7.38 | 774.38 |
| TUESDAY | 0 | 0 | |
| WEDNESDAY | 70 | 6.5 | 455 |
| THURSDAY | 100 | 4.5 | 450 |
| FRIDAY | 80 | 3 | 240 |
| SATURDAY | 90 | 7.25 | 652.5 |
| SUNDAY | 45 | 3.5 | 157.5 |
| WEEKLY TOTALS | 490 | 5.35 | 2729.38 |
| WEEKLY AVG | 70 | 5.35 | 389.91 |

The charts are my way to get visual data into the coaches’ hands and strike up conversations with them. The charts also give the sports scientist an opportunity to point out a trend and continue the education process. The graphics help coaches to know, understand, and see what the data values represent and their importance to the team’s performance. You must be able to communicate this information clearly or don’t use it at all.
Conclusion
Using RPE is an easy and harmless way to gather important information. If you want to monitor training load, collecting RPE can be used along with minutes on the training pitch or in the gym to create a dual point measure using an external load with an internal load. Beyond that, you can look for trends of fatigue in individual players and talk to them.
When deciding to collect RPE’s from your players, first and foremost you must be able to communicate your reasoning to the players and coaches. Next, you must implement a system that can be kept up consistently for the year. Only then will you be able to use this process to organize training sessions and make decisions based on the data you receive.
References
- Borg, G.A. (1982). “Psychophysical Bases of Perceived Exertion.” Medicine and Science in Sports and Exercise, 14(5), 377-381.
- Impellizzeri, F.M., E. Rampinini, A.J. Coutts, A. Sassi, and S.M. Marcora (2004). “Use of RPE-Based Training Load in Soccer.” Medicine and Science in Sports and Exercise, 36(6), 1042-1047.
Since you’re here…
…we have a small favor to ask. More people are reading SimpliFaster than ever, and each week we bring you compelling content from coaches, sport scientists, and physiotherapists who are devoted to building better athletes. Please take a moment to share the articles on social media, engage the authors with questions and comments below, and link to articles when appropriate if you have a blog or participate on forums of related topics. — SF


Excellent writeup! I’m learning about RPE for the first time and this is a great introduction.
How to calculate TRAINING VOLUME (MIN) ?
In terms of Periodization, how do you increase the duration and intensity of a weekly training load?
Excellent writeup! I’m learning about RPE for the first time and this is a great introduction. Thanks for sharing this article.
Hi, Excellent content, RPE to Workload detail explained. Thank you