Blog
With over 1,700 articles written by 300+ coaches, scientists, and performance experts, the SimpliFaster blog is your go-to resource for smarter training. Performance professionals share real-world insights, data-driven methods, and practical tools to allow you to stay current and sharpen your approach.
Our articles help you think deeper and coach smarter.
Featured
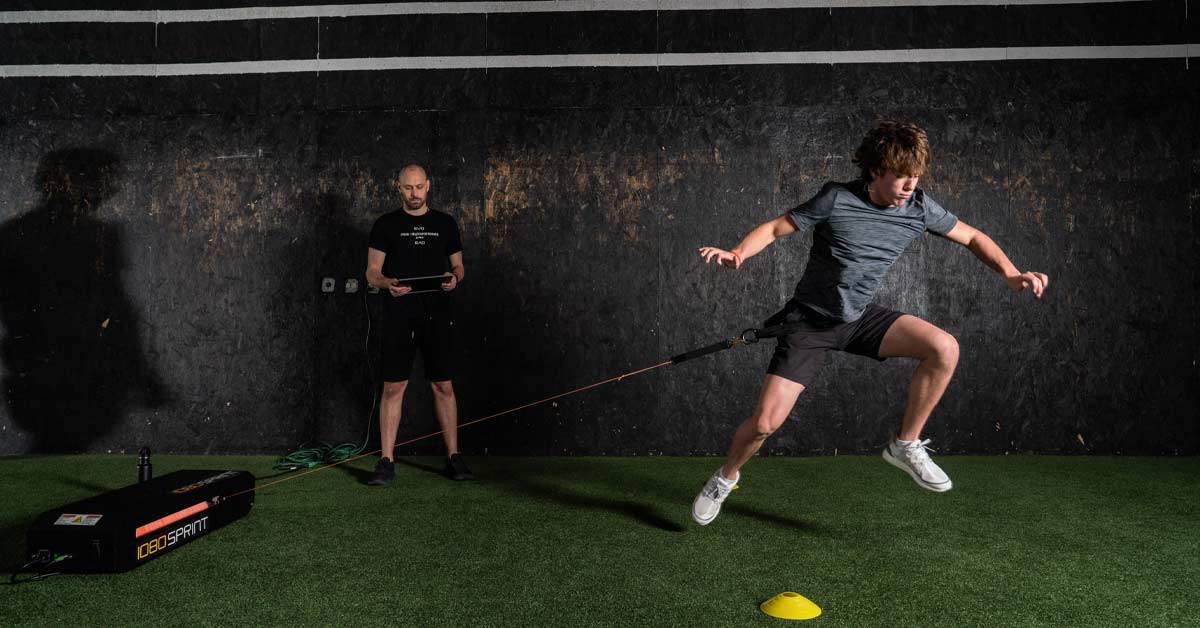
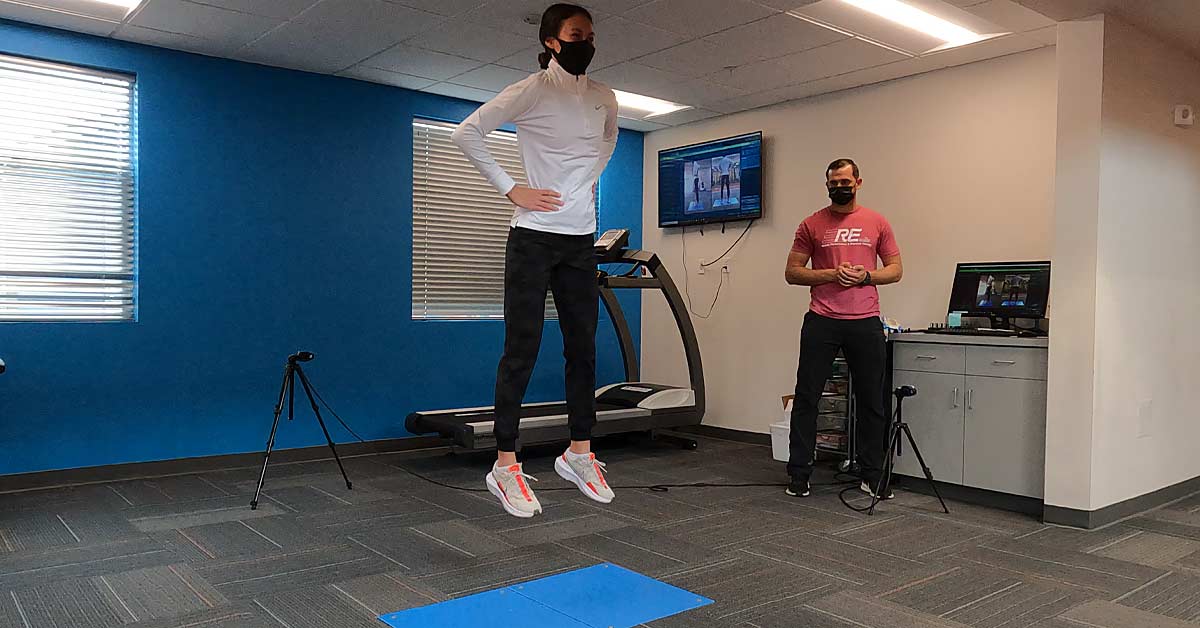
Quantifying Peak Velocity Quotient in Multiplanar Jumping with 1080 Sprint
When looking at an athlete’s ability to create high velocity in a short time, it’s very useful to be able to do this without planar…
Outside My Lane: What if I Were a College Track and Field Coach?
As a high school coach, Rob Assise has experience working with college coaches and recruiters. In this article, coach Rob swerves outside his lane to…

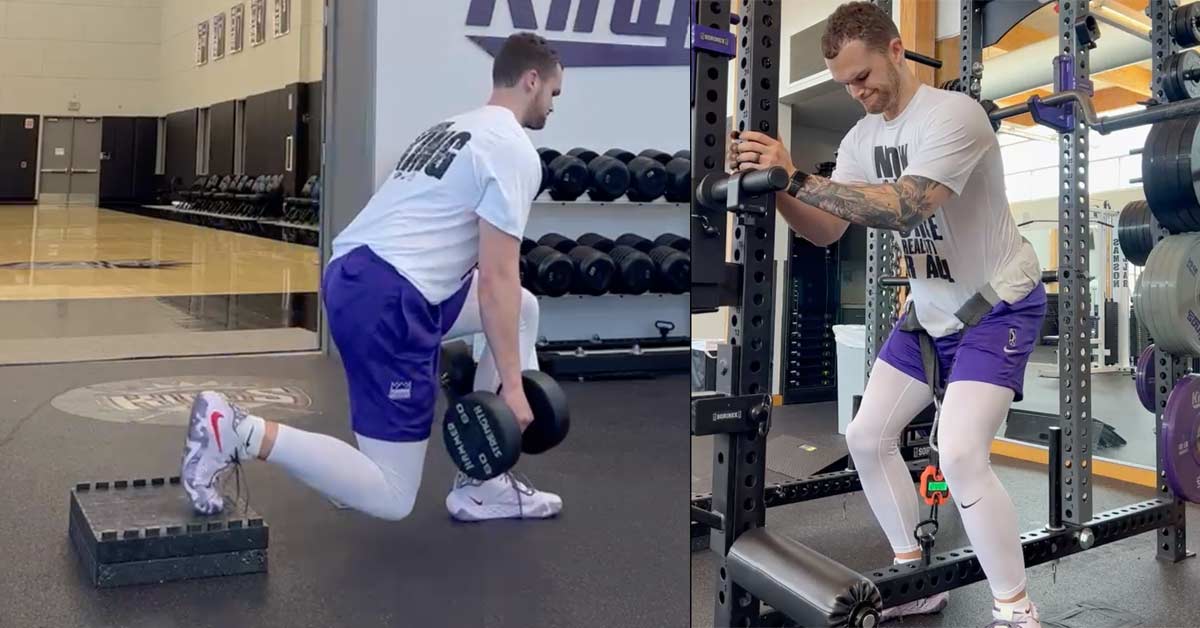
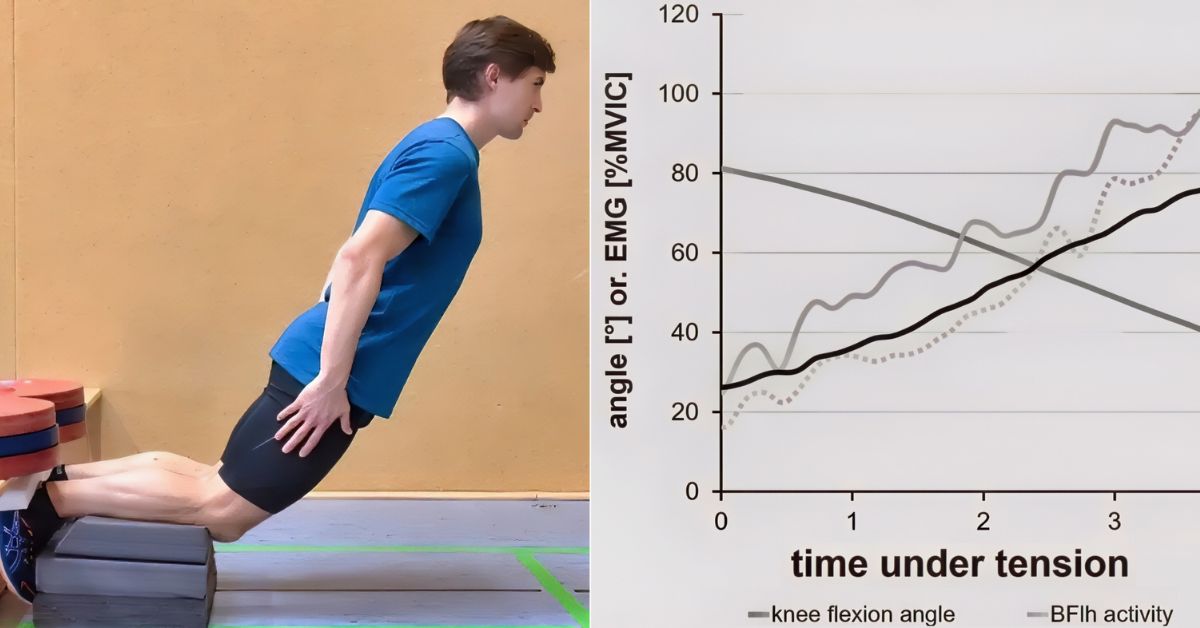
Redefining Strength: High Force Does Not Equal High Load
Coach Hunter Eisenhower proposes that the best way to prepare athletes for sport and keep them healthy isn’t loading them with as much weight as…
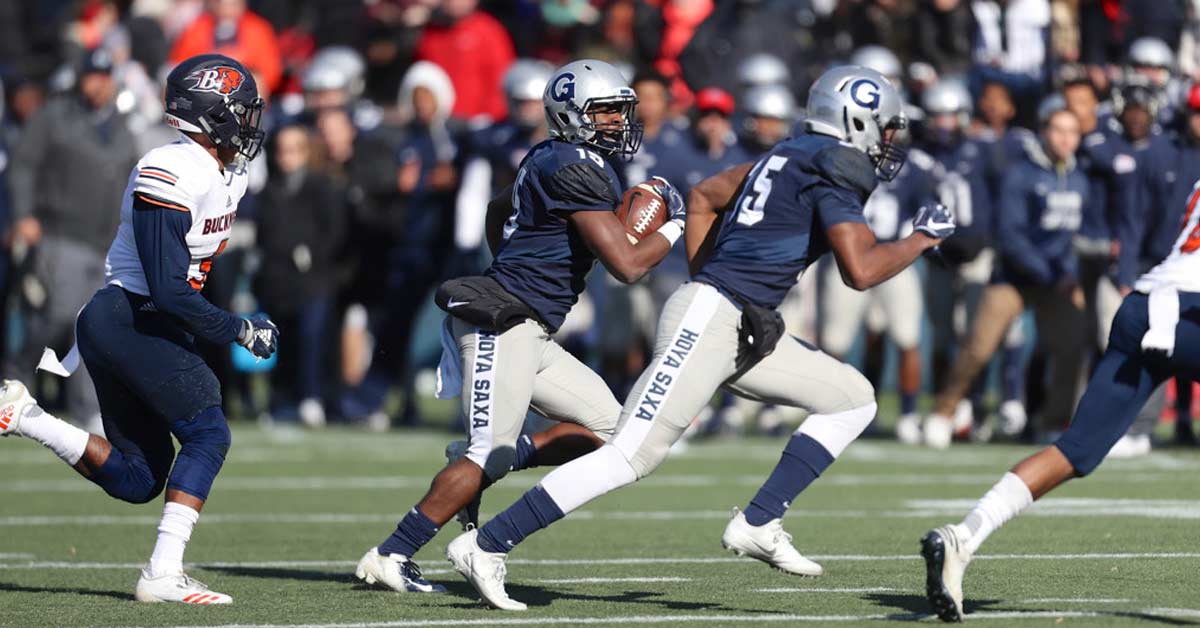
What I’ve Learned by Using GPS in Football
Coach Torin Shanahan knows every team doesn’t have GPS, so he provides some of the lessons he’s learned with GPS for football to help you…
CVASPS Seminar Q&A Series: Molly Binetti
This third blog post on CVASPS’ upcoming July seminar is with presenter Molly Binetti, Director of Women’s Basketball Performance at the University of South Carolina.…


Applying Ockham’s Razor to Coaching
Coach Mickelson applies a burden of proof spectrum to help navigate data collection, program development, and on-the-fly changes to achieve…
Popular Articles


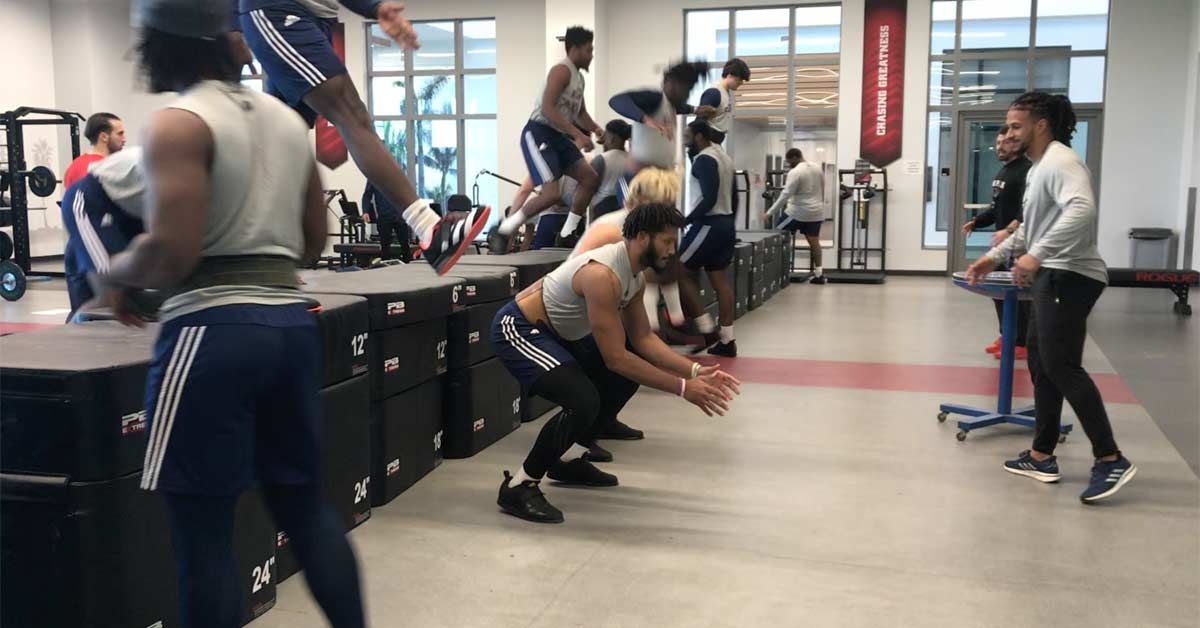
Improve Deceleration Capabilities by Training the “Left Side of the Curve”
Coach Joey Guarascio details how to implement decelerative training, breaking down how to classify, progress, and pair eccentric training elements…

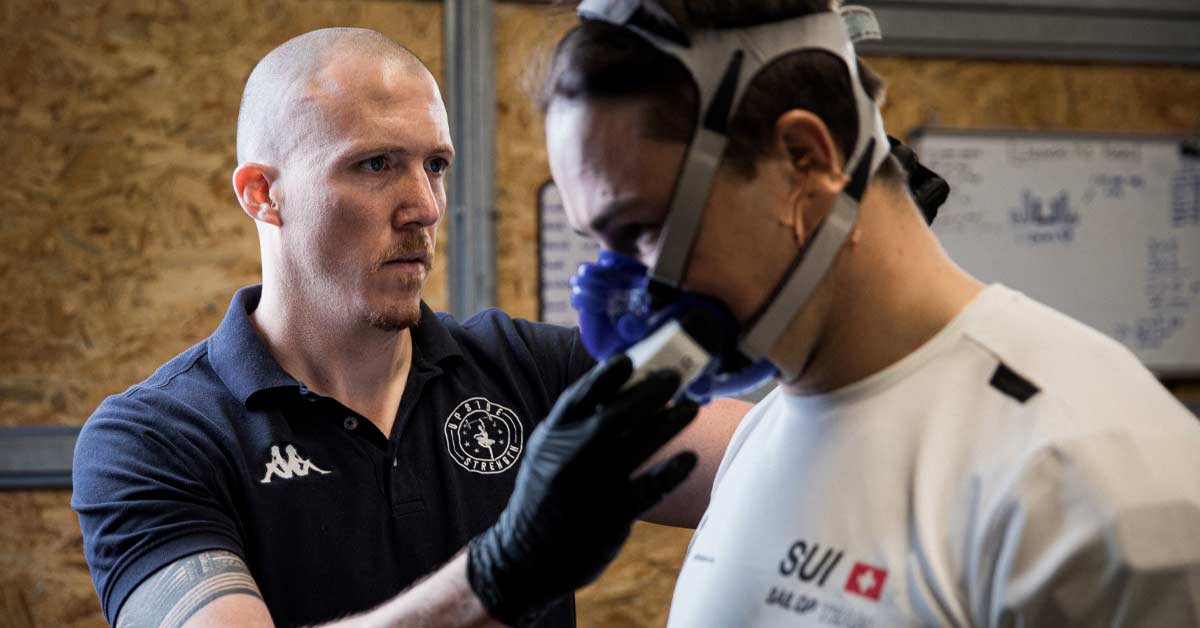
Death by a Thousand Cuts: Athlete Breathing Dysfunction
Rob Wilson helps coaches develop a basic understanding of the holistic nature of breath pattern dysfunction in athletes, some of…

How Training Athletes in the Private Sector Made Me a Better Track Coach
Coach Rob Assise has been a high school track coach for years, but he began to privately train track and…
Building Better-Conditioned Athletes Through a Physiological Profile
Performance coach Sean Seale explains in detail how he uses a physiological profile test to individualize, optimize, and orient the…

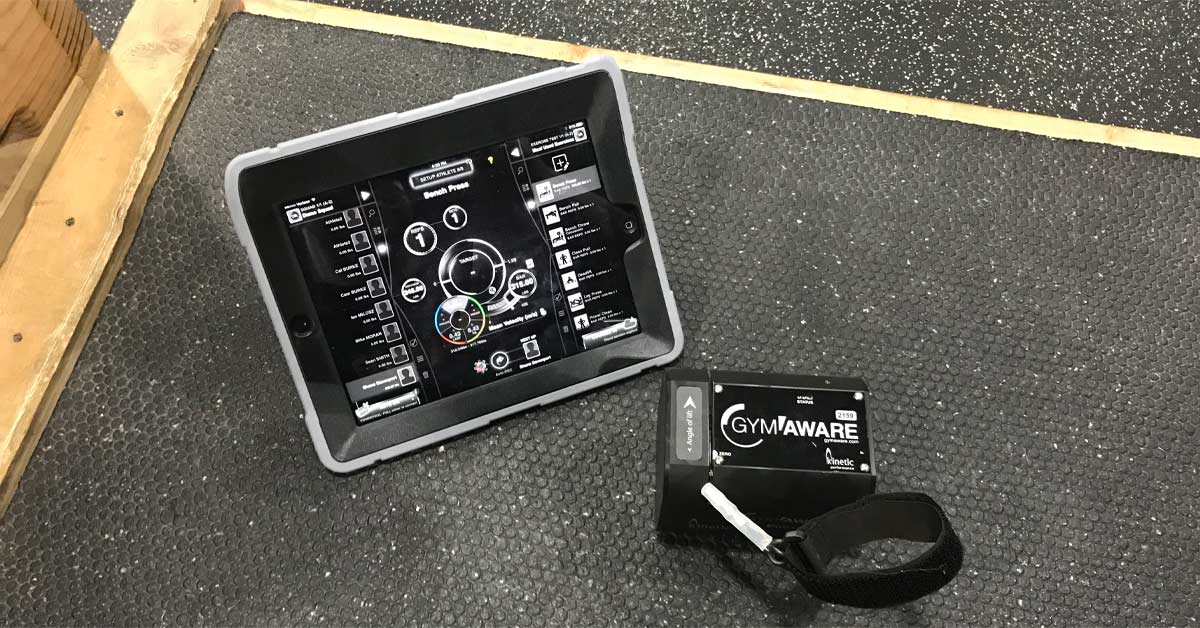
The Effects of Ballistic vs. Accommodating Resistance Barbell Training on Bar Speed Metrics
Coach Brandon Pigg undertook an informal study comparing two methods of barbell training for power. Read more about the process…
Athlete Auditing: A Holistic ‘Assessment to Intervention’ Approach
Much more than just testing and developing athlete profiles, Kyle Davey explains how auditing generates insights into how and why…