Most coaches can agree there is value in monitoring your athletes to gain insight into their wellbeing. Whether this is for mitigating injury risk or for performance enhancement, load management via monitoring systems provides useful information for the performance staff. One problem is the cost of many of these systems. There is, however, one method that is cheap and relatively easy to implement: the wellness questionnaire.
The scientific community has established that increases in workload heighten the risk of injury and can decrease performance (Esmaeili et al. 2018)—essentially, the two things we performance coaches are trying to prevent. A study by Fields and colleagues recently provided further evidence that the wellness questionnaire’s measure of readiness at the beginning of the day was directly related to the external workload. The study showed that morning readiness is predicted by the previous day and predictive of that day’s external load measures (Fields et al. 2021).
The scientific community has established that increases in workload heighten the risk of injury and can decrease performance, says @Torinshanahan42. Share on XThis opens up opportunities for implementing subjective readiness measures to provide the same monitoring benefit as much more expensive tools. Many coaches are now left pondering the key question: “How do I implement this with my team?” Lucky for you, I am here to provide you with the lessons I have learned from using questionnaires with a D1 conference championship-winning team.
Questionnaires are designed to be conversation guides, not decision-makers. The insight gained is just one piece of a larger, more complicated puzzle. Now, this one piece is a key cornerstone, but still just one piece. Conversations must be had among the strength staff, medical staff, and coaching staff both about and with the athletes. The athletes must be involved and talked to when warning signs pop up. The ultimate goal of these questionnaires is to provide guidance on who needs to be talked with, and what about. Effective implementation is feasible when three simple components are established:
- Using it with the right team.
- Simple delivery.
- Insightful analysis.
The Right Team
The right team? What does that even mean?
Questionnaires are not practical for every team. The right group is paramount to the method’s success. A team of 15 and up to 40 athletes is the ideal size. Much smaller and you are better served simply talking to each athlete; and any larger and questionnaire compliance with that many individuals can be very tricky.
The right group is paramount to the method’s success. A team of 15 and up to 40 athletes is the ideal size, says @Torinshanahan42. Share on XWhy not just talk to all your athletes anyway? Why do you need the questionnaires?
Depending on staff size, it can be difficult to have a meaningful conversation in groups of greater than 15 athletes (hence why the questionnaires can help guide you). As an example, when I was working with women’s lacrosse, I would look at the data every morning as it came in live before morning training sessions. I set up Excel’s conditional formatting to highlight any athletes whose responses were outside of the norm. We used a traffic light classification system: between one and two standard deviations below the mean was orange, and beyond two standard deviations created a red light. I would approach the highlighted athletes during the warm-up to talk through the concerns I had. Most ended with “Sounds good, let’s have a great day,” but some of these conversations led to modifications for the training session.
The second part of picking the right team is the culture of that group. The group needs to have a sense of pride in the details and be a group with strong leadership and a desire to improve no matter what it takes. At the end of the day, you are relying on them to take their time to fill out the questionnaire truthfully. Without that, it is pointless—so picking a team that possesses the culture to comply with honesty is key.
Simplicity
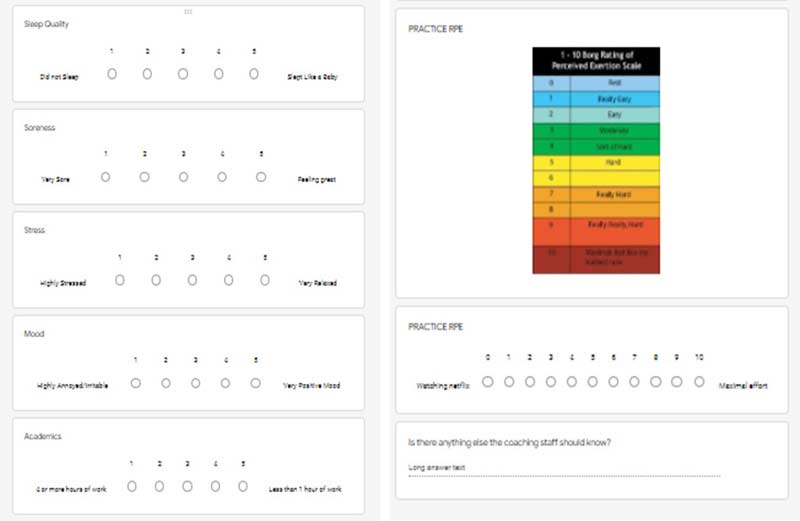
The second key piece to address is designing and delivering a questionnaire in an efficient manner that gives you impactful information. Begin with the design of the questionnaire—for those not familiar, one of the more common questionnaire frameworks is multiple questions that are typically on a 1 to 5 scale (Figure 1). These ask about the athlete’s fatigue, sleep quality, soreness, stress, and mood (Fields et al. 2021). Additionally, hours of sleep and RPE have been added along with other more team-specific questions. Two problems can arise with this particular format, detailed below.
The second key piece to address is designing and delivering a questionnaire in an efficient manner that gives you impactful information, says @Torinshanahan42. Share on XDesign Problem 1: Redundant Questions
If multiple questions are very similar, they can be simplified to streamline the information while reducing the time required to fill out the questionnaire to increase compliance. Without any analysis, any coach can agree that fatigue and soreness as well as mood and stress are related. In fact, Fields et al. backed this up by stating that fatigue and soreness were the two most predictive readiness variables for external load measures (2021).
According to the Merriam-Webster Dictionary, fatigue is defined as “the sensation of tiredness,” while soreness is “the sensation of pain or discomfort from exertion.” In the athlete’s mind, what is the difference? We as coaches can specify what we mean it to be, but from an athlete’s point of view, what is one without the other? They are extremely similar and often present simultaneously. Our data provides evidence to support this idea: fatigue and soreness correlated together at 0.59 and had the same scores 55.7% of the time (Table 1).
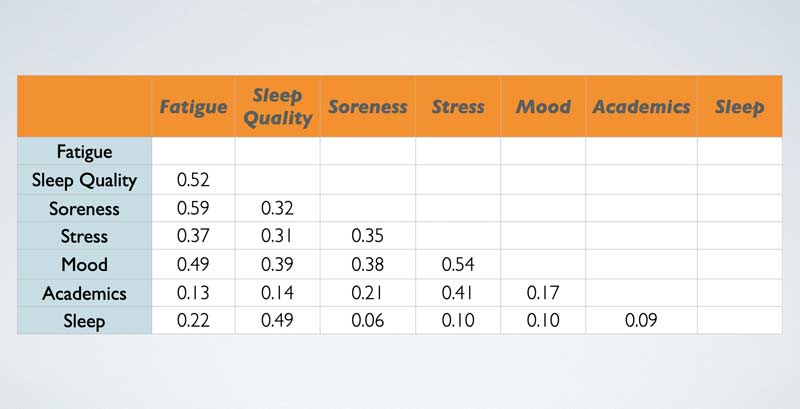
The same argument can be applied to mood and stress. The difference is much clearer here, but the physiological effect remains similar. Stress and mood correlated at 0.54 and had the same score more often, at 55.9% of the time (Table 1). Our athletes’ changes in mood relative to their averages were more predictive of winning versus losing games compared to change in stress level on gameday. Wellman found evidence of an effect of stress on external load measures, while Fields did not (Wellman et al. 2019) (Fields et al. 2021).
Our athletes’ changes in mood relative to their averages were more predictive of winning versus losing games compared to change in stress level on gameday, says @Torinshanahan42. Share on XIn conclusion, mood and stress could be used interchangeably in questionnaires, but the overall evidence points to only needing one measurement. Additionally, fatigue correlated moderately with stress and mood; 0.37, and 0.49 respectfully. Mood had a moderate correlation to other factors like soreness at 0.38 (Table 1). Considering the complexity of the human body and our athletes’ lives, these are solid relationships that can be used to provide information about the other measures of readiness.
Design Problem 2: Vague Scales
The second problem is the degree of vagueness in a 1-5 scale, and that lack of definition creates unnecessary discrepancies. This is the same argument that most make with utilizing RPE. You can learn what the extremes feel like: you know what it is like to feel so sore you cannot walk, or what it feels like to wake up feeling so great you could outrun Usain Bolt. Knowing what a 1 or a 5 is on a scale of 1-5 is pretty easy.
What, however, does a 3 feel like?
The degree of vagueness creates “noise” in your question (defined as “irrelevant or meaningless data or output occurring along with desired information” by Merriam-Webster). Creating concrete structure for your question will reduce this unwanted signal of an athlete not truly understanding what one response choice means versus another.
The degree of vagueness creates *noise* in your question, says @Torinshanahan42. Share on XAdditionally, on a 1 to 5 scale, the middle 3 should be your average to allow room for degrees of positive and negative change. On all the readiness questions, our data averaged out to be a 3.76 out of 5, with a median of 4 across all the questions. Questions about mood and sleep quality actually averaged over 4. This limits our ability as practitioners to understand the positive change in our athlete’s state of being due to the inherent noise created by 4 being the average. Questions should be written so that the average is in the middle, to allow the full range of possible change to be captured by the question’s design.
Optimal Questionnaire Design
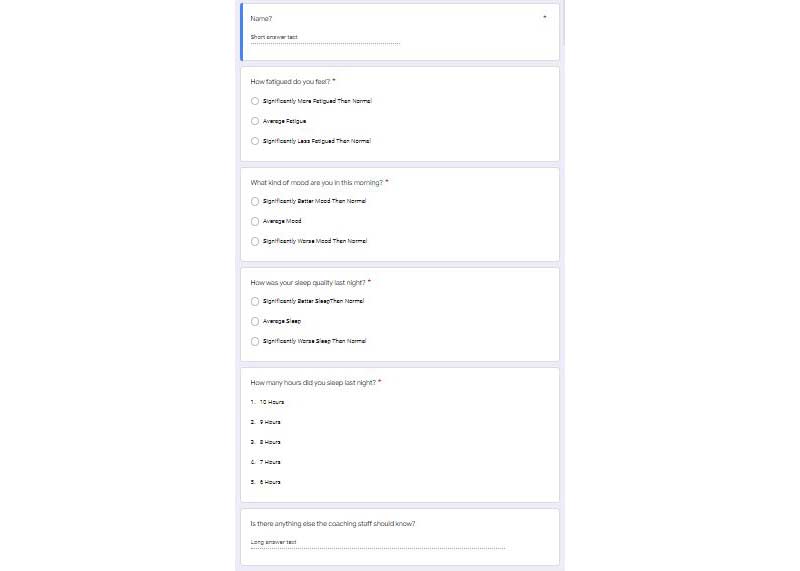
What I learned from my experience is that the design needs to be simplified and specifically tuned to amplify the signal of what is impactful, while drowning out the noise of what is not. This can be done with fewer questions than traditional formats (Figure 3). Fewer total questions on the entire questionnaire will decrease the time needed to fill it out, which will increase the focus on the questions that are present.
Fewer total questions on the entire questionnaire will decrease the time needed to fill it out, which will increase the focus on the questions that are present, says @Torinshanahan42. Share on XA sleeker design incorporates one question each about fatigue, mood, sleep quality, and the number of hours slept (Figure 3). The questions below were picked based on the statistical analysis mentioned above to decide which questions provide the most information. A very simple response system was employed, with three total responses for the questions on fatigue, mood, and sleep quality. The responses would be below-average, average, and above-average to increase the specificity of the information received by cutting out the vagueness (Figure 3).
Simply, this means that the average will always be the average. I designed this to give room for minor day-to-day differences without creating unnecessary noise when the athletes must define the difference between a 3 and 4. It also plays into the earlier argument that has been brought against RPE—by only giving the choices of average or an extreme, the athlete can easily pick if they are at an extreme or not. This creates clarity.
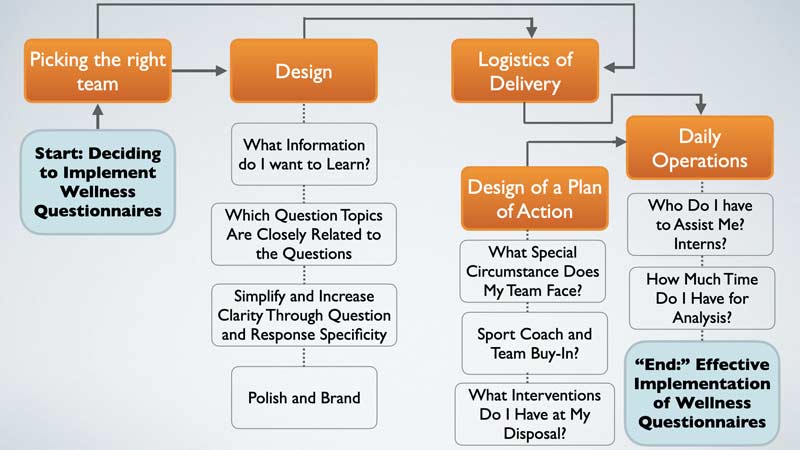
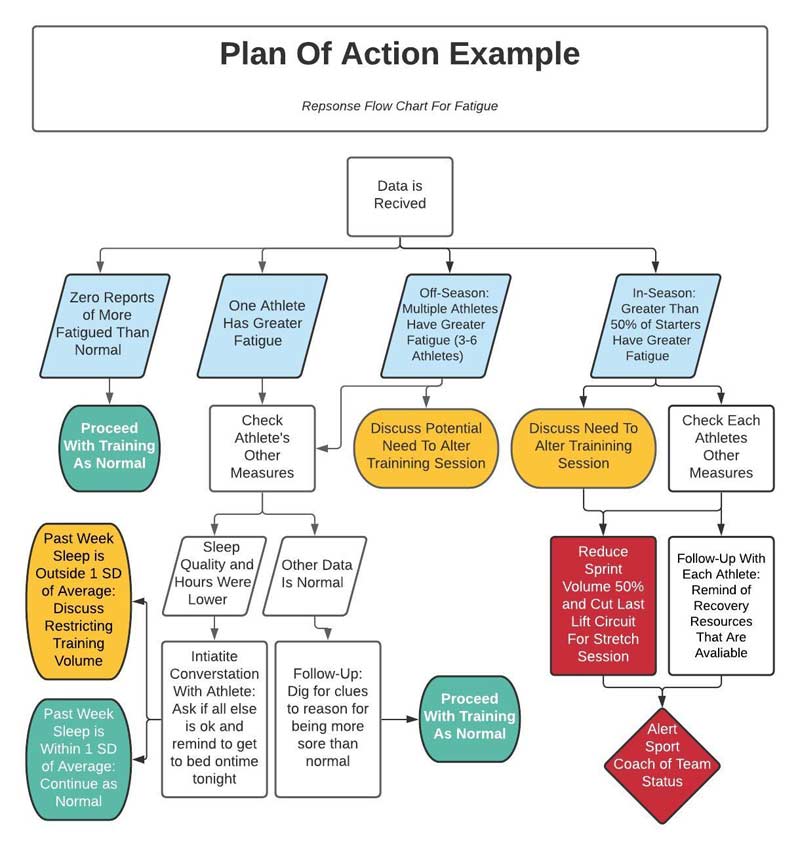
Questionnaires need to be built to have set “plans of action.” If this happens, then this happens. This can be specific to the team, athlete, or question. For any responses out of the norm, there is a set plan of action to address that issue. I refer to these as “points of discussion.” Again, the concept behind questionnaires is to guide the conversation of how to best manage your athletes. When certain data is received it should initiate a conversation as to why that trend is occurring and guide you toward a solution.
For any responses out of the norm, there is a set plan of action to address that issue, says @Torinshanahan42. Share on XThis is very context-based and individualized for each team and its members. Points of discussion could be if anybody has a response of significantly below-average score, then they are talked to during warm-up to ascertain more information about what is wrong. This is where the art of coaching is guided by the science of coaching. Some of these circumstances could turn points of discussion into points of decision, meaning that actions were directly taken because of data responses (example plan of action in Figure 4).
Simple Delivery
Once you have designed a practical questionnaire, delivering it is by far the easiest part. These questions can be sent through Google Forms, your athlete management system (AMS), or any other form system. Data can be downloaded into Google Sheets or Excel very easily. Google Forms can be bookmarked, added to the home screen, or saved in many other ways for easy access. Some AMSs can resend the link for the questionnaire at pre-scheduled times to assist with access and compliance.
Once you have designed a practical questionnaire, delivering it is by far the easiest part, says @Torinshanahan42. Share on XI implemented a Google Form and Excel workflow. Google Forms were sent to the athletes to be bookmarked on their devices. Google Sheets allowed having instant access to a live data feed. I connect the Google Sheet to my Excel workbook for more advanced calculations, analysis, and reporting.
Insightful Analysis
A complete breakdown of how to analyze the data is beyond the scope of this article. Analysis needs to be simple and quick. To be efficient, it should be automated as far as daily analysis goes. Excel and Google Sheets provide starting points to crunch the numbers, set up dashboards, and create great visuals. Excel and Google Sheet wizards like Adam Virgile and Dave McDowell are great resources when it comes to making a workbook. Using a question and response system like the one proposed above will make analysis extremely easy due to the lack of quantifiable responses. This can be challenging for the math nerd in some of us but it makes our lives as coaches easier. We are here to help athletes, not to play around in Excel.
Summary
1. The Right Team
- 15-40 athletes
- A culture that focuses on the details and doing the right thing
2. Streamlined Delivery
- Less than 5 Questions Total
- Fatigue
- Mood
- Sleep Quality
- Hours of Sleep
- Simple and extremely clear response choices
- Create a plan of action.
3. Analysis
- A million ways to do this.
4. Visualization
- Simple
- Context
- Meaningful and Impactful Information Only
5. Day to Day Operations
- Check responses as data comes in before sessions.
- Engage athletes and staff at points of discussion according to your preset plan of action.
Since you’re here…
…we have a small favor to ask. More people are reading SimpliFaster than ever, and each week we bring you compelling content from coaches, sport scientists, and physiotherapists who are devoted to building better athletes. Please take a moment to share the articles on social media, engage the authors with questions and comments below, and link to articles when appropriate if you have a blog or participate on forums of related topics. — SF
References
Esmaeili, A., Hopkins, W. G., Stewart, A. M., Elias, G. P., Lazarus, B. H., and Aughey, R. J. “The Individual and Combined Effects of Multiple Factors on the Risk of Soft Tissue Non-Contact Injuries in Elite Team Sport Athletes.” Frontiers in Physiology. 2018;9:1280.
Fields, J. B., et al. “Relationship Between External Load and Self-Reported Wellness Measures Across a Men’s Collegiate Soccer Preseason.” Journal of Strength and Conditioning Research. 2021;35(5):1182–1186.
Wellman, A. D., Coad, S. C., Flynn, P. J., Siam, T. K., and McLellan, C. P. “Perceived Wellness Associated with Practice and Competition in National Collegiate Athletic Association Division I Football Players.” Journal of Strength and Conditioning Research. 2019;33(1):112–124.
Halson, S. L. “Monitoring Training Load to Understand Fatigue in Athletes.” Sports Medicine. 2014;44(S2):139–147.
Saw, A. E., Main, L. C., and Gastin, P. B. “Monitoring the athlete training response: subjective self-reported measures trump commonly used objective measures: a systematic review.” British Journal of Sports Medicine. 2015;50(5):281–291.
Taylor, K.-L., Chapman, D. W., Cronin, J., and Gill, N. D. “Fatigue Monitoring in High Performance Sport: A Survey of Current Trends. Journal of Australian Strength and Conditioning.” Journal of Australian Strength and Conditioning. 2012;20(1):12–23.
Thornton, H. R., Delaney, J. A., Duthie, G. M., and Dascombe, B. J. “Developing Athlete Monitoring Systems in Team Sports: Data Analysis and Visualization.” International Journal of Sports Physiology and Performance. 2019;14(6):698–705.
Wing, C. “Monitoring Athlete Load: Data Collection Methods and Practical Recommendations.” Strength and Conditioning Journal. 2018;40(4):26–39.


