[mashshare]
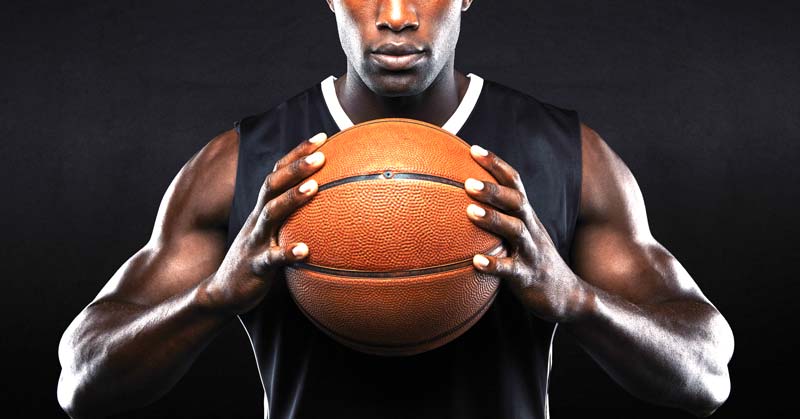
After a tremendous experience teaming up with Erik Jernstrom and Ryan Baugus in the EForce Sport off-season to work with a group of NFL hopefuls and veterans, I started a second off-season project with an area college basketball athlete. Mark McLaughlin, Director of Coaching Education for Omegawave North America, has trained this athlete for years and he invited me to help better assess his training process.
Let’s be clear: We already have a solid understanding of the athlete’s strength and conditioning program. Mark has done tremendous work over the years to help develop this young man, and his athlete-centered philosophy is to thank for the numerous, repeated successes his athletes have achieved. Bringing me onto this project had a bigger element in mind: skill development.
As I shared in previous SimpliFaster articles, there is a real need in sport science to continue to connect the dots between performance, monitoring and assessment, interventions, and performance outcomes. This current project helps us form the foundation for assessing the athlete performance process and connecting to its most meaningful outcome: game performance.
There are some people in strength and conditioning and sport science who maintain that what happens in competition is out of their hands; they improve the athlete, and it is up to the athlete to display their skill in competition. Others claim their programs are instrumental in helping their teams stay healthy and perform better. I believe in a slightly different approach that considers strength and conditioning, rehabilitation, practice, recovery, and games as all part of a single performance process.
Tactics aside, the way we train athletes in the off-season absolutely influences how they can optimally, sustainably, and consistently display their skill in practice and competition. Here is an explicit example: If you train your offensive linemen using only long, slow endurance runs, are they going to be the most powerful blockers at the line of scrimmage? Clearly, they will lack certain physical tools to optimally and sustainably maintain a maximal effort block for several seconds in a highly reactive environment, every 15 to 30 seconds, for 5 to 9 minutes, 8 to 12 times a game. So, while strength and conditioning isn’t teaching athletes how to perform a sport-specific skill, it is absolutely giving them physiological and mechanical skills to execute the tactic.
This example brings us back to the original reasons of this project, determining:
- How are we asking questions about the ways training and recovery may, or may not, have an influence on the actual performance of the sport in competition?
- How could we possibly nail down the right variables to monitor and assess?
- Just what is the exact question we are trying to ask about the effects of training and recovery on skill performance in competition?
Initially, Mark wanted to ask a much bigger question about skill-building sessions and practice. After assessing all the factors related to the variables and KPIs we monitor, I determined we needed to simplify our approach to the order of our investigation. Do readiness and recovery have an effect on skill performance outcomes?
Part of the theoretical construct I base this line of questioning on comes from research performed on collegiate athletes at Stanford University. While pure physical traits such as speed and skills such as domain-specific reaction time will, in theory, help boost performance, these studies outline sport-specific skills that get better following the improvement of specific recovery strategies such as sleep duration.
With these concepts in mind, in the last five years I have focused on the discovery, interpretation, and communication of meaningful information in sport that staff can directly apply to improving their team’s performance. Like many others, I fell in love with the idea that technology could help us measure every aspect of performance, recovery, health, and wellness. I was certain that GPS would help us unlock the truths about crazy practice loads and the reasons that teams fail in games. Perhaps we all were a bit too zealous in thinking that technology was going to solve every problem, but it helped us to start asking different questions of ourselves.
The idea for my Pyramid of Performance Analysis began back in August 2012, as I was going through the local newspaper and reading about an abundance of injuries in NCAA football teams during fall camp. Recalling my own time trying to survive camp as a college football player, I strongly felt back then that there were better ways to prepare a team to perform. There was an explicit feeling I had on the field, which my teammates shared, when we were strong, fast, fresh, and ready to play. Perhaps “flow-state” is too cliché to describe this feeling, but our team performance spoke for itself.
Likewise, when the three-plus hour-long full-contact practices started adding up, our game performance began suffering. The feelings we had about our own well-being, recovery, etc., were not the same as in the weeks and months before. Our body language, our physical performance, and our game performance suffered. This had nothing to do with the fabled “mental toughness” trait peddled by coaches for decades, and everything to do with how fatigue impacted our play.
Central, peripheral, neural, tissue—whichever label or paradigm you subscribe to, the fatigue was present. I sensed it, my teammates sensed it, and the scoreboard showed it. The acceleration out of a break in a route? Gone. The extra push off the line of scrimmage in man-blocking? Gone as well. Our ability to execute our tactics in a highly complex and reactive environment? Impaired. It didn’t matter if the right play was called, if we were aligned correctly, or even if we made the right read, we were a step slower and weaker when it came time to execute our tactics.
This experience was instrumental in influencing my approach to our investigation. Can we do a better job of identifying and presenting the factors that affect the sport-specific skill performance of an athlete? If we establish a firm foundation in our line of questioning, can we entertain a larger discussion about team performance in games? In the future, this will require us to see success first and then work backwards. Based on our team, our players, our systems, and our opponents, what does success look like for us?
Is scoring 70 points in a basketball game and winning by five points sufficient for our team? Is our defense giving up 80-plus points a game acceptable for our program? More specifically, are we sufficiently performing the traits, skills, techniques, and tactics we need to reach our goal of winning? And if we aren’t performing these traits to par, what are we doing to positively affect them? This last question is where all allied performance staff members should be contributing their skills to help maximize the specific physical and psychological traits the athletes need to execute the tactics and techniques.
Our current project starts with a basic question around readiness and recovery, and their relationship to basic, objective, sport-specific skill performance. In our case, we assess free-throw and three-point percentages in standardized shooting drills during “skill sessions” with private basketball trainers. Mark and I are not in charge of the skill sessions, but we receive daily feedback from the athlete via surveys in our athlete management system, Voyager. Based on our theoretical construct that readiness and recovery factors have an impact on sport-specific skill performance, we outline the data as follows:
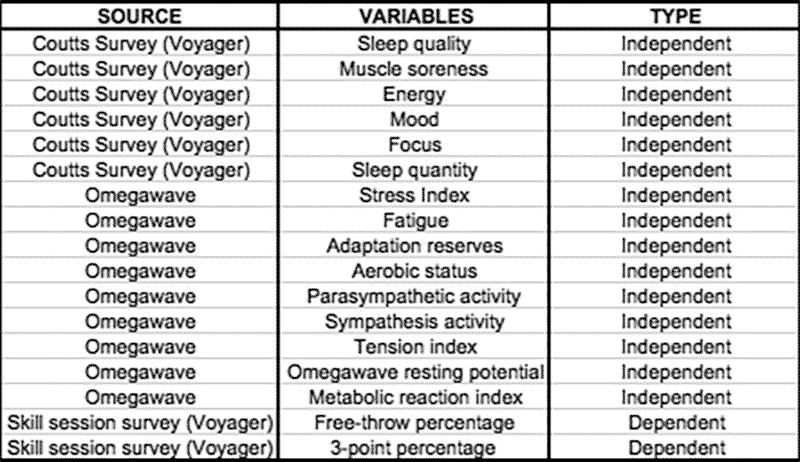
In our system, we believe that these are the appropriate KPIs to use as independent variables that influence the dependent KPIs given our baseline investigation. It was crucial to include both subjective (recovery survey) and objective (Omegawave reading) information regarding readiness and recovery. Additionally, we included information from the athlete on the session RPE of the skill sessions.
In the coming weeks, we will expand the information to include the skill-session coach’s perception on session difficulty and player performance. From a data-collection standpoint, this may not be the most specific, sensitive, or reliable data source; however, including the coach’s feedback in our process serves a much bigger goal of relationship-building, education, and sport-specific input. From a sport science standpoint, one should pursue anything that can be done to build a bridge with the sport coaching staff. Sport science does not own all of the solutions to team performance by itself; it only exists to help find them.
Daily Procedures
Each morning, the athlete wakes up and uses their phone to complete the recovery survey inside their Voyager account. The survey has similar concepts to a popular recovery survey produced by John Abreu and Derek M. Hansen in 2014. The core concepts of our survey are based on McLean et al (2010) and Hooper & Mackinnon (1995)1,2.
A few minutes later, the athlete performs the Omegawave reading procedure from home as well. Mark took great steps to educate the athlete on a standardized scanning procedure for the Omegawave to help reduce errors in measurement. The subjective input from the athlete is received first, and the objective data collection via Omegawave is performed second. Some athletes can see the results of their scan and plan accordingly, but we have elected to limit the visibility of the results of our athlete’s scans during this specific period of his summer program.
The athlete performs two to three skill sessions each week, and has two to four training sessions as well. Mark programs and manages the timing and frequency of the training sessions depending on the athlete’s readiness. As stated before, we do not have influence on the timing, frequency, or intensity of the “skill sessions.” Mark elected to limit aerobic development and maintenance work in training, since we believe the skill sessions provide the stimulus to aid in accomplishing this task.
In the 15 to 30 minutes following each skill session, the athlete again uses his Voyager account to fill out a post-skill session survey. He inputs total free throws and three-pointers attempted and made, as well as a session RPE and total session time (in minutes). I establish a daily shooting percentage for each metric, as well as a rolling average for the summer skill sessions.
Initial Data Summary
As we continue to build the database on our athlete, we have formed basic descriptive statistics about the athlete’s recovery behaviors and Omegawave data, as well as his objective shooting performance. In the first month of our investigation, I chose to first focus on identifying the trends and relationships among the recovery and wellness factors. We are still building a more robust data set for our skills sessions, so making any type of inference based on a data set of N=10 would be premature. As the skill-based data builds, focusing on the recovery and readiness data allows us to start asking more specific questions. I intend to either trim down the data we collect in the future, or assess ways of fortifying the sensitivity of the KPIs we deem most important from this project.
The recovery survey is a five-point, five-question survey and includes a space for quantifying sleep time. Additionally, there is a space for the athlete to input any notes for me or Mark. Our athlete has averaged a total wellness score of 20.1 (out of 25) over the first month of our investigation. The standard deviation of each wellness indicator is below 1, which in this case means the athlete scores consistently from day to day in his wellness and recovery indicators.
Since we are partially basing our theoretical construct on sleep quality and time, it is worth noting that our athlete averages 8.23 hours of sleep per night, with a standard deviation of 1.34. His sleep data totals reflects this, as he only reported sleeping less than seven hours on one occasion (6.5 hours to be exact), and his other scores from that day hovered at or below their averages.
While basic descriptive statistics are a start, I wanted to know if there were actual relationships between our KPIs. I will emphasize “if” as being a big IF. From a statistical point of view, a correlation between two variables must pass a certain numeric threshold to be deemed significant. Unfortunately, people often throw around the term “significant” in both research and daily life. Additionally, it should be no surprise that something statistically significant may not be practically significant whatsoever. For statistical purposes, the following rules apply:
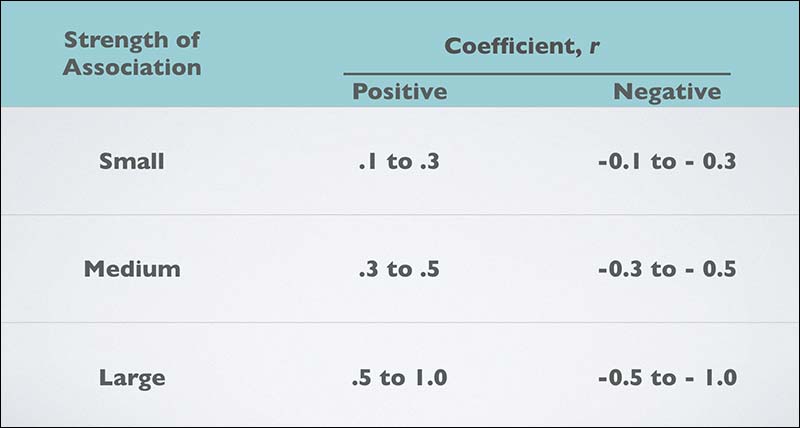

Based on these statistical rules of correlation coefficients, there were nine variables that showed large, positive strength of associations. The strongest relationship we found after the first month was between the subjective metric of “Energy” and the objective measure of “Fatigue” from the Omegawave (r=0.73). In theory, this makes sense as fatigue measured by the Omegawave is described as “the state of excessive or prolonged stress in response to physical and mental loads. How tired are the regulatory systems?”
If a strong statistical relationship exists between these two factors, how do each of them compare to the sleep metrics aligning with our theoretical construct? So far, Energy has a small, positive association with Sleep Quality (r=0.25) and a small, negative association with Sleep Quantity (r=-0.09). Fatigue has a small, positive association with Sleep Quality (r=0.17) and a small, negative association with Sleep Quantity (r=-0.02).
Does this mean sleep is not important, or that the strongest statistically associated variables have debunked the theoretical construct? Absolutely not! First, we are still in the primary stages of forming our database. Second, the factors with the strongest statistical association may have little to no impact on, or association with, the domain-specific skill of shooting a basketball.
As I dove deeper into the investigation, I wanted to better understand relationships between our KPIs. I elected to use a statistical procedure to compare the variability of the metrics. This asks a basic question: Do any two of our KPIs bounce around in similar ways? If the statistical procedure says they do, what are the underlying variables, and how will they inform our decision-making in the future? Remember, using something like an F-test is not a be-all and end-all statistical procedure, as has been well-documented in the athletic performance and sport medicine circles in recent years. We are simply using it as a primary step to reinforce our notions about how our KPIs might be related.
What is an F-test? It is essentially a ratio of the variances of a sample two metrics. Remember ratios as they are written in fraction form, a over b? Dividing the numerator by the denominator gives us the ratio we are looking for, and for our purposes, seeing a ratio close to 1 is an interesting starting point as we continue to ask questions. Going further into the F-test procedure from a statistical standpoint requires us to ask questions about our assumptions of the two variables. One assumption we test is that the variances are equal—termed the “null hypothesis.” The second is that there is a difference in the two variances—termed the “alternative hypothesis.”
Remember, it must be stated that a relationship, from a statistical standpoint, does not infer causality, and that any relationship, from a numeric standpoint, means very little without content knowledge and a theoretical construct to connect two variables. Think of it this way: I can prove to you that there is a perfect one-to-one correlation between athletes who score game-winning shots at University of XYZ, and athletes who wear Nike shoes at University of XYZ, given that University of XYZ is a Nike-sponsored school. See the point I make? Numbers can be deceiving unless you have a handle on both the variables you are dealing with and the statistical procedures you are using. No surprises there!
The results of our F-test procedures were not earth-shattering, aside from a very interesting (yet perhaps totally coincidental) relationship between two metrics. There was a perfect one-to-one relationship in the variances of Focus from our recovery survey and Fatigue from our Omegawave data. Remember, the Omegawave Fatigue score was also part of the strongest association in our correlation analysis, as it connected with Energy from our recovery survey (r=0.73).
Focus also shared a ratio close to 1 with Sleep Quantity (1.25). Of the 75 variance ratios we tested, we failed to reject the notion (or null hypothesis) that the variances were equal in 50 of the 75 cases. So, what on Earth does that mean from a practical standpoint? We could not, from a statistical standpoint, prove that there was a “significant difference” between the variances of the two variables in 50 of the 75 cases. The door is open for us to see relationships between the values of our KPIs in a correlation, as well as in the relationships of the variances among our KPIs.
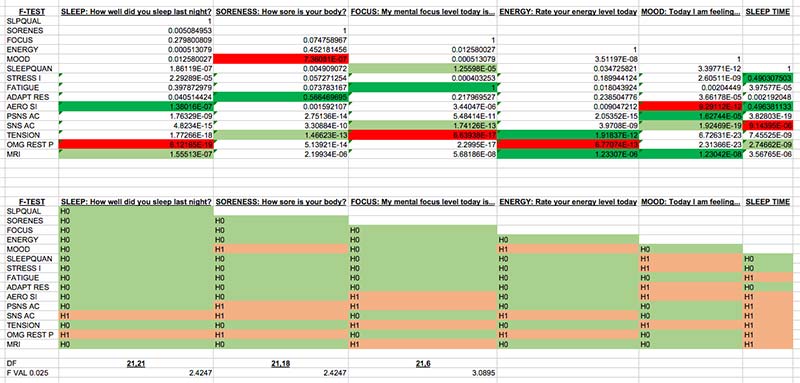
This also means we have two options in our future analysis of recovery and readiness variables for basketball skill performance. Should we narrow down the variables we compare, or should we keep casting a wide net? The latter is essentially the idea of throwing a bunch of numbers at the wall and seeing what sticks. Since this is exploratory research for a case study, we need to cast a wide net. As we build to the future, the aim should be to simplify and assess as we, as a staff, continue to learn more.
The next step in this procedure is to incorporate our basketball-specific skill performance data into this analysis. From a practical standpoint, I am interested in seeing what the athlete’s variability of shooting performance is all by itself. We need to remember that, although we aimed to have a standardized procedure for assessing free-throw and three-point percentages, the procedure was most likely not perfect in each session. Does this mean our analysis is a total waste? No. However, we are charting new waters in this attempt and the information we gather will be a valuable lens to look through as we approach the competitive season.
Conducting this case study is allowing us to form a model of the way to assess an individual athlete’s recovery and readiness, and their possible relationship to sport performance. As we form a profile for one athlete, we will take the same model and apply it to a second. I have already established a second high-level basketball player here locally, training with Erik Jernstrom at EForce. We started to implement the same procedures and will undoubtedly learn a few of the same things, but we also hope to learn a few entirely different concepts. As we strengthen the model of assessing an individual basketball player, we will expand our player profiling to include the readiness and preparedness of physical traits critical to basketball performance. These will occur alongside psychological, technical, and tactic elements all playing a role in an athlete’s performance.
What we have already learned so far in our case study is that the KPIs we monitor in recovery and readiness reinforce Mark’s reasoning for using an athlete-centered model. Making inferences from this athlete’s results and applying them to other athletes would allow too much to slip through the cracks. Our athlete is tremendous at practicing basic recovery strategies around sleep and hydration, and shows interest in fortifying his nutrition plan and daily stress management. A second athlete might show signs of being a very poor sleeper and be inconsistent with hydration and nutrition. That second athlete will not need added recovery sessions or interventions until he or she can improve foundational recovery behaviors.
Concepts are broad and encompassing, but individuality is necessary to our approach. I look forward to sharing updated data analysis for readiness and recovery in the coming days and weeks, as well as their relationship with our athlete’s shooting percentage. We anticipate our skill session database to approach 20 sessions this week, which will allow us to compare information on the sessions from a more robust data set. Additionally, I look forward to shedding light on Erik and my experiences with our second case study involving a high-level basketball player.
Since you’re here…
…we have a small favor to ask. More people are reading SimpliFaster than ever, and each week we bring you compelling content from coaches, sport scientists, and physiotherapists who are devoted to building better athletes. Please take a moment to share the articles on social media, engage the authors with questions and comments below, and link to articles when appropriate if you have a blog or participate on forums of related topics. — SF
[mashshare]
References
- McLean BD, Coutts AJ, Kelly V, et al. Neuromuscular, endocrine, and perceptual fatigue responses during different length between-match microcycles in professional rugby league players. Int J Sports Physiol Perform 2010; 5 (3): 367-383.
- Hooper SL, Mackinnon LT. Monitoring overtraining in athletes. Recommendations. Sports Med 1995; 20(5):321-327.


