• Skip to content
  • Skip to primary sidebar
SimpliFaster

SimpliFaster

cart

Top Header Element

  • Facebook
  • Instagram
  • Twitter
  • YouTube
  • Login
  • cartCart
  • (925) 461-5990
  • Shop
  • Request a Quote
  • Blog
  • Buyer’s Guide
  • Freelap Friday Five
  • Podcast
  • Job Board
    • Candidate
    • Employer
    • Facebook
    • Instagram
    • Twitter
    • YouTube
You are here: Home / Blog

Blog

Female High Jumper

How to Program for Multiple Events

Blog| ByAlex Jebb


Female High Jumper

Designing a well-structured training program is vital for coaching track and field, and a big dilemma for coaches is how to accomplish event work for athletes who compete in more than one discipline. This is especially true for combined-event athletes, but also for sprinters/hurdlers, hurdler/high jumpers, and pole vault/long jumpers on both the high school and collegiate levels.

There are many options for programming and sequencing event work. I don’t believe any single methodology of compatibility is unequivocally better than another, but I do believe every coach needs to understand the overlap, differences, and interplay among the various approaches.

In this article, I will discuss different methodologies to sequence and pair event-specific work, and I’ll provide recommendations for best practices in the scholastic setting.

The importance of speed and power development cannot be stressed enough. Optimum development occurs when these two qualities are trained concurrently. Speed and power training improves neuromuscular integration by accelerating speed, strength, and coordination acquisition. It also improves muscle fiber recruitment, rate coding capabilities, and motor unit synchronization. When we organize training by high neural demand, we elicit an optimal and specific adaptation at the cellular level.

Due to the varying technical and physical demands of training for multiple events, however, programming can present numerous challenges. For example, the excessive density of high neural demand days will compromise the athlete’s central nervous system (CNS). An insufficient number of high-intensity days, though, will not induce any positive adaptations.

A too-heavy focus on event-specific technique work will stump long terms gains. But athletes need to be technically proficient (or at least competent) in an event to capitalize on their talent. During the mesocycle before a competition, it’s recommended that athletes practice at high intensity for consecutive days. Alternating high and low-intensity days, however, allows the nervous system to recover while work is still accomplished on the low-intensity, general days.

The interplay of these considerations determines the program’s success.

What should athletes do, for example, on high jump days? They could pair high jump work with acceleration development because the two have similar time programs. They could high jump on days they do max velocity work because both employ vertical firing patterns. They could also high jump before a special endurance workout, modeling a decathlete who races the 400m after high jumping.

Background

First, it’s important to understand each event’s requirements through a simple needs analysis. Speed and power capabilities are the dominant determinants of success for sprinters, hurdlers, and jumpers (400m runners come with a bit of a caveat, but they’re still clearly speed and power athletes). Training for combined-event athletes should also center on developing speed and power. For decathletes, nine out of ten of their events qualify as speed or power. For heptathletes, 6.5 out of their 7 events qualify.

For combined-event athletes, work capacity capabilities are more important than aerobic “fitness.” Share on X

There is a misguided notion that combined-event athletes need an aerobic base to be “fit” enough to withstand the rigors of competition. Work capacity capabilities are more important than an aerobic base because combined-event athletes must perform speed and power events at full intensity on two consecutive days. Developing these qualities with sprints, hurdles, jumps, and throws should be a top priority for coaches and athletes.

Pairing Philosophies

Pair by Time Programs

It’s common to pair event work by exercises that have similar time programs. A time program is a movement-specific innervation pattern. It’s determined by the neuromuscular impulse sequence of muscle activation as well as the duration and behavior of bioelectrical activity.

The ground contact time of a drop jump, for example, is a time program; it’s a quantitative expression of the fundamental movement program. Structurally similar movements are steered by the same time program, and time programs of varying lengths must be distinguished.

We can consider time programs for track and field movements in terms of ground contact times. Generally, shorter ground contact times lead to a more effective time program. Think of an athlete’s dorsiflexed ankle while at top speed, pretensioning before ground contact. By pairing similar time programs, we can send direct and concise messages to the CNS and a transfer among structurally similar movements becomes possible1.

Why pay attention to ground contact time (GCT) at all? The key to jumping far or running fast is generating a high amount of ground reaction force within the very short time period the foot is on the ground.

Everything comes back to power, which has both force and velocity components. Exercises such as squats are great for developing the force component of power, but very high-speed movements (i.e., GCT < 200ms) are needed to develop power’s velocity component.

Stratifying by GCT can also help frame the session’s goal. In jumps training, there is explosive strength and elastic strength, with a GCT threshold of about 200ms serving as the dividing line.2 Exercises such as box jumps, jump squats, and the Olympic lifts train the former while exercises such as hurdle hops, sprinting, and bounding train the latter.

The table below shows observed ground contact times in various events:

Table 1. Ground contact times in seconds by event.
Event LJ TJ HJ PV Sprint (0-50m) Sprint (0-100m)
Ground Contact Time (sec) 0.12-0.15 0.10-0.20 0.13-0.21 0.12-0.20 <0.15 <0.10


From this, we can draw a few observations about which events naturally pair well. If working on acceleration, it makes sense to also work on high jump takeoffs since they have similar time programs.

If working on max velocity or short speed endurance, it makes sense to work on long jump takeoffs. While there aren’t many pole vault triple-jump combo athletes, coaches could plan bounding work with pole vault sessions.

Pair by Time of Force Application

Pairing event work according to the duration of power output will overlap with time programs. The idea is to work on events that have a similar force application. Think of this as a subgroup created by separating neuromuscular demands. For example, performing between-the-legs forward medicine ball throws helps potentiate for block starts.

Performing between-the-legs forward medicine ball throws helps potentiate for block starts. Share on X

In fact, we can build from a time programming pairing and prescribe the session’s workout based on the time of force application. If max velocity is the stressed quality of the day, then the weight room exercises of that day should complement the max velocity work performed on the track. Since max velocity running emphasizes high vertical ground forces and low GCTs, a natural weight room exercise following that session would be assisted jumps. We prescribe the day’s plan using similarities in the duration of force application.

Coaches can prescribe a day’s plan using exercises with similar duration of force application. Share on X

Within the track session, the athlete may perform 3-6 reps sprinting through a 20m zone at max velocity. Let’s call that 6-8 ground contacts per repetition. Executing an exercise like 4 sets of 8 reps of assisted jumps gives a similar time of force application. Linking these two exercises through similar power output durations reinforces the goals of the day.

This philosophy also makes the coach more conscious of total power output duration. This is critical because extended times of high power activities need to be carefully monitored to avoid overtraining and increasing the likelihood of injury.

To allow for the compensatory effects of high demand days and to minimize neural fatigue, low power output days should be included in an appropriate ratio.

Pair by Metabolic Demands

Pairing by metabolic demands resembles the time of force applications groupings, such as max velocity sprinting and assisted jumps. However, the differences between these two philosophies lead to important dividing lines when programming. For example, even though acceleration and max velocity work have different times of force application, they have essentially the same metabolic demands.

Organizing sessions according to energy system demands partitions workouts into one of three areas: activities that draw upon the alactic, glycolytic, or aerobic energy systems.

The alactic anaerobic (i.e., phosphate) system is the first energy system we use. It’s the muscles’ dominant energy source for roughly the first 10 seconds of high-intensity exertion. Next, the glycolytic (i.e., lactic) energy system takes over. This contributes most of the energy for as long as 90 seconds of activity. After a sustained bout of high-intensity exercise beyond 1.5-2 minutes, the aerobic system contributes the most energy. I’ve listed below example workouts grouped by metabolic demands:

  • Alactic: 3x3x30m starts (3’/8’) + heavy cleans and squats
  • Glycolytic: 5×45” runs at 85% (4’) + a general bodyweight strength circuit (3:1 work:rest)
  • Aerobic: 8x200m at 65% (2’) + a general bodyweight strength circuit (1:1 work:rest)

Pair by Technical Similarities

Organizing event work by technical similarities can be broken down into two important subgroups; we can pair exercises by the orientation of firing patterns (horizontal vs. vertical) or by rhythm. Each subgroup offers an approach we can use to link events.

Longer sprints (between 50m and 300m) feature high vertical ground forces and emphasize the elasticity of the athlete’s musculature and pairs naturally with high jump work. Building from that, the high jump and the javelin also have similar approach rhythms (similar penultimate steps and body posture).

A logical sequence of events for a session would be javelin work, followed by high jump work, followed by a speed endurance workout. Even though the high jump is paired with two different events for two different reasons, the sequence of these three provides a natural practice flow based on technical similarities.

Pair Using Meet Modeling

While it’s impossible to truly simulate meet conditions in practice, sequencing event work according to the meet schedule can pay dividends in an athlete’s preparedness to compete. In addition to the combined events, this practice can be useful for specific meets.

Sequencing event work according to the meet schedule can pay dividends in performance. Share on X

At a championship meet, for example, are the 110m high hurdles before or after the 400m intermediate hurdles? This helps dictate practice set-up. Likewise, many invitational meets will start field events one to two hours before track events. If the athlete might long jump before running the 60m dash, it makes sense to work long jump approaches before technical acceleration work.

For the combined-event athlete, this is particularly important since every multi-meet will follow the same schedule. Heptathletes always hurdle in their first event and then high jump. Because we know this, it makes sense to practice hurdles followed by high jumps in the same practice session.

Also, since high jumps require a relatively long GCT for a jumping event, an athlete could practice hurdle starts (working on acceleration, which has a relatively long GCT compared to max velocity running or speed endurance work) and then work high jump takeoffs.

Decathletes always high jump first and then run the 400m. As discussed earlier, pairing high jump work with longer sprint work can be successful because the firing patterns are similar. In each of these cases, high jump is paired with another event according to the meet schedule.

This can create a logistical challenge when a team includes both males and females. Since decathletes high jump in their first event and heptathletes high jump in their second event, this can create an extremely long practice for the coach.

To combat this, the coach must pick and choose event pairings to fit logistics. In this example, if the coach is intent on having the decathletes simulate running a 400m after high jumping, the coach can change the heptathletes’ practice so they also high jump first followed by speed endurance. This specific example works out well because heptathletes will high jump and run a 200m dash on the same day. The coach will plan a meet-specific day for the heptathletes for another time.

When planning based on meet preparation, coaches should realize that a combined-event athlete specifically needs to practice execution on back-to-back high neural days. Although I usually like following high-intensity CNS days with low-intensity general days, it’s important to have subsequent high-intensity days to prepare athletes for their two-day competitions.

During the general prep and specific prep phases, I like to alternate high and low days. This takes advantage of an alternating system’s benefits to build the best athlete possible, in the purest sense of the word.

Next, it’s vital to include back-to-back high-intensity days in the pre-competition and competition phases to help transition the athlete into the best combined-event athlete possible.

For decathletes, this includes working long jump and max velocity on the first day and then hurdles and vault work on the second day. For heptathletes, this includes working hurdles and high jump together on one day, followed by javelin and aerobic power work the next day.

For all combined-event athletes, it’s important they practice a technical event (hurdles or vault for men, long jump or javelin for women) the day after finishing a practice with speed endurance work. The more acclimated they are to executing events with high technical, speed, and power demands under neural fatigue from the previous day, the better they will perform in the meet.

Additional Thoughts, Guidelines, and Recommendations

  • During general and specific prep periods, begin sessions with technical work when the athlete is not fatigued. This is especially important for developing athletes. Regarding the microcycle, do more technical work at the beginning of the week when the athlete is fresher.
  • Use lower intensity days to emphasize a lot of technical work.
    • This provides the added benefit of increased motor unit recruitment and targets any residual muscle fibers not fully activated from the prior day’s session.
    • As high-intensity days become more intense, the lower intensity days require a shift in focus from building work capacity to recovery.
    • Complementary training can be used. The athlete, for example, would complete a hard long jump day on Monday followed by reinforcement through easy long jump drills on Tuesday, or javelin throws one day followed by javelin-specific medicine ball throws the next day.
  • When using a high-low scheme, do accelerations on Monday (Day 1 of the microcycle) to potentiate for max velocity work on Wednesday (Day 3 of the microcycle).
  • You don’t need to address every event every week, especially in the scholastic environment. Yes, in a professional environment, it’s common for decathletes to throw every day, but it’s not practical for students dealing with 15-18 credits and other extracurricular activities.
    • Keep in mind that each athlete has his or her own strengths and weaknesses that need to be addressed at varying levels. Many younger college decathletes may need to spend more time pole vaulting since it’s a difficult event to practice in high school.
  • You can use long jump approach work either as acceleration or max velocity fly work, depending on the length and rhythm of the athlete’s approach.
  • It’s important to use all of the philosophies I’ve mentioned to develop a multilateral approach to training.
  • Pair weight room exercises and plyometrics accordingly, not just event work. For example:
    • Deep box squats and broad jumps on acceleration days (overcoming inertia).
    • Clean-grip snatches and explosive hurdle hops on max velocity days (explosive lift with a large amplitude).
  • Don’t forget the importance of general days.

Sample Programs

Here are two sample programs that employ these ideas. First is a brief, two-microcycle layout for a decathlete during his specific prep phase using a reverse step loading pattern:

Table 2. Two-microcycle layout for a decathlete during specific prep phase using a reverse step loading pattern.
Monday (Acceleration theme) Tuesday (General) Wednesday (maxV) Thursday (General) Friday (Tech) Saturday (Int. Tempo/Speed End) Sunday
Microcycle 1 Hurdle starts (5x2H), High jump work (short approach jumps) All on grass field: Long jump takeoff work over mini-hurdles, Extensive tempo (2,000m), Med ball circuit 4x Sprint-Float-Sprint 90m (30-30-30) Shot put technique work followed by a general strength bodyweight circuit Hurdle technique work (1-step and 3-step drills, 80% drill (4x6H)) Short approach vaults, followed by javelin work, and then speed endurance (4x120m @ 98%, 8-10′) REST
Weight room: Power cleans (4×3 @ 85%), Heavy box squats, Incline bench press (4×3 @ 85%) Weight room: Assisted jumps (4×8), Clean-grip snatches (4×3, light), Dynamic step-ups (3x6ea) Weight room: Special exercises (1-leg cleans, Step-ups into a push press, etc.)
Microcycle 2 Hurdle starts (4x3H), Long jump (approaches with and without takeoff) High jump work (curve running), javelin technique work, combination of extensive tempo (1600m) and bodyweight exercises Pole vault full approaches, 4x flying 30s (30+30) Discus technique work followed by an aerobic capacity workout in the pool Hurdle technique work (1-step and 3-step drills), Shot put work (~15 total throws) Javelin work, Speed endurance: 3x120m @ 98% (10′) REST
Weight room: Power cleans (4×3 @ 80%), Heavy box squats, Incline bench press (4×3 @ 80%) Weight room: Assisted jumps (3×8), Clean-grip snatches (3×3, light), Dynamic step-ups (3x6ea) Weight room: Special exercises (1-leg cleans, Step-ups into a push press, etc.)


As you can see, the event work is paired at various points according to time program, power output, metabolic demands, rhythm, and meet specificity.

In Week One, the athlete will high jump fresh on Day 1 and then work long jump takeoffs while sore on Day 2. In Week Two, he will long jump fresh on Day 1 and then work high jump while sore on Day 2. He gets practice pole vaulting while fatigued to simulate meet conditions (Week 1, Day 6). Day 3 of both weeks is a very high-intensity max velocity day on the track paired with assisted jumps and clean-grip snatches in the weight room. Each of these days is followed by a very easy general day to allow the athlete to recover.

Next, I’ve included a sample microcycle for a high school athlete in her pre-competition phase. She trains only four sessions per week and competes in the hurdles and long jump. She has very limited weightlifting experience, and in this case, the coach is using a forward step loading pattern:

Table 3. Sample microcycle for a high school athlete in her pre-competition phase.
Monday (Acceleration theme) Tuesday (General) Wednesday Thursday (maxV) Friday Saturday (Speed End) Sunday
Microcycle 1 -Hurdle starts (5x2H, 4’)
-LJ takeoff drills and short approach jumps
-Bounding
All on grass field:
Extensive tempo (1,200m), Med ball or General strength circuit
REST -4 Full LJ approaches
-LJ takeoff and/or landing drills
-4x Flying 10’s
REST -Speed bounding
-Speed end. HH workout/race modeling: 3xfull Hurdle race (H5-H7 pulled out; 10’)
REST
Weight Training:
-DB Front squat+push press combo (3×5)
-DB Bench press (3×5)
-DB RDL (3×6)
Weight Training:
-DB Jump squats (4×4)
-DB Push press (4×4)
-DB Bench press (4×4)
Microcycle 2 -6 full approach LJ run-throughs
-Hurdle starts (5x3H)
On grass field:
LJ takeoff work, Extensive tempo (1,600m), Med ball circuit
REST -4x6H (80% drill)
-3×20-20-20 (Sprint-Float-Sprint, 5’)
REST -6x Short approach jumps
-Speed endurance: 2x2x80m @ 98% (8’/12’)
REST
Weight Training:
-DB Front squat+push press combo (4×4)
-DB Bench press (4×4)
-DB RDL (4×6)
Weight Training:
-DB Jump squats (5×4)
-DB Push press (5×4)
-DB Bench press (5×4)


I hope you enjoyed reading this as much as I did writing it and please leave any comments or questions you have below. Special thanks to Nick Newman for his immense support and guidance throughout the past few months and for the years to come.

Since you’re here…
…we have a small favor to ask. More people are reading SimpliFaster than ever, and each week we bring you compelling content from coaches, sport scientists, and physiotherapists who are devoted to building better athletes. Please take a moment to share the articles on social media, engage the authors with questions and comments below, and link to articles when appropriate if you have a blog or participate on forums of related topics. — SF


References

  1. Elliott, Bruce, and J. Mester, eds. Training in Sport: Applying Sport Science. Chichester: J. Wiley & Sons, 1998.
  2. Smith, Joel. “Why is Ground Contact Time Important in Plyometrics.” verticaljumping.com. 2014. Accessed July 12, 2016.
  3. Newman, Nick, and Dr. Phil Graham-Smith. “Beyond the Force Velocity Curve with Assisted Jumps Training.” SimpliFaster (blog). July 13, 2016. Accessed July 31, 2016.
  4. Lefever, Dan. “Considerations in Coaching the Combined Events.” U.S. Track & Field and Cross Country Coaches Association. Dec 19, 2012. Accessed July 18, 2016.
  5. Broadbent, Eric. “Multi-Events Training Part 1.” Speed Endurance. Jan 6, 2014. Accessed July 14, 2016.
  6. Broadbent, Eric. “Multi-Events Training Part 2.” Speed Endurance. Jan 14, 2014. Accessed July 14, 2016.
  7. Broadbent, Eric. “Multi-Events Training Part 3.” Speed Endurance. Jan 21, 2014. Accessed July 14, 2016.
  8. Rovelto, Cliff. “Three C’s of Combined Event Training.” USA Track & Field. July 1, 2016.
  9. “Report from the Combined-Events Committees (Decathalon & Heptathalon).” USTFCCA. USA Track & Field. Dec 13, 2006. Accessed July 2, 2016.
  10. Hierholzer, Kyle W. “Coaching the Multi-event Athlete.” Colorado High School Coaches Association. Accessed July 12, 2016.
  11. Sunquist, Eli. “Combined Events Training for the High School Athlete.” Elite Track and Field Training. Accessed July 8, 2016.
  12. Schexnayder, Boo. “Periodization Models for Speed Development Support.” National Strength and Conditioning Association. July 6, 2016. Accessed July 16, 2016.
  13. Burnett, Angus. “The Biomechanics of Jumping.” ELITETRACK Sport Training & Conditioning. Accessed July 1, 2016.
  14. Veney, Tony. “Sprints: Training the Energy Systems.” Coaches Education. Accessed July 24, 2016.
Deadlift Barbell and Weights

The Less-Traveled Road: Frans Bosch’s Path to Contextual Strength Training

Blog| ByKen Jakalski


Deadlift Barbell and Weights

As a high school coach, I’m often asked questions about strength training. This includes the question: “Have I evolved beyond the deadlifting protocol that Barry Ross outlined in his book, Underground Secrets to Faster Running?” The answer is “No.” I’m still using his program because it’s a time-saving and efficient way to get my population of athletes stronger.

Another question I’m asked is: “Can I really say that a steady diet of deadlifting is making my athletes faster?” My answer to this is, “Yes,” and I have evidence from the “Barry Project” that I conducted back in 2005, and then detailed in a series of posts over at Mel Siff’s Supertraining group on Yahoo. Ross actually flew out from the West Coast to meet with the “test subject,” observe his training, and assess his progress.

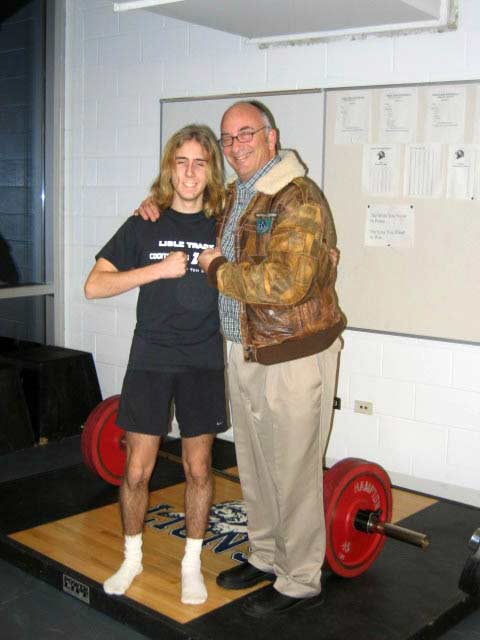
Steve Desitter and Barry Ross
Figure 1. Steve Desitter and Coach Barry Ross


A Decade-Old Training Protocol

Before the program started, my hypothesis was that a two-month program of a very specific strength protocol (the one outlined in Ross’s book), would not impact the ability of a high school athlete to achieve significant gains in speed over essentially the same amount of time.

The project had only one test subject—a respectable senior distance runner (10:03 in the 3200) who had no background in any strength training, and had shown no improvement in short speed tests (fly 30’s up to fly 75’s) in the previous three years.

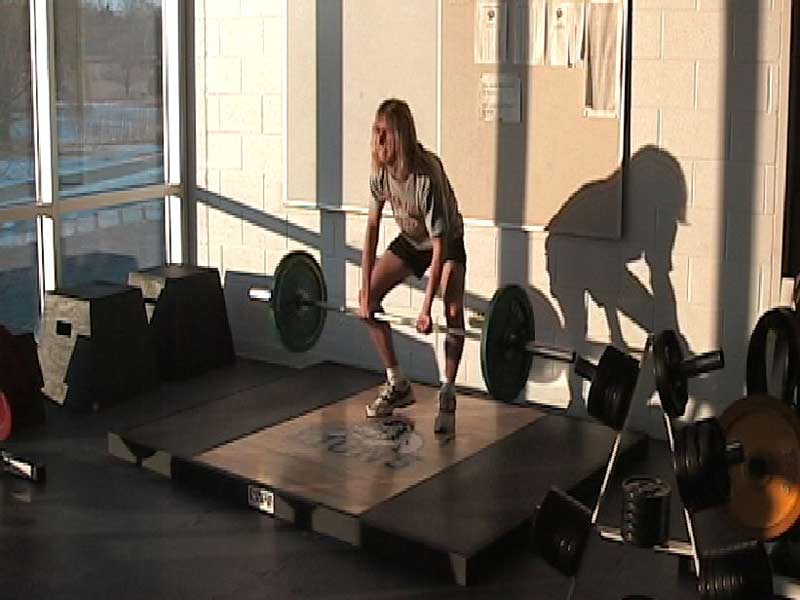
The program began on December 12, 2005. In the first trial, even after preparatory instruction on the mechanics of the lift, the athlete struggled to pull his own body weight (127 pounds), rolled forward on the balls of his feet, and generally revealed what not to do in the deadlift. Seeing this, Ross acknowledged that I had not given him an “easy” subject for this experiment.

Barry Ross Project Day One
Figure 2. Steve Desitter performing a deadlift on his first day of the Barry Ross Project.


However, the athlete progressed quite dramatically. By January 26, 2006, he was deadlifting four sets of three reps at 280 pounds.

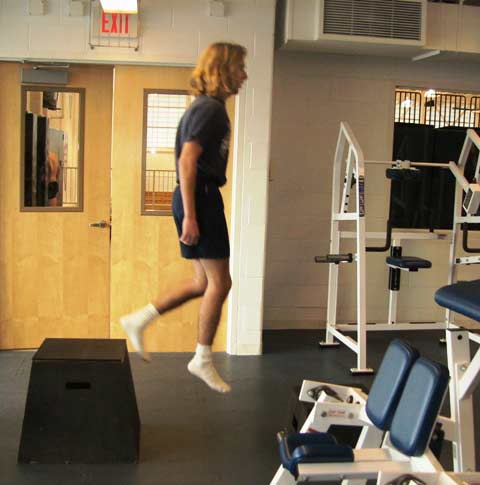
His perception of effort was “good” for each lift. He followed each deadlift set with plyos—falling from a 20-inch box and jumping over two 8-inch boxes. He did five repeats of these jumps, and then took a full five-minute recovery until his next set of deadlifts.

Barry Project Plyometrics
Figure 3. Steve performs plyometrics from a 24″ box.


Our test athlete also did his push-ups and core exercises as per Ross’s protocol. We then went to the track and set up to run our fly 75’s. We generally don’t do these runs until we are outdoors in late March. However, we caught a 50-degree day, and the test subject was anxious to see what he could run, especially since his efforts in his plyos (surprisingly low contact times) indicated that he might be able to deliver on some of the strength gains he had achieved in the previous six weeks.

Before this, his best fly 75 was 9.56, which he ran in April of his junior year. For his fly 75’s on the day of the testing, he accelerated for 20 meters before the beginning of the timing zone. His first run was 9.26; an improvement from 7.8 m/s to 8.1 m/s. We timed all efforts through infrared beams, and the wind was +2.6 m/s.

He ran a second trial, and his time was 9.46 ( after a five-minute recovery). He was less aggressive in his acceleration to the first beam, and he felt that he would have been even faster if he’d approached the fly-in zone more aggressively. I confirmed his self-analysis, since I filmed a fixed 15-meter segment during each trial (10 meters prior to the second beam).

” data-setup='{}’>
Video 1: Slow motion video of Steve that shows his stride length.

What is most interesting is that he hadn’t put in any mileage since mid-November (the end of cross country). He typically began training with the distance runners in late February, and his best race performances over 1600 and 3200 meters usually occurred in May.

His top five marks in the 3200 in his sophomore and junior years were: 10:03.16 (5/20/05), 10:07.01 (5/13/04), 10:08.17 (5/07/05), 10:09.00 (4/30/04), and 10:09.62 (05/15/05).

As a sophomore, he recorded his best fly 75 of 9.57 in March 2004. The speed change from his sophomore to his junior year showed no substantial improvement in time (9.57 to 9.56), and off-season mileage and in-season training were exactly the same. Incidentally, the fastest fly 75 in our program over the past two years has been an 8.53, and that was recorded by our top sprinter.

A performance jump this early is quite substantial. I would have normally waited at least another four or five weeks before attempting a speed trial, but he felt very good. He was also anxious to see if this strength protocol alone could have an impact on his short speed even after just five weeks of training, with no base conditioning or sprint work.

His confidence was based upon how well he was executing his plyos. Historically, my best single-leg bounders have been my fastest sprinters, and his elastic response was quite impressive for someone who seldom races below 1600 meters.

He was very pleased, and felt that this minimal investment in time (the entire strength workout takes less than 45 minutes per session, and most of that is in recovery) had a huge upside.

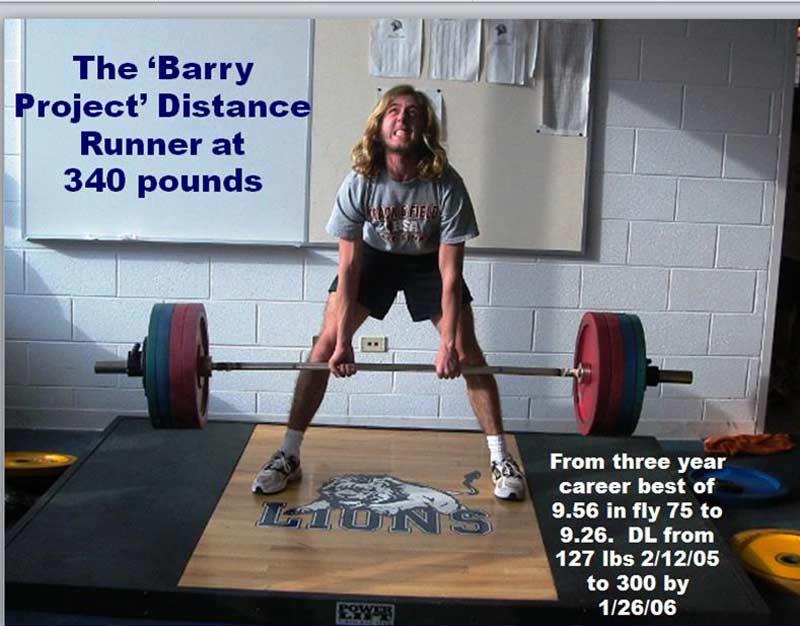
How strong did he get during the protocol? He topped out at an amazing 340. He hit that in the last week of March, before we moved outside.

Steve Desitter Barry Project
Figure 4. Distance runner lifts 340 pounds in the Barry Project.


Despite a pulmonary infection during the outdoor track season, he ran 2:08.87 in the 800 and earned a spot on our state qualifying 4×800 relay. His previous season’s best was 2:18.75.

So, can I draw the conclusion that this approach to strength gain is the best way to help athletes achieve faster speeds?

No. Many factors could have come into play for this impressive success story. Maybe it had something to do with giving our test subject a variation in training from logging all the heavy winter mileage he had done in his previous two years. Maybe it was not having any strength training “bias” from some other strength gain protocol (which I thought was important for this test). Maybe it was the Hawthorne Effect—knowing that he was being filmed and closely observed throughout each day of training. Even the wind that test day might have influenced his performance.

Since that first experiment, I have used Ross’s program with all of my cross country and track athletes. As much as I like the gains that athletes have made over the years in terms of the weight they pulled from the beginning to the end of each season, as with the “Barry Project” itself, so many other variables could have accounted for the speed gains they experienced.

Though I’ve been satisfied that I may be doing something positive for all athletes in the program, I need to answer one overarching question: How does the amount of force produced via heavy strength training relate to the amount of force produced during high speed running?

Disputing the ‘Holy Grail’ of Sprinting

This was the question that Dr. Mike Young, Carl Valle, and Vern Gambetta brought up years ago, and they were right to pose it. Each of them noted that many runners who can pull a lot of weight are not very fast, and many top sprinters are very fast without ever touching a weight

Frans Bosch, whose contemporary insights on strength training have generated considerable interest in the coaching community, said something very similar:

“The strongest athletes are by no means always the fastest sprinters, and evaluation of training always shows that, in somewhat technically complex sports, increased force production does not automatically lead to improved performance.”

There is no disputing what any of them are suggesting. The issue that coaches must acknowledge is something that Bosch often points out: Peak force production in sprinting is larger than what athletes can achieve through maximal voluntary contractions via strength training.

So, how do I respond to the next point that Bosch brings up in his recent book, Strength Training and Coordination: An Integrated Approach?

“If the maximal force that can be produced during strength training is less than what is encountered during high speed running, then strength straining provided no purpose when it comes to overloading.”

If this is the case, how do I explain the impressive gains in speed from my senior distance runner when following the program that Ross carefully outlined?

Bosch seems to have an answer for this.

“Highly trained endurance athletes reach a ceiling in their oxygen uptake. Great mileage will not improve it. However, athletes who wish to increase their V02 max still further can consider maximal strength training as a means of doing so, for improved recruitment will bring more muscles into play.”

When asked about strength work and its relation to the program outlined in his presentation on Critical Velocity Training for distance runners, Tom “Tinman” Schwartz said the following “It’s less important the faster you are.”

I really like that insight because it relates to something Bosch acknowledged in his book: “In beginners, strength training does have a positive impact on some aspects of rate of force development.”

Maybe this has something to do with the simple fact that younger, less-experienced athletes can make big gains through strength training. The more advanced they are in terms of training age and development, the more they need the kind of variation in training that Bosch advocates.

After hearing Bosch speak on two different occasions, and listening to his insights on conventional strength training as a “dead end street,” I have come to understand why he believes that, “overload has to mean more than just ‘more and heavier.’”

Avoid trying to find one set of exercises that contains the secret to running success. Share on X

Perhaps he is right. Coaches might be wise to avoid trying to find that one set of exercises that contains the secret to success. As he notes, “There are no Holy Grails in training.” Ironically, Underground Secrets was the title of Ross’s book and, in an article for Dragon Door, Ross refers to the balance between strength gain and changes in body weight as the “Holy Grail of sprinting.”

Current Views on Strength Training

What I have done in recent years is incorporate some exercises that Bosch believes are “particularly good for standardizing and proving this fundamental cooperation between hamstrings and back muscles.”

I now do some single leg deadlifts, which I call SLEDS, and some bench step-ups. I like his analysis of the hang clean, because it does engage the hamstrings isometrically and, unlike a high pull, has what he refers to as an “outcome and intention.” These do provide training variation, which he believes is the “key to efficient coaching.”

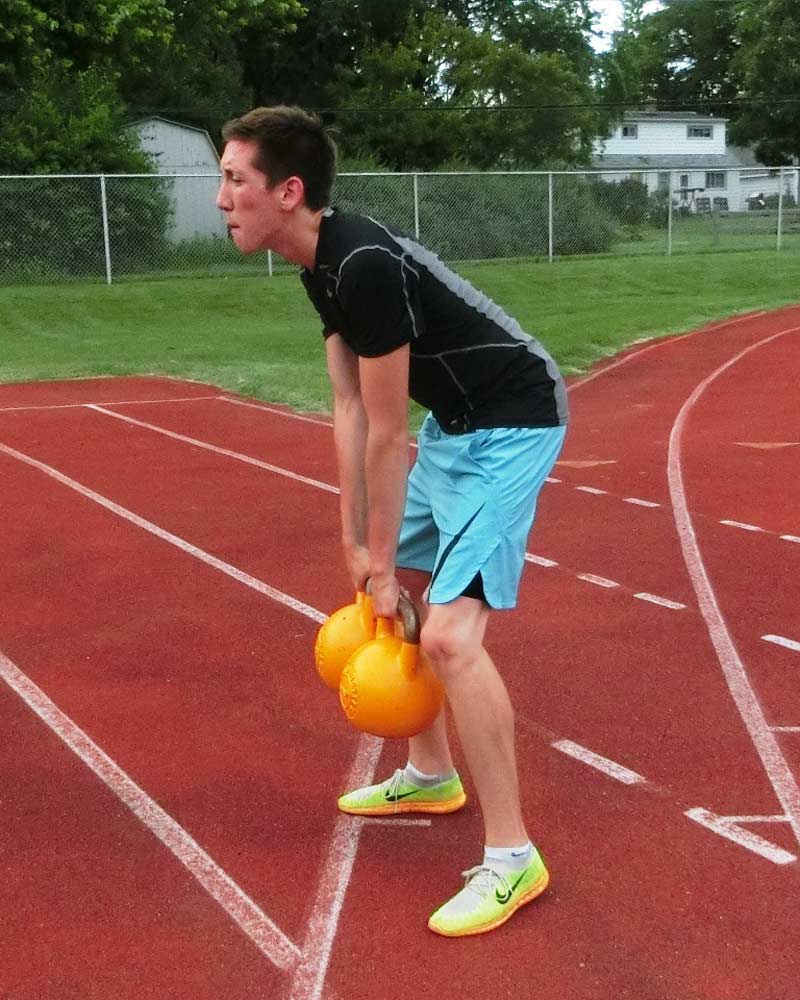
Hang Clean with Kettle Bells
Figure 5. Athlete performs a version of the hand clean with kettle bells.


Bosch’s book has certainly generated some interest from a training community still somewhat skeptical about such a radical departure from the conventional views on strength training. As Peter Ward noted, “If we have general resistance training for sport on one end of the spectrum… and we have highly specific exercises in the gym that are supposed to get the largest amount of transfer to sports skill on the other end of the spectrum, I would have to say that Bosch is all the way on the highly specific end of the spectrum. I tend to be a more middle-of-the-road type of guy.”

Others offer support for not abandoning these conventional approaches. Jay Dicharry notes that peak forces in running are a product of body mass and running speed. “The faster you go,” he says, “the more strength you need to counter these high forces.”

Steve Magness makes a similar case: “Since we know that force requirement is what determines muscle recruitment, it only makes sense that heavy lifting or high force activities will maximize fiber recruitment.”

Carl Valle commented on one of his blogs that Bosch’s exercises, “seem to only add more complexity to exercises that need less complexity.” But Carl does suggest that coaches buy Bosch’s book and read it for themselves. Challenging his concepts first requires knowing what those concepts are.

Vern Gambetta, who has carefully studied the material, takes a favorable view of Bosch’s insights, and appreciates how they have stimulated his own thought process on the relationship between strength and performance. He noted in his blog that, “My frustration starting with my time as an athlete and extending deep into my coaching career was [not seeing] a commensurate return in performance from the time I invested in strength training. In many respects this is an endless search, but thinking of strength training as coordination training with appropriate resistance is a giant step forward. If nothing else, it will make us more efficient in utilization of time, along with a greater chance of transfer. We need to challenge ourselves in the area of strength training, to break away from conventional wisdom, and seek out new possibilities for improvement. This approach has challenged me.”

So, what conclusion might we draw from the various perspectives that highly respected coaches and trainers have taken on this issue? Perhaps it is to keep an open mind, and experiment for ourselves. As the legendary coach, Joe Vigil, noted in his recent presentation at the Midwest Distance Running Summit, “There are many roads that lead to Rome.”

In terms of how we train our athletes, if we choose the road less traveled, perhaps it will make all the difference in the world.

Since you’re here…
…we have a small favor to ask. More people are reading SimpliFaster than ever, and each week we bring you compelling content from coaches, sport scientists, and physiotherapists who are devoted to building better athletes. Please take a moment to share the articles on social media, engage the authors with questions and comments below, and link to articles when appropriate if you have a blog or participate on forums of related topics. — SF


References

  1. Bosch, Frans. Strength Training and Coordination: An Integrative Approach. Rotterdam: 2010 Publishers, 2015.
  2. Dicharry, Jay. Anatomy for Runners: Unlocking Your Athletic Potential for Health, Speed, and Injury Prevention. New York: Skyhorse Publishing, 2012.
  3. Jakalski, Ken. “Progress of Distance Runner,” on Mel Siff’s Supertraining Yahoo Group. January 27, 2006.
  4. Magness, Steve. The Science of Running: How to Find Your Limit and Train to Maximize Your Performance. San Rafael: Origin Press, 2014.
  5. Ross, Barry. Underground Secrets to Faster Running: Breakthrough Training for Breakaway Running. Raleigh: Lulu Press, 2005.
  6. Schwartz , Tom. “Critical Velocity.” Lecture presented at The Running Summit Midwest 2016, Benedictine University, Lisle, Illinois, June 25-26, 2016.

  7. Vigil, Joe. “Effective Tapering.” Lecture presented at The Running Summit Midwest 2016, Benedictine University, Lisle, Illinois, June 25-26, 2016.
Male Athlete Performs Olympic Power Clean

Exercise Selection for High-Intensity Training

Blog| ByCody Bidlow

Male Athlete Performs Olympic Power Clean

It’s important for coaches and athletes in high-intensity sports to consider exercises for strength, power, RFD, and impulse when planning a training regimen.

It’s also important to have a guiding philosophy. To begin developing a philosophy, a logical set of questions to ask are:

  • What am I trying to do?
  • How am I going to do it?
  • Why am I doing it this way?

Keep the philosophy simple, so the training plan does not become overly complicated and ineffective.

During any discussion regarding resistance training for sports performance, it’s important to bear in mind the SAID principle (Specific Adaptation to Imposed Demands). While coaches often use the term, not all think critically about what qualifies as specific and what does not.
We may have a conceptual idea of one method, position, speed, or movement sequence as being specific, but in reality, we may be wrong. Still, it’s important to push the boundaries of thought and strive toward sport specific training. A lot of research shows that the way in which we train has a direct and specific effect on training outcomes.

This is what we mean by specificity:

  • How fast or slow we actually lift a load
  • How fast or slow we intend to lift a load
  • The force vectors in which we direct training loads
  • How we move throughout the duration of an exercise
  • Eccentric, isometric, and concentric demands
  • Joint positions and muscle activation sequences

Because training adaptations are specific, it’s wise to consider both the context of training transfer as well as the need for variation. Avoid getting hooked on one specific exercise or one way of performing an exercise. Instead, use a variety of exercises or exercise subsets that contribute to the sports performance outcome. Use different bars, stances, tempos, and loads to create a holistically developed athlete. Our goal as athletes and coaches is to prepare for sport, not to prepare for a single lift in the weight room.

Use different bars, stances, tempos, and loads to create a holistically developed athlete. Share on X

Terms

Before we dive any deeper, here are terms you ought to know.

  • Force: defined as mass multiplied by acceleration. Any time we attempt to move ourselves or an object, we exert some amount of muscular force.
  • Strength: the skill and ability to produce force.
  • Rate of Force Development (RFD): the rate at which we produce increasing amounts of force during an effort. RFD is measured in Newtons per second.
  • Ground Reaction Force (GRF): the exchange of forces that occurs when an object is in contact with the ground. The direction and magnitude of force that goes into the ground and is then exerted back onto the athlete is the GRF.
  • Impulse: the application of force over a period of time which causes a change in momentum. Force multiplied by time is equal to its impulse.

As enthusiasts and professionals in the world of sport, we want to develop the high-intensity qualities of strength, power, RFD, and impulse. Why are these factors important?

  • Strength is the underlying quality of all movement. An explosive athlete must have a requisite level of strength to be competitive and avoid injury.
  • Power is the quality that determines how much work we can do in how little time. Running fast and jumping high require a large amount of work in a small amount of time, and developing power is a logical practice to undertake.
  • RFD capabilities allow us to produce more force at an earlier point in a muscle contraction. Our power output is related to RFD because producing more force at an earlier point in time allows us to do more work in less time.
  • Impulse directly causes the amount of movement we produce in an explosive action. It can be manipulated by changing either the force exerted or the amount of time in which to exert it. In the blocks, impulse can be adjusted by block placement. If we create a more flexed hip position on the front leg of the blocks, we can push on the front block for a longer time and create a larger impulse and starting velocity upon block clearance.

Knowing these qualities is great, but how do we develop them? As is the case in other areas of life, there are many ways to do this and even more opinions on which are best. It’s important to optimize training by looking at these qualities and determining how they reflect the demands of the athlete’s given sport. Develop programs with these factors in mind.

The following section will give ideas of where to begin and how to structure a training program to develop high-intensity capabilities.

Strength Development

From a programming perspective, building basic levels of strength is not complicated. Until we reach the elite levels of lifting, the basic approach to getting strong is to lift heavy objects with proper form while targeting joint movements and muscle groups that are used in sport. While nearly any challenging lift will make us stronger in some regard, we must always try to get the best bang for our buck.

When selecting exercises for strength development, I prefer movements that activate large amounts of tissue and don’t require the athlete to move around or leave the ground in a very significant way.

For the sake of this article, I’ll refer to these movements as being static. The athlete stays in place while doing the movement and does not leave the ground or move across the ground for the duration of the set.

Why? If we truly challenge ourselves in an exercise such as the squat or deadlift, the load used to produce strength gains should be heavy enough to prevent dynamic movement. From a safety perspective, it’s safer to lift heavy with static movements than to try and overload a dynamic movement.

Useful exercises for strength development:

  • Squat Variations: Back squat, front squat, box squat, goblet squat, safety bar squat, cambered bar squat, dumbbell front squat, rear leg elevated split squat, and hex bar squat.
  • Deadlift Variations: Straight bar deadlift, hex bar deadlift, block pull, rack pull, and heavy kettlebell deadlift.
  • Hip Thrust Variations: Barbell hip thrust, single leg hip thrust, standing band hip thrust, heavy band hip thrust, and heavy band pull through.
  • Press Variations: Straight bar bench, floor press, dumbbell bench press, bench with a block, incline bench press, and shoulder press.
  • Hyper/Extension Variations: 45-degree hyper, reverse hyper, bent leg hyper, and semi-bent leg hyper.

These exercises recruit large amounts of tissue over various regions of the body. Given that the body responds proportionally to the stress applied, large movements that activate large amounts of tissue will lead to a proportionally large response from the body. This response includes acute and chronic hormonal, structural, and neural changes.

Less experienced and weaker athletes will see improvements with lower intensities, such as lifting 60-70% of their 1-rep maximum with slightly higher rep ranges (such as 5-8 reps). As athletes become stronger and more proficient in their lifting skills, intensities can increase and the reps can decrease, allowing for long-term development through intensification over time.

A 14-year-old kid who weighs 140 pounds doesn’t need to max out to get stronger but a 300-pound rookie in the NFL might. At a certain point in an athlete’s career, it may be wise to shift toward maintaining absolute strength levels. In this case, intensities or volumes of absolute strength work can be reduced to prevent fatigue and risk of injury.

A 140-lb teen doesn't need to max out to get stronger but a 300-lb NFL rookie might. Share on X

Power Development

Developing power should be high on the priority list for athletes who need to run fast, jump high, jump far, or hit hard.

From a physics standpoint, power = work/time. In sports, a more understandable definition is power = force x velocity. Therefore, training for power requires two basic components: large forces and relatively high velocities. Many people instantly think of bar velocity, but we also need to consider limb and whole body velocities when programming for power development.

When programming for power development, coaches should consider limb and whole body velocities. Share on X

As with strength, we want to use exercises that stimulate large amounts of tissue. In contrast to strength development, power development requires exercises that are more dynamic where athletes move through space as they complete a movement. These movements include leaving the ground vertically, translocation horizontally, or otherwise.

While we can develop power with a static lift like a squat or bench press, basing a power development program on static lifts will sell our athletes short in the long run. The same goes for solely using Olympic lifts for maximal strength development; this won’t optimize an athlete’s strength development.

Depending on the individual, loads for power development should be chosen based on their scientifically proven efficacy, their relation to the demands of the athlete’s sport, and the athlete’s level of strength and power development (Stone et al. 2003).

For example, when using the back squat for power development, studies have shown that loads in the 40-60% range produce power outputs similar to loads around 90%. The take-home point is that speed athletes can use the lower loads, while load bearing athletes, such as offensive linemen, can use the higher loads. Both are working in power production zones that are optimized for the demands of their sport.

Useful exercises for power development:

  • Olympic Lifts: Power clean, power snatch, hang clean, and mid-thigh clean pull.
    • Load the hang cleans at 70-90% to emphasize force characteristics of power (Bevan et al. 2010).
    • Load the mid-thigh clean pulls at 40% of 1-RM power clean to emphasize velocity components of power (Comfort et al. 2012).
  • Jump Squats
    • 42% back squat 1-RM to maximize hip power, 0% to maximize knee and ankle power (Moir et al. 2012).
    • Slightly lighter loads emphasize force while slightly heavier loads emphasize velocity.
    • Weaker athletes should use loads that are relatively lighter while stronger athletes can use loads which are relatively heavier (Stone et al. 2003).
  • Kettlebell swings
    • Kettlebell swings from 16kg-32kg and jump squats from 0-60% of 1-RM can outperform back squats in peak power and mean power outputs (Lake, Lauder 2012).
    • I prefer to add a band, encouraging a faster eccentric movement and a greater need for creating a large horizontal impulse.
  • Squats at either 40-60% or at 90% of 1-RM (Zink et al. 2006).
    • Speed athletes can benefit from the 40-60% range due to the same power output at a higher velocity; load bearing athletes, such as a football lineman, will benefit from the 90% load due to their need to express power in a loaded situation.
  • Jumps
    • Unilateral horizontal drop jump distance is the best predictor of sprint distances up to 20m, except for 5m sprint time which is best predicted by unilateral vertical drop jump rebound height (Schuster, Jones 2016).
    • A short-term program of hurdle hops & depth drops increases absolute power, relative power, and maximal pedaling velocity (Chelly et al. 2010).
    • Horizontal jump tests have stronger correlations with acceleration performance due to the horizontally oriented force application of sprint acceleration.
    • Vertical jump tests correlate to maximal velocity sprint performance, likely due to the vertical nature of force application at top speed.

Rate of Force Development

As an athletic quality, RFD determines how quickly we can produce a given amount of force. Two athletes may be able to apply the same amount of absolute force to an object (such as a bar), but the athlete who reaches that level of force production sooner (for example, at 250ms vs. 500ms) is the more explosive athlete.

Faster athletes will spend less time on the ground compared to slower athletes. Share on X

In a race involving athletes with a range of skill levels, the faster athletes will spend less time on the ground compared to the slower athletes. This is due to their superior RFD capabilities (as well as their ground contact mechanics). Training enhanced RFD can result from shifts in fiber type, changes in muscle-tendon unit stiffness, increased early phase neural drive (50ms into an explosive effort), and changes in muscle fascicle length (Shoenfeld 2016).

When training to enhance RFD, it’s good to start with heavy loads and relatively fast velocities. Also, have the intent to go from zero force production to maximal force production in the shortest time possible. If an athlete lifts in a very controlled manner, they won’t spur much development in their RFD. In fact, they might experience negative effects on their RFD capabilities.

If athletes lift in a very controlled manner, they won’t spur much development in their RFD. Share on X

Useful exercises for training RFD:

  • Mid-thigh clean pulls done at 120-140% of 1-RM power clean load (Comfort et al. 2012).
  • Mid-thigh hang cleans between 30-90% (Suchomel et al. 2014); some studies report peak numbers at 30%, 60%, and 90%. Keep in mind the demands of each athlete when determining load.
  • Sled pulls weighted on the heavier end of the spectrum will have a sprint specific impact on RFD, noted in one study as 20% of body mass (Martínez-Valencia et al. 2015).
  • As a side note, heavier sled loads have more effect on early acceleration where force characteristics are more important. Lighter sled loads have a greater impact on late acceleration due to the speed demands of late acceleration.

Impulse

Impulse causes the change in an object’s momentum; for example, when a shot put is launched or when an athlete’s body is projected with each step of an acceleration sprint.

Expressed mathematically as force x time, impulse is influenced by the amount of force produced as well as the time over which that force is exerted. The reason quick athletes with high frequencies during early acceleration are not very fast is that they don’t produce enough impulse. They raise their foot off the ground without applying force for a long enough time period.

Sprint acceleration performance and mean speed over 40m is strongly correlated with horizontal propulsive impulse while vertical propulsive impulse is not. Athletes and coaches in sports that rely on acceleration need to bear this connection in mind because improving horizontal propulsive impulse will likely improve acceleration sprint times.

Improving horizontal propulsive impulse will improve acceleration sprint times. Share on X

Though sparse, there is some research available regarding various exercises and impulse. Horizontal propulsive impulse should be of particular interest to sprint athletes and coaches.

Useful exercises for developing impulse capabilities:

  • Sled sprints, depending upon the harness placement.
    • Attaching the harness at the waist produces greater net horizontal impulse, net horizontal mean force, propulsive impulse, and propulsive force compared to using a shoulder harness (Bentley et al. 2016).
    • 20% body mass loads have greater ground reaction impulse compared to 10% load conditions (Cottle et al. 2014).
  • Kettlebell swings produce a greater impulse than back squats and jump squats (Lake, Lauder 2012).
    • Hip hinge kettlebell swings can develop horizontal impulses.
    • Attaching a band at a certain height can shift the force vector according to preference because the angle of the band influences the force vector throughout the movement.

Conclusion

There are many considerations when it comes to exercise selection for high-intensity training.

Consider force vectors, which are the direction and magnitude in which a load is directed. Does the athlete need to develop axial qualities or anteroposterior qualities?

Consider the demands of an athlete’s sport, and choose relative loads accordingly. If a sprinter produces the same power output using a 40% load and a 90% load, maybe they should stick to the lighter, faster loads.

By optimizing training to the needs of the athlete, time and energy can be directed and utilized in an optimal fashion.

Since you’re here…
…we have a small favor to ask. More people are reading SimpliFaster than ever, and each week we bring you compelling content from coaches, sport scientists, and physiotherapists who are devoted to building better athletes. Please take a moment to share the articles on social media, engage the authors with questions and comments below, and link to articles when appropriate if you have a blog or participate on forums of related topics. — SF

References

  1. Bentley, I., Atkins, S. J., Edmundson, C. J., Metcalfe, J., & Sinclair, J. K. (2016). Impact of Harness Attachment Point on Kinetics and Kinematics During Sled Towing. Journal of Strength and Conditioning Research, 30(3), 768-776. doi:10.1519/jsc.0000000000001155
  2. Bevan, H. R., Bunce, P. J., Owen, N. J., Bennett, M. A., Cook, C. J., Cunningham, D. J., Newton, R.U., & Kilduff, L. P. (2010). Optimal Loading for the Development of Peak Power Output in Professional Rugby Players.Journal of Strength and Conditioning Research, 24(1), 43-47. doi:10.1519/jsc.0b013e3181c63c64
  3. Chelly, M. S., Ghenem, M. A., Abid, K., Hermassi, S., Tabka, Z., & Shephard, R. J. (2010). Effects of In-Season Short-Term Plyometric Training Program on Leg Power, Jump- and Sprint Performance of Soccer Players. Journal of Strength and Conditioning Research, 24(10), 2670-2676. doi:10.1519/jsc.0b013e3181e2728f
  4. Comfort, P., Udall, R., & Jones, P. A. (2012). The Effect of Loading on Kinematic and Kinetic Variables During the Midthigh Clean Pull. Journal of Strength and Conditioning Research, 26(5), 1208-1214. doi:10.1519/jsc.0b013e3182510827n
  5. Contreras, B., Vigotsky, A. D., Schoenfeld, B. J., Beardsley, C., Mcmaster, D. T., Reyneke, J., & Cronin, J. (2016). Effects of a six-week hip thrust versus front squat resistance training program on performance in adolescent males. Journal of Strength and Conditioning Research, (ahead of print). doi:10.1519/jsc.0000000000001510
  6. Cottle, C. A., Carlson, L. A., & Lawrence, M. A. (2014). Effects of Sled Towing on Sprint Starts. Journal of Strength and Conditioning Research, 28(5), 1241-1245. doi:10.1519/jsc.0000000000000396
  7. Higashihara, A., Ono, T., Kubota, J., Okuwaki, T., & Fukubayashi, T. (2010). Functional differences in the activity of the hamstring muscles with increasing running speed. Journal of Sports Sciences, 28(10), 1085-1092. doi:10.1080/02640414.2010.494308
  8. Kawamori, N., Rossi, S. J., Justice, B. D., Haff, E. E., Pistilli, E. E., OʼBryant, H. S., Stone, M.H., & Haff, G. G. (2006). Peak Force and Rate of Force Development During Isometric and Dynamic Mid-Thigh Clean Pulls Performed at Various Intensities. Journal of Strength and Conditioning Research, 20(3), 483-491.
  9. Kawamori, N., Nosaka, K., & Newton, R. U. (2013). Relationships Between Ground Reaction Impulse and Sprint Acceleration Performance in Team Sport Athletes. Journal of Strength and Conditioning Research, 27(3), 568-573. doi: 10.1519/jsc.0b013e318257805a
  10. Lake, J. P., & Lauder, M. A. (2012). Mechanical Demands of Kettlebell Swing Exercise. Journal of Strength and Conditioning Research, 26(12), 3209-3216. doi:10.1519/jsc.0b013e3182474280
  11. Makaruk, H., Winchester, J. B., Sadowski, J., Czaplicki, A., & Sacewicz, T. (2011). Effects of Unilateral and Bilateral Plyometric Training on Power and Jumping Ability in Women. Journal of Strength and Conditioning Research, 25(12), 3311-3318. doi:10.1519/jsc.0b013e318215fa33
  12. Martínez-Valencia, M. A., Romero-Arenas, S., Elvira, J. L., González-Ravé, J. M., Navarro-Valdivielso, F., & Alcaraz, P. E. (2015). Effects of Sled Towing on Peak Force, the Rate of Force Development and Sprint Performance During the Acceleration Phase. Journal of Human Kinetics, 46(1), 139-148. doi:10.1515/hukin-2015-0042
  13. Moir, G. L., Gollie, J. M., Davis, S. E., Guers, J. J., & Witmer, C. A. (2012). The effects of load on system and lower-body joint kinetics during jump squats. Sports Biomechanics, 11(4), 492-506. doi:10.1080/14763141.2012.725426
  14. Morin, J., Slawinski, J., Dorel, S., Villareal, E. S., Couturier, A., Samozino, P., Brughelli, M., & Rabita, G. (2015). Acceleration capability in elite sprinters and ground impulse: Push more, brake less? Journal of Biomechanics, 48(12), 3149-3154. doi:10.1016/j.jbiomech.2015.07.009
  15. Schuster, D., & Jones, P. A. (2016). Relationships between unilateral horizontal and vertical drop jumps and 20 m sprint performance. Physical Therapy in Sport, 21, 20-25. doi:10.1016/j.ptsp.2016.02.007
  16. Shoenfeld, B. Rate of Force Development. Accessed July 31, 2016. https://www.strengthandconditioningresearch.com/rate-of-force-development-rfd/.
  17. Speirs, D. E., Bennett, M. A., Finn, C. V., & Turner, A. P. (2016). Unilateral vs. Bilateral Squat Training for Strength, Sprints, and Agility in Academy Rugby Players. Journal of Strength and Conditioning Research, 30(2), 386-392. doi:10.1519/jsc.0000000000001096
  18. Stone, M. H., O’Bryant, H. S., McCoy, L., Coglianese, R., Lehmkuhl, M., & Schilling, B. (2003). Power and Maximum Strength Relationships During Performance of Dynamic and Static Weighted Jumps. The Journal of Strength and Conditioning Research, 17(1), 140-147.
  19. Suchomel, T. J., Beckham, G. K., & Wright, G. A. (2014). The impact of load on lower body performance variables during the hang power clean. Sports Biomechanics, 13(1), 87-95. doi:10.1080/14763141.2013.861012
  20. Zebis, M. K., Skotte, J., Andersen, C. H., Mortensen, P., Petersen, H. H., Viskær, T. C., Jensen, T.L., Bencke, J., & Andersen, L. L. (2013). Kettlebell swing targets semitendinosus and supine leg curl targets biceps femoris: An EMG study with rehabilitation implications. British Journal of Sports Medicine, 47(18), 1192-1198. doi:10.1136/bjsports-2011-090281
  21. Zink, A. J., Perry, A. C., Robertson, B. L., Roach, K. E., & Signorile, J. F. (2006). Peak Power, Ground Reaction Forces, and Velocity During the Squat Exercise Performed at Different Loads. Journal of Strength and Conditioning Research, 20(3), 658-664.
Assorted Loaves of Bread

The Fallacies About the Need to Go ‘Gluten-Free’

Blog| ByDominique Stasulli

Assorted Loaves of Bread

Gluten-free dieting has been all the rage in recent years, with an explosion of self-diagnosed gluten sensitivities sparking an interest in the gluten-free food market. Whether the motivation is soundly based in clinical diagnosis or purely an attempt at weight loss, the relief of common symptoms associated with the sensitivity has been attributed to the removal of gluten from the diet. Unfortunately, the information surrounding this complex molecule is largely misconstrued.

While gluten is often labeled as the culprit, there are other factors that can play a role in this sensitivity present in foods that contain gluten. Adopting a gluten-free diet inadvertently eliminates all of the potential culprits, and therefore provides relief. However, many important nutrients are stripped in the processing of these foods, and are often replaced with not-so-healthy substitutions and additives. The bottom line is that the research surrounding gluten sensitivity has been largely inconclusive and, although much of the media and books surrounding this topic can make a seemingly strong case, there is simply not enough evidence to support the assumptions made against gluten in the diet.

There are several related disorders that can cause nearly identical symptom presentations revolving around the irritation of the bowel. Celiac disease is an autoimmune disorder in which antibodies are made against particular proteins of the gluten molecule, resulting in an attack on the intestinal lining each time that gluten-containing foods are ingested. The prevalence of celiac disease is approximately 1% of the population, and can be confirmed with serological diagnostic testing for the causative antibodies. Endoscopic examination can also reveal villous atrophy along the small intestinal lining, as well as crypt hyperplasia, an overgrowth of the lining as a result of inflammation. Both of these presentations result in decreased nutrient absorption and can cause the well-known symptoms of irritable bowel syndrome (IBS), including bloating, irregular bowel movements, gas, and indigestion (Vazquez-Roque & Oxentenko, 2015).

A second similar reaction of the bowel occurs with a wheat allergy: an allergic reaction to the wheat component of foods, which often accompanies gluten. This is similar to how the body reacts to other food allergies such as peanut or soy, in that IgE antibodies make an acute attack on the “foreign invaders,” with the resulting IBS-like symptoms. Wheat is the most heavily cultivated agricultural product in the world and, with the amplification of turnover rate, increased pest-resistance, and nutrient-depletion of the soil, the structure of the wheat protein has altered over the last few decades. This has changed its macronutrient profile and immunogenic peptides, which may be causing the increasing prevalence of celiac disease and other sensitivities in our population (Fasano, Sapone, Zavallos, & Schuppan, 2015). The prevalence of wheat allergy is known to be quite low, accounting for only 0.1% of Western populations (Gaesser & Angadi, 2012).

The third disorder in this category is termed nonceliac gluten sensitivity, or NCGS. It has become the mainstream self-diagnosed form of IBS, by a largely unwarranted proportion of the general population. NCGS is somewhat ambiguous in scientific literature and clinical settings. It is, in fact, a sensitivity, as the name imparts. It is not a food intolerance, which is an entirely separate physical entity in which digestive enzymes are lacking for the support of proper digestion. As a result of a food intolerance, gut microbiota cause a fermentation of sugar in the colon, and the subsequent symptoms of indigestion follow.

NCGS develops as a result of the body’s innate immune response, which is a first-line defense mechanism against foreign molecules in the body, as opposed to the long-term adaptive immune response that occurs in celiac disease. When a foreign particle is ingested, the body reacts within hours to days with IBS-like symptoms. The good news is that innate immune responses are not long-lasting in the body, so with a short-term elimination diet and then a strategic introduction of the protein, a normal diet may potentially be resumed. However, there is not enough long-term research to confirm this with certainty.

Gluten has been labeled as the causative agent of NCGS; however, other dietary triggers such as fermentable oligosaccharides, disaccharides, monosaccharides, and polyols (FODMAPs), wheat, and amalase-trypsin inhibitors (natural-occurring wheat pesticides) have been implicated as potential suspects (Vazquez-Roque & Oxentenko, 2015). An elimination study was performed where participants with IBS-like symptoms were placed on a FODMAP-reduced diet for two weeks and then exposed to a randomized high-gluten, low-gluten, or no-gluten (control group) diet for one week, in order to delineate whether or not it was gluten or FODMAPs contributing to the symptomology (Vazquez-Roque & Oxentenko, 2015).

Gluten is often labelled the cause of nonceliac gluten sensitivity when FODMAPs are really to blame.

Gastrointestinal symptoms improved in all patients on the FODMAP-reduced diet and no symptoms returned upon exposure to gluten. In the large majority of gluten-free foods on the market, FODMAPs are also eliminated with the processing of gluten, and therefore the relief of symptoms is attributed to being “gluten”-free. Unfortunately, not all of the symptoms may completely disappear, since FODMAPs can appear in other foods. A thorough list of high- and low-FODMAP foods can be found here.

A review by El-Salhy, Hatlebakk, Gilja, & Hausken (2015) reported that, in a study on adults believing they suffered from NCGS, 24% had uncontrolled symptoms even after switching to a strictly gluten-free diet. In another double-blind, randomized study on females with IBS-like abdominal pain, symptoms subsided after the withdrawal of wheat products, not gluten itself (El-Salhy et al., 2015). When gluten-free diets are attempted without dietetic supervision, important nutrients such as fiber, vitamin A, magnesium, iron, and calcium can become deficient without supplementation (El-Salhy et al., 2015).

While gluten-free diets have been suggested for the treatment of autism spectrum disorders, there is no conclusive evidence supporting this claim, and the American Academy of Pediatrics does not support the use of gluten-free diets in these patients (Gaesser & Angadi, 2012). Celebrity endorsements of gluten-free dieting for weight loss have led to the overarching belief that these foods provide a healthier nutritional profile than traditional foods. The only population subset where BMI has improved following a gluten-free diet is in patients with clinically diagnosed celiac disease (Gaesser & Angadi, 2012). However, even in this population, individuals who started in the overweight or obese category actually gained weight as a result of this dietary change, potentially due to the increase in nutrient absorption as a result of the gluten-free diet (Gaesser & Angadi, 2012).

Many gluten-free foods possess higher caloric values and sugar content than their gluten-containing counterparts, and their lack of whole grains and fiber (both of which are inversely related to BMI) may negligibly or negatively impact attempts at weight loss (Gaesser & Angadi, 2012). Moreover, increasing whole-grain wheat intake has been shown to be beneficial for increasing healthy gut bacteria; so, if wheat and gluten can be tolerated, they should not be eliminated on the assumption of it being “healthier” when, in fact, there is no basis for this claim.

In individuals without celiac disease or true NCGS, gluten itself has been shown to improve lipid profiles in individuals with hyperlipidemia, reducing serum triglycerides by 13% after only two weeks of ingesting 60g/day (Gaesser & Angadi, 2012). High levels of wheat fiber and bran did not produce the same beneficial effect when gluten levels were kept the same (Gaesser & Angadi, 2012). Another study demonstrated the positive effect that gluten may have on reducing high blood pressure in affected adults. One of the target proteins of NCGS, gliadin, was reported to inhibit angiotensin I-converting enzyme (ACE), the common property of many synthetic hypertensive medications on the market (Gaesser & Angadi, 2012).

On another positive note, the immune-boosting potential of gluten has been attributed to the high glutamine content present in the protein (Gaesser & Angadi, 2012). In a study involving patients following surgery, subjects receiving wheat gluten hydrosylate for six days post-operation experienced a significant increase in natural killer cell activity from 6% to 57%. Natural killer cells are important in the monitoring of tumor development and viral infections, the latter of which is of high concern following a surgical operation (Gaesser & Angadi, 2012).

Gluten has some health benefits and shouldn’t be eliminated from a diet without medical guidance. Share on X

True NCGS is a diagnosis of exclusion, after celiac disease and wheat allergy have been ruled out, and only with the elimination test followed by a gluten challenge for symptom recurrence. If no IBS-like symptoms appear with a gluten-free diet, even with the continuation of a FODMAP ingestion, then NCGS can be properly diagnosed and attributed to gluten. Statistics show that roughly 82% of individuals adopting a gluten-free diet do so without first seeking medical advice (Vazquez-Roque & Oxentenko, 2015). This can result in serious negative implications from both a physical and mental health capacity, due to the potential for malnutrition and insufficient adherence without professional medical guidance. Some clinical scientists are considering the possibility that NCGS is celiac disease in its earliest inchoate, clinical form, but much research is yet to be performed in this area. Clearly there are physiological and nutritional benefits to consuming gluten for otherwise healthy individuals, and so it would be negligent to eliminate this powerful protein without first acquiring the medical basis to do so.

Since you’re here…
…we have a small favor to ask. More people are reading SimpliFaster than ever, and each week we bring you compelling content from coaches, sport scientists, and physiotherapists who are devoted to building better athletes. Please take a moment to share the articles on social media, engage the authors with questions and comments below, and link to articles when appropriate if you have a blog or participate on forums of related topics. — SF

References

  1. El-Salhy, M., Hatlebakk, J. G., Gilja, O. H., & Hausken, T. (2015). The relation between celiac disease, nonceliac gluten sensitivity and irritable bowel syndrome. Nutrition Journal, 14(1), 1-8.
  2. Fasano, A., Sapone, A., Zevallos, V., & Schuppan, D. (2015). Nonceliac gluten and wheat sensitivity. Gasteroenterology, 148, 1195-1204.
  3. Gaesser, G. A. & Angadi, S. S. (2012). Gluten-free diet: Imprudent dietary advice for the general population? Journal of the Academy of Nutrition and Dietetics, 112, 1330-1333.
  4. Vazquez-Roque, M. & Oxentenko, A. S. (2015). Nonceliac gluten sensitivity. Mayo Clinic Proc, 90(9), 1272-1277.
Xray Image of Disk Degeneration

Why Most People Are Wrong About Injuries and Pain

Blog| ByLars Avemarie

Xray Image of Disk Degeneration

Like many other health professionals, as well as lay people, I used to believe that pain only comes from an injury or is caused by locked joints, joint misalignment, weak or tight muscles, ruptured disks, poor posture, and degenerative changes.

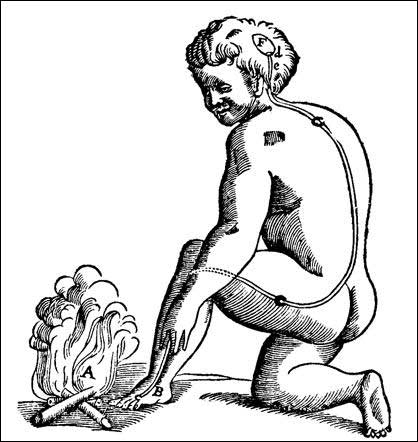
Many people also believe that pain means something is wrong in their body, in the location where they have the pain. This belief is based on what is popularly called the “Cartesian” model of pain, put forward by the philosopher Descartes nearly 350 years ago. Descartes wrote in his book, Treatise of Man: “The flame particle jumps from the fire, touches the toe, moves up the spinal cord until a little bell goes off in the brain and says, ‘Ouch. It hurt.”

The Descartes Reflex
Image 1: The Descartes-Reflex

This is closely related to what we learn throughout our childhood; namely, that pain always has a clear cause. We bump our toe, and the result is a painful toe. We fall and hurt our knee, and we get pain in our knee. This is a natural response, and it’s a good thing too, because it causes us to protect the injured area and try to avoid hurting it more. It causes us to act, and it promotes healing through rest (1).

This leads people to draw the conclusion that, if they have pain, it is because they have tissue damage in their muscles, tendons, or joints. Unfortunately, this conclusion is sometimes wrong, especially when pain lasts longer than the normal healing time. Both pain and neuroscience research show us that, when you have pain, it has less to do with the actual state of your tissue, and more to do with your brain and nervous system (2).

Pain has more to do with your brain and nervous system than with your muscles, tendons, and joints. Share on X

Quite frankly, pain is not as simple as most people, and even some health professionals, think. Pain is a multifaceted experience that is produced by multiple influences and factors (1). Pain is not simply a sensation caused by an injury, inflammation in the body, or tissue pathology (1).

Injuries often hurt because they activate specific receptors in the body called nociceptors. Nociceptors are specialized neurons that alert us to potentially damaging stimuli; they detect extremes in temperature, pressure, and compounds produced by an injury. A non-technical name for them is danger receptors.

Recent research has shown us that you actually can have pain in the body without anything being wrong in the area of that pain. You can also have “damage” and so called degenerative changes in the body without any pain.

As I see it, there are four possibilities:

  • Having tissue damage and pain
  • Having no tissue damage and no pain
  • Having pain but no tissue damage
  • Having tissue damage but no pain

The first two possibilities are the ones that almost everyone takes for granted, while the last two possibilities are often forgotten. However, these last two are very important to keep in mind. If you have pain for three to six months, it is usually classified as chronic pain. This type of pain often has more to do with your brain and nervous system than with the actual condition of the tissue.

In this article, we will look into the last possibility—having tissue damage without pain. There are many people who walk around with knee, back, or shoulder pain that drastically limits their ability to be active or live a normal life. Interestingly, there are also many people who have some significant “damage” in their body, also known as degenerative changes, but without any symptoms or pain.

Some examples from research include:

  • Researchers looking at the MRIs of participants’ lumbar spine area found that 80% of the participants without any symptoms or pain could be diagnosed with one mild disc protrusion or a disc herniation in the lumbar spine, and 38% of participants had two or more of these degenerative changes (3).
  • MRIs taken of the shoulders of participants who had neither symptoms nor pain showed that 34% of them had rotator cuff tears. This increased to 54% when researchers only looked at people above 60 years old (4).
  • Researchers found that 37% of patients in an emergency clinic (that were alert, rational, and coherent) did not feel pain at the time of their injury. Most of these patients reported pain within an hour of injury, but some patients reported delays of as long as nine hours or even more. In patients with lacerations, cuts, abrasions, and burns, 53% had a period of time without pain and, even in the group of patients with fractures, sprains, bruises, amputation of a finger, stab wounds, and crushes, 28% went through a period without pain (5).
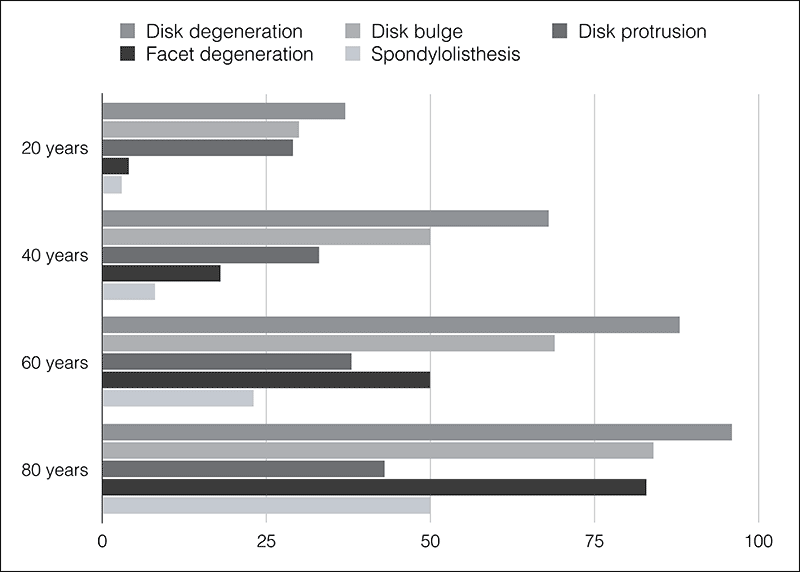
  • Of a group of participants in another study, 20% to 57% had different types of degenerative changes, like disc herniation or spinal stenosis, varying by age. The incidence was also shown to increase with age (6).
  • In a study of people with clinical symptoms of knee osteoarthritis, 76% were found to have meniscal tears without any symptoms or pain (7).
  • In a new systematic review of spinal degradation, the researchers determined that degenerative changes could be viewed as a normal part of aging, and that they are common in individuals without pain (8).
  • When the shoulders of subjects in one study were imaged by ultrasound, researchers found “abnormalities” in 96% of them; again without any symptoms or pain (9).
  • In an editorial published in the British Journal of Sports Medicine, a professor of sport medicine stated that degenerative meniscus tears (in the knee) should be looked upon as “wrinkles with age” (10).
  • A cross-sectional study of MRIs done on the cervical spines of 1,211 participants ages 20-70 found that 87.6% of them had a bulging disc. For participants in their 20s, 73.3% of the males and 78.0% of the females had bulging discs; again without any pain (11).
Disk and Fascia Degeneration
Image 2: Incidence of Spinal Degeneration in Asymptomatic Populations (8)

If we look closer at the data from the “Systematic Literature Review of Imaging Features of Spinal Degeneration in Asymptomatic Populations” (8), it shows that 60% of the people that are 40 years old have disc degeneration, 50% have a bulging disc, 33% have disc protrusions, 18% have facet degeneration, and 8% have spondylolisthesis. However, none of them have symptoms or pain.

The incidence increases dramatically when we look at data for people 80 years old. Here, the data shows that 96% have disc degeneration, 84% have a bulging disc, 43% have disc protrusions, 83% have facet degeneration, and 50% have spondylolisthesis. Still, none of this group has symptoms or pain.

All of the participants and patients in the studies I highlighted earlier—with the exception of the paper on patients in the emergency clinic (5) —had all sorts of things “wrong” in their body, but none of them felt pain.

How can that be? Why does your uncle’s shoulder hurt when his rotator cuff is torn, while people in these studies had no pain? And why do you get back pain when working in the garden, while all of these people can have degenerative changes without feeling any pain? What about the old man who has arthritis in both knees, but only the left one hurts? The answer is that pain is nowhere near as simple as we believe.

A wide range of scientific studies show the concept of pain is not as simple as we believe. Share on X

What does modern pain research say about pain, and what can we learn from the last 30 years of research on the experience of pain? A statement made by world-leading pain researcher, Professor Lorimer Moseley, serves as a gateway to this new research. Moseley is a professor of Clinical Neurosciences and Chair in Physiotherapy, School of Health Sciences at the University of South Australia, and is at the forefront of pain research. His numerous scientific studies have extensively increased our understanding of what pain is, and what it is not. Moseley said that, “pain is an unpleasant conscious experience that emerges from the brain when the sum of all the available information suggests that you need to protect a particular part of your body.”

Pain is, therefore, the sum of your environmental context (i.e., a calm or stressed environment; a battlefield, hospital, home), the degree of danger signal (nociception), your beliefs, your expectations, and your past experiences, as well as many other factors. You will experience pain only when your body perceives a large-enough threat in relation to the context (12,13). In layman’s terms, you could reconceptualize pain as the body’s alarm system, which reacts to threat, danger, and injury. The alarm (pain) is often activated when we get an injury, but the alarm system is highly intelligent and has the ability to warn us before we get an injury, thereby increasing the probability that we avoid the injury.

The legendary Danish doctor and anatomy professor, Dr. Finn Bojsen-Møller, stated: “It is fundamental to the body’s self-protection ability that pain begins before reaching the breaking point. Without the painful experience, there is no possibility of keeping the body and tissue intact and whole (14).”

This scientific research, and its implications, are both good news and bad news. The good news is that, through advances in pain science research, we have a much more complete understanding of what pain is. The bad news that emerges from this research, however, is that pain is a complex experience influenced by multiple factors. This means that there are no quick fixes to the complex problem that is pain, and this is a big challenge for the health professionals who are trying to sell quick fixes. But it also gives hope for new advances in pain treatments that integrate the complexity and multifactorial nature of pain.

Since you’re here…
…we have a small favor to ask. More people are reading SimpliFaster than ever, and each week we bring you compelling content from coaches, sport scientists, and physiotherapists who are devoted to building better athletes. Please take a moment to share the articles on social media, engage the authors with questions and comments below, and link to articles when appropriate if you have a blog or participate on forums of related topics. — SF

References

  1. Melzack R, Katz J. Pain. WIREs Cogn Sci. 2013; 4(1):1-15.
  2. Moseley GL. Reconceptualising pain according to modern pain science. Physical Therapy Reviews. 2007; 12(3):169-178.
  3. Jensen MC, Brant-Zawadzki MN, Obuchowski N, Modic MT, Malkasian D, Ross JS. Magnetic resonance imaging of the lumbar spine in people without back pain. N Engl J Med. 1994 Jul 14; 331(2):69-73X.
  4. Sher JS et al. Abnormal findings on magnetic resonance images of asymptomatic shoulders. J Bone Joint Surg Am. 1995 Jan; 77(1):10-5.
  5. Melzack R, Wall PD, Ty TC. Acute pain in an emergency clinic: latency of onset and descriptor patterns related to different injuries. Pain. 1982 Sep; 14(1):33-43.
  6. Boden SD, Davis DO, Dina TS, Patronas NJ, Wiesel SW. Abnormal magnetic-resonance scans of the lumbar spine in asymptomatic subjects. A prospective investigation. J Bone Joint Surg Am. 1990 Mar; 72(3):403-8.
  7. Bhattacharyya T, Gale D, Dewire P, Totterman S, Gale ME, McLaughlin S, Einhorn TA, Felson DT. The clinical importance of meniscal tears demonstrated by magnetic resonance imaging in osteoarthritis of the knee. J Bone Joint Surg Am. 2003 Jan; 85-A(1):4-9.
  8. Brinjikji W, Luetmer PH, Comstock B, Bresnahan BW, Chen LE, Deyo RA, Halabi S, Turner JA, Avins AL, James K, et al. Systematic Literature Review of Imaging Features of Spinal Degeneration in Asymptomatic Populations. AJNR Am J Neuroradiol. 2014 Nov 27. [Epub ahead of print].
  9. Girish G, Lobo LG, Jacobson JA, Morag Y, Miller B, Jamadar DA. Ultrasound of the shoulder: asymptomatic findings in men. AJR Am J Roentgenol. 2011 Oct; 197(4):W713-9.
  10. Risberg MA. Degenerative meniscus tears should be looked upon as wrinkles with age–and should be treated accordingly. Br J Sports Med. 2014 May; 48(9):741.
  11. Nakashima H, Yukawa Y, Suda K, Yamagata M, Ueta T, Kato F. Abnormal findings on magnetic resonance images of the cervical spines in 1211 asymptomatic subjects. Spine (Phila Pa 1976). 2015 Mar 15; 40(6):392-8.
  12. Moseley GL. A pain neuromatrix approach to patients with chronic pain. Man Ther. 2003 Aug; 8(3):130-40.
  13. Legrain V, Iannetti GD, Plaghki L, Mouraux A. The pain matrix reloaded: a salience detection system for the body. Prog Neurobiol. 2011 Jan; 93(1):111-24. Epub 2010 Oct 30.
  14. Bojsen-Møller, F. 2001. Bevægeapparatets anatomi. 12th ed., Denmark: Munksgaard.
A person in a yellow top and black pants is running on a wide, empty road. The sun casts a long shadow to the right. The background is dark and contrasts with the bright sunlight highlighting the runner.

Building Lateral Strength to Correct Crossover Gait

Blog| ByChris Korfist

Cross-over-Gait-Analysis

The mini-hurdle run not only allows coaches to work on perfect timing but also lets us work on lateral strength. Both are attributes that every fast, efficient, and injury-free runner displays.

The push runner who has an extended leg in back and low knee drive often shares the same characteristics of a runner with a crossover gait. Dr. Shawn Allen, of The Gait Guys, and I began investigating this concept years ago. We watched film clip after film clip of runners from a side angle, trying to determine how we could not only prevent injuries but also help athletes run faster.

During this time, one of Dr. Allen’s clients, who had chronic hip and knee pain, was featured running in a local advertisement. We looked at the YouTube clip, where the camera angle was from the front, and quickly discovered the runner had a crossover gait. We watched as she took three strides down the line on the side of a country road. Each stride crossed over the line and landed on the wrong side of her body. Sirens wailed, lights flashed, and the world changed.

Top sprinters land their feet directly under their hips. Share on X

We started filming as many runners as possible from the front and breaking down the filmed movements. Dr. Allen had the ability to test muscles to match the runner’s gait, which enabled us to deduce the problem. We searched for other research on the issue and found very little. So we started to play. YouTube was helpful to watch top sprinters run. Each runner landed their foot directly under their hip. The slower the athlete, the more the hip drifted toward the middle. This was consistent with both distance runners and sprinters. Like a thermometer, we could identify the problem. We wanted to become a thermostat so we could change things.


The Problematic Crossover Gait Motor Pattern: Part 1


The Problematic Crossover Gait Motor Pattern: Part 2

Since we understood that crossing over caused problems, we decided to design exercises to improve the pattern and change running form. We played with basic side planks. However, they did not build the strength necessary to hold the hip in place as a runner’s body weight, doubled, crashes down when the leg hits the ground. Hip hikes on a Swiss ball were an improvement because the foot is in contact with the ground. But they still lacked the appropriate force.

Next, I painted a line down my very long driveway and had my athletes run down the line, focusing on where their foot placement occurred. Sure enough, the athletes felt the stress on their hips. To help them space out their stride and force them to focus on raising their knees up, I placed 6-inch mini hurdles at 1.5 and 1.7m intervals and told them to run through. I could see them start to improve.

After this revelation, I watched Frans Bosch’s Running DVD again. He talked about foot placement relative to the hips. To further stress the hip, Bosch suggested runners fully extend their arms over their heads. We tried it, and it worked.

At this point, using my old school American strength coach mentality, I figured if I added weight, the results would be better. I found myself at a junkyard looking for weighted poles. I found 10, 20, 30, and 35-lb iron bars and had my athletes run with the 10-lb bars raised over their heads. And it worked. I observed noticeable differences in my athletes.

I do not add more than 10 pounds to a runner’s program for quite some time. I look for quickness off the ground first. Then I start to spread out the distance to 1.7m and 1.9m. When the athletes look good at 1.9m, I allow them to add weight. My fastest runners can handle heavier weight.

To add even more stress to the lateral sling, I put pieces of track, approximately ¼ to ½-inch, between the hurdles. This creates additional stress when hitting the ground. When we add speed through the hurdles and short distances between the hurdles, we create a challenging environment.

Keep in mind that this is a progression. A coach can wreck an athlete if they jump to the coolest exercise too soon. Patience is the key.

Since you’re here…
…we have a small favor to ask. More people are reading SimpliFaster than ever, and each week we bring you compelling content from coaches, sport scientists, and physiotherapists who are devoted to building better athletes. Please take a moment to share the articles on social media, engage the authors with questions and comments below, and link to articles when appropriate if you have a blog or participate on forums of related topics. — SF

Keni Harrison World Record Photo Finish

Analysis of Keni Harrison’s World Record 100m Hurdles Race

Blog| ByPierre-Jean Vazel

Embed from Getty Images

When Keni Harrison set the new World Record (WR) for 100m hurdles with a time of 12.20 in July 2016, she erased the 28-year-old record of 12.21 set by Bulgaria’s Yordanka Donkova.

How did Harrison manage to beat Donkova’s time? To find the answer, I dug into the archives of rare and/or unpublished data from Bulgarian studies, and I used my high-speed cameras to capture the world’s best hurdlers.

When Harrison crossed the finish line, the time displayed on the screen was 12.58. But for spectators, Harrison seemed too fast and the rest of the field too far behind for this time to be true.

Yes, Harrison ran 12.20 and no, she did not lean under the photocells. To be exact, Harrison’s time was 12.194. Why did the time 12.58 appear first? There’s a bug in the timing system.

Before analyzing Harrison’s race, I’ll explain how the timing works.

The Timing Bug

OMEGA uses two pairs of photoelectric cells on the finish line so that a time can be shown instantly. Actually reading and interpreting the photo finish takes additional seconds, sometimes minutes. In one case it took years: Donkova’s 12.35 WR in Cologne in 1986 was submitted as 12.34 to the IAAF for ratification, but a closer examination of the photo finish showed 12.35.

One pair of cells is placed 1.10m high from the ground, the second at 1.25m. To stop the clock and to prevent false times (caused by such things as a runner’s hand or a flying animal), both cells must detect movement. This time appears on the stadium board and TV screens. In Harrison’s WR race in London, the clock showed 12.58, which turned out to be the time for the second finisher, Brianna Rollins.

Did Harrison lean too low and go below the radar? No, it’s unlikely, unless a runner dives over the finish line. This did happen recently during the Rio Olympics when Shaunae Miller dived across the finish line in the 400m race. The timing bug also occurred in this race. The screen displayed Miller’s time as 49.51, but the photo finish showed Miller ran 49.44, and Allyson Felix got 49.51.

Miller’s finish followed Kumari Taki’s dive to win the 5000m final at 2016 World U20 Championships:

Kumari Taki 🇰🇪 wins U20 1500 lm world title with style #Bydgoszcz2016 #photofinish pic.twitter.com/EONqqPdCoe

— PJ Vazel (@pjvazel) July 22, 2016

Harrison’s World Record Finish

This photo sequence shows Harrison’s finish:

Keni Harrison World Record Photo Finish

Figure 1A. Harrison closes to the finish line and the two pairs of cells (black circles on the finish line).

Figure 1B. Harrison’s head meets the upper cell, as indicated by the small red light signal.

Figure 1C. Harrison’s torso meets the lower cell, but there’s too much delay between the two events, and the system doesn’t recognize her as the same object so the clock does not stop.

Figure 2A. The second runner, Rollins, closes to the finish line while the clock is still running.

Figure 2B. Rollins’ body (and possibly Kristi Castlin’s head) meets both cells virtually at the same time, as seen by the small red lights, and she stops the clock at 12.58. After reading the photo finish, Rollins’ time must have been between 12.561 and 12.570 to be attributed an official time of 12.57, according to IAAF rules. OMEGA has released Harrison’s unofficial time to the thousandth: 12.194.

The World Record Race

I combined the data from Bulgarian records with footage of Harrison’s race from videos showing various points of view: three high-speed and four normal speed cameras; two front planes; four panoramic sagittal planes at the start, middle and finish of the race; and one traveling sagittal plane. During the 12.20 race, I recorded times for each interval (8.50m between obstacles) taken at the time of contact of each landing after a hurdle.

2.49, 3.49, 4.45, 5.40, 6.33, 7.27, 8.21, 9.15, 10.11, 11.10

After a 0.149 reaction time, Harrison led the race, passing the 10m mark in 1.98, which the best sprinters achieve during world class 100m finals. I don’t have Donkova’s 10m time for her 12.21 WR, but for her 12.29 WR in 1986, she did 2.01.

Because Harrison didn’t land her leading foot close to the hurdle, her time at the first hurdle is not the fastest ever recorded. Cornelia Oschkenat was timed by Dr. Miskos (Athletics Laboratory UV CSTV, Prague) at 2.47 at the first hurdle during her semifinal at the 1987 World Championships and in 2.48 for 60m hurdles at the European Athletics Indoor Championships (European Indoor) and 7.77 in 1988.

During her career, Donkova tried to use 7 steps to the first hurdle instead of the traditional 8 and managed to decrease her time at the first hurdle touchdown. But then her times slowed down in the race’s first couple of intervals. Since her acceleration pattern suffered, she stuck with the 8-step approach.

Embed from Getty Images

It’s interesting to note that the 7-step has been tried for a long time; the first woman under 13 sec. electric time, Chi Cheng, 12.93 in 1970, used 7 steps. But, the 7-step has never really clinched for female hurdlers, unlike their male counterparts. From the start line to the first hurdle, the 13m distance is a closer match to women’s usual sprinting acceleration pattern as opposed to men’s who have a 13.72m distance.

The unit analysis shows that Harrison reached her top speed between the 5th and 6th hurdle, after about 6 sec, similar to normal times recorded for 100m dash sprinters.

1.00, 0.96, 0.95, 0.93, 0.94, 0.94, 0.94, 0.96, 0.99

Donkova’s 12.21 race is yet to be seen on video. The race that’s available on YouTube titled Women’s 100m Hurdles World Record is not the 12.21 race on August 20, 1988, in Stara Zagora. It’s been said the racers ran in the opposite direction to take advantage of the wind. And, as strange as it sounds, only four women were competing. One did not finish and the second place winner was timed at 14.74.

Donkova, then, won by a 2.53 margin. Her touchdown times have never been published outside Bulgaria, and I’m happy to share them:

2.50, 3.47, 4.42, 5.34, 6.24, 7.19, 8.16, 9.14, 10.11, 11.14

0.97, 0.95, 0.92, 0.90, 0.95, 0.97, 0.98, 0.97, 1.03

Note: These times should be taken with a grain of salt because it’s very unusual for an athlete to lose 0.05 from one interval to another, and the 0.90 unit is dodgy.

Harrison and Donkova Hurdle Split Comparison

Excluding Donkova’s possibly not-so-accurate intervals, 0.94 is the fastest unit I’ve found for her, and 0.93 is the fastest unit I know of during 100m hurdles. A 0.94 interval is quick enough to run 12.20, according to the models published in East Germany and the Soviet Union as well as my own recent models using the latest analysis.

A compilation of the all-time best interval units shows that Harrison achieved an outstanding top speed.

  • 1-2H 0.97 Lolo Jones (7.72 Doha WI ’10)
  • 2-3H 0.95 Gail Devers (12.46 Stuttgart WC ’93), 0.95 Keni Harrison (12.24 Eugene ’16)
  • 3-4H 0.93 Lyudmila Narozhilenko (7.68 San Sebastian ’93), Lolo Jones (7.72 Doha WI ’10)
  • 4-5H 0.93 Keni Harrison (12.20 London ’16)
  • 5-6H 0.93 Brianna Rollins (12.34 Eugene NC ’16)
  • 6-7H 0.94 Several women
  • 7-8H 0.94 Gloria Uibel (12.44 Roma WC ’87), Keni Harrison (12.20 London ’16)
  • 8-9H 0.95 Brianna Rollins (12.26 Des Moines NC ’13)
  • 9-10H 0.97 Ginka Zagorcheva (12.34 Roma WC ’87)

To determine a theoretical time for a perfect 100m hurdles race, I added the total of these best world times to the 2.47 approach by Oschkenat and the 0.98 time between the touchdown at last hurdle and the finish line by Devers at 1993 World Championship.

The result is 11.96 for the perfect 100m hurdles. Of course, this is hypothetical because it doesn’t take into account energy distribution.

The perfect time, hypothetically, for 100m hurdles is 11.96. Share on X

Hurdling Technique

It’s a persistent myth that hurdle clearance time is the most important factor in competition results. At the 1991 World Championships, Japanese bio-mechanicians recorded participants’ flight times over the hurdles and run times between hurdles. The results showed that run times have a higher correlation with the final time.

Run times between hurdles, not clearance times, have a higher correlation with final time. Share on X

Yet total run times are not Harrison’s strong suit. Adding in her 9 interval runs without taking into account her hurdle clearance time, her 6.14 is not among the best ever.

Former World Champions Narozhilenko (12.28) and Devers (12.37) and African record holder Glory Alozie (12.44) have sub-6 sec totals.

Harrison’s total hurdle clearance times, 2.76 for 10 hurdles, is among the best. The 1982 European champion, Lucyna Kalek (12.44), and Ginnie Powell (12.45) have a 2.74, and Cindy Billaud did 2.75 for her French record (12.56).

Harrison maintained her shortest hurdle clearance time of 0.27 almost all through the race, while several other women might have hit 0.25 or 0.26, as recorded at 1991 World Championships, but failed to maintain this rhythm.

Donkova, who was a sharp technician, achieved a personal best hurdle clearance of only 0.28 during her 12.21 WR. This is not where she improved over the years. In 1980, she had a 0.31 clearance when she was a 13.24 hurdler while she decreased her run time from 0.73 to 0.64.

It turns out, Harrison has the best combination of all hurdlers.

Of all hurdlers, Keni Harrison has the best combination of flight times and run times. Share on X

The first step after the hurdle is important since that’s where the hurdler accelerates after losing speed from the takeoff in front of the obstacle. The runner also loses velocity during each foot contact so foot contact should be as short as possible.

This is where Donkova excelled with the best times, especially during takeoff, when her contact times were as short as 0.09. She was even timed at 0.083 before the 8th hurdle during the 12.21 WR.

Harrison’s takeoff time is slightly over 0.100 but, at touchdown after the hurdle, she is faster than Donkova at 0.08 vs. 0.083. Only Sally Pearson (12.28 for her 2011 World title) has done better.

Harrison deviates from the model with long air time after the first step. This could explain why, by the third step, she sometimes gets too close to the hurdles. From the front-plane view, you can see that she does side steps. She’s actually running more than 100m.

Training

To achieve 0.93 units in competition, hurdlers work on time or the corresponding speed, 9.14 m/s, by using shorter distances between the hurdles. Harrison has hit 0.92 with 8.25m distance, which is 8.96 m/s, according to her coach, Edrick Floreal. At warm-up before her WR, Harrison used much shorter 7.50m intervals and had best interval times of 0.82-0.83, which is 9.14-9.04 m/s.

Interestingly, Donkova didn’t use distances shorter than 8.10 because her coach believed it would create a different rhythm pattern. They favored 8.15-8.50m intervals.

In August 1988, just days before the 12.21 WR, Donkova ran a significant training workout of 110m with 12 hurdles and 11 intervals at 8.30m distance. The first 5 intervals were run at an average 0.928, exactly as she did during the 12.21 competition, and the remaining 6 in 0.95, demonstrating great top speed and endurance speed.

Flat Speed

The annual progression of the two best hurdlers shows that the differential between 100m hurdle and 100m times, often referred as technical index, improves steeply in their first years and then stagnates.

Table 1. Comparison of 100m and 100H times by age.
Harrison Donkova
Year 100m 100H Diff Age Year 100m 100H Diff
– – – – 15 1977 12.62 14.84 2.22
2009 12.73 17.18 4.45 16 1978 12.47 13.91 1.44
2010 12.04 13.79 1.75 17 1979 12.18 13.57 1.39
2011 12.03 13.49 1.46 18 1980 12.17 13.24 1.07
2012 – 13.03 – 19 1981 12.04 12.9h 1.10e
2013 – 12.88 – 20 1982 11.27 12.44 1.17
2014 – 12.71 – 21 1983 11.42 12.65 1.23
2015 11.64 12.50 0.86 22 1984 11.62 12.50 0.88
2016 11.35 12.20 0.85 23 1985 – 13.24 –
24 1986 11.44 12.26 0.82
25 1987 11.44 12.33 0.89
26 1988 12.21

Keep in mind that their peak 100m times are underestimated because they ran too few races to accurately display their actual potential.

In May 2016, Harrison ran a 100m in 11.35 (0.7), and she called this a bad race. In a properly executed performance, she should be able to run 0.2 faster.

This would be better than Donkova, whose 11.27 personal best (PB) was set in 1982 (0.5) a week after setting the World Leader with 12.44. She must have run faster in the following years if the wind had not been negative for the few occasions she lined up: -1.2 for 11.42 in 1983, -1.2 for 11.44 in 1986, -3.0 for 11.44 in 1987.

Based on Donkova’s best training handheld times, probably achieved in advantageous conditions (wind and altitude), I’ve estimated the corresponding electric times (by adding 0.60):

  • 30m 4.16 (100m projection time according to my model: 10.96)
  • 60m 7.00 (100m projection: 10.90)
  • 100m 10.98

She was probably worth around 11.10 if we also consider her anchor leg times in relays:

  • 1987: 10.23 European Cup (fastest of the field, times in the open 100m/anchor relay leg: Marlies Göhr 10.95/10.37, Ewa Kasprzyk 11.45/10.50)
  • 1988: 10.26 Olympic Games (Evelyn Ashford 10.83/10.06, Göhr 10.99/10.26, Patricia Girard 11.65/10.48)

Donkova’s step length at her top speed measured during relay races remained similar from 1982 to 1988 (2m22), and her top speed only had marginal gains. Improvement of high-step frequency, especially by decreasing the contact times during the run between hurdles, were her technical trend until 1988.

Can Harrison Capture the World Indoor Record?

Donkova’s indoor 60m hurdles best was 7.74, a WR in 1987.

If Harrison can duplicate her shape next winter, she should be able to run much faster than Donkova’s time, and Sanna Kallur’s current World Indoor Record of 7.68 held since 2008 will be in danger. Harrison will also probably erase Narozhilenko’s 7.63 unratified record due to her 1993 doping offense.

Harrison’s time at 60m was 7.65 (high-speed camera placed at 60m), but theoretically, she could run faster since she had 6 hurdles instead of 5. This winter, she set her PB at 7.77 after a 5th hurdle touchdown of 6.48. Her 1.29 run-in time added to her 6.33 would give her 7.62.

I now expect she’ll have a faster finish.

Author’s Acknowledgments

Special thanks to my friend Daniela who helped me translate Bulgarian material more than a decade ago during endless afternoons. Credits to statistician Aleksandar Vangelov who provided early performance data for Donkova. And I’m grateful to Pr Apostol Slavchev for helping me with documentation for my research.

Since you’re here…
…we have a small favor to ask. More people are reading SimpliFaster than ever, and each week we bring you compelling content from coaches, sport scientists, and physiotherapists who are devoted to building better athletes. Please take a moment to share the articles on social media, engage the authors with questions and comments below, and link to articles when appropriate if you have a blog or participate on forums of related topics. — SF

Skin Tech with Barbell

Skin Tech: Limiting Collateral Damage in the Weight Room

Blog| ByJeremy Bunting

Skin Tech with Barbell

To improve power in the weight room, training hard and heavy comes with a price. Strength training is about breaking down and building up, and athletes can only leverage training adaptations when they maximize recovery. The ideal program strains only the areas that need, and can, adapt to the imposed demands. A shirt that adds appropriate shielding and provides the most comfort makes sense for athletes trying to achieve their best in the weight room and on the field.

Maximal squats, heavy cleans, and explosive jumps with a barbell create collateral damage that does not contribute to building strength. Many athletes and coaches perceive common joint, muscle, and tendon soreness as a cost of doing business.

There’s a big difference, however, between normal soreness and damage to untargeted tissue which may lead to permanent problems.

Even if acute or chronic injury doesn’t occur from heavy training, excessive soreness and pain limit the results of any properly designed strength program. For greater results, the winning formula is to push harder and recover more completely.

Olympic Bronze Medalist Jamie Greubel wears Skin Tech shirt.
Figure 1. Olympic bronze medalist Jamie Greubel seen here uses the Apollo SS training shirt to train harder and longer with less wear and tear to exposed areas like the collar bone and upper back. Any athlete squatting, jump squatting, or Olympic weight lifting will benefit from our shirt.

Common problem areas for athletes who train hard, even if they have great technique, are the following:

  • The Upper Spine: Not everyone’s anatomical structure receives a barbell well on their upper posterior neck. For most athletes, this area isn’t naturally padded by muscle. Even if it is, muscle will always lose to heavy steel. The Apollo SS training shirt solves this problem by covering exposed areas and increasing comfort with state of the art padding.
  • Clavicles and Sternum: Front squats, push presses, and heavy cleans place a lot of pressure on the collarbone and breastbone, which are not designed to handle impact forces. The shirt’s built-in high impact pads cover this area precisely for those needing a little assistance with the lifts.
  • Anterior Shoulder Area: No matter what grip one uses, racking and reracking a bar on the shoulders can be tough for athletes who don’t have muscular development in this area. Exposed bone can spell discomfort to any athlete, not only those who are smaller in the upper body.
  • Nerves, Upper Back, and Shoulders: Some mystery exists in the current science about sensory and motor nerves. Some athletes are highly sensitive and have discomfort in the upper back and shoulders. To eliminate any potential problem, the shirt covers these areas to protect the athlete.
  • Trapezius and Other Muscle Groups: Over time, a heavy barbell can wear down other muscle groups in the upper torso. The shirt supports these areas to relieve the muscles and enables coaches to train their athletes harder in the next session.
Skin Tech Apollo SS
Figure 2. Skin Tech Apollo SS

Discomfort and pain are not caused by imperfect barbell technique; they result from a limit to the design of the human body. Some of the most skilled athletes in international weightlifting and powerlifting wear the Apollo SS shirt.

Pain is not caused by imperfect barbell technique; it results from the human body’s design limits. Share on X

We’ve also seen great results with collision sport athletes who simply need a way to calm the blows of their sport to train effectively. The physical toll of heavy training adds up; many coaches and athletes don’t realize how much recovery time they need to handle the wear and tear of competing, practicing, and training.

When Toughness is Disguised as Macho Foolishness

Some coaches believe a heavy bar crashing or pressing against the body is a sign, or part of, building toughness. We agree that heavy barbells can challenge and teach athletes valuable lessons. Discomfort, however, should come from hard conditioning and not banging up joints and tendons.

NFL coaches and science teams now work together to find the optimal load for hitting and contact using systems like Catapult and other tracking tools. It’s time to direct this attitude to the weight room.

We designed the Apollo SS to protect the areas of the body affected by intense barbell training. We love sensors and tools that measure workouts, but there are not enough solutions available to actually improve high-intensity training. Skin Tech™ is currently protecting players in the NFL, MLB, NHL, NBA, and athletes in both the summer and winter Olympics.

Conner Carrick training with SkinTech Apollo SS
Figure 3. Ice hockey players with a long season can benefit from the use of the Apollo SS training shirt. NHL player Connor Carrick is shown here training with the Skin Tech innovation.

Some athletes roll up towels or use bulky barbell padding, but the experience leaves them frustrated with subpar results. Consider the hypocrisy: specialized bars have massive padding and nearly every leg machine has cushioning for the shoulders. We don’t favor plush spa athlete experiences; we just know that optimal comfort leads to harder efforts and less wear and tear.

For us, toughness is challenging the willpower to push harder. Toughness is not dealing with discomfort or pain; these don’t contribute to physiological improvements in the body. Athletes in contact games like rugby and American football experience enough impact. We want the focus in the weight room to be on building up, not piling on additional pain and trauma.

The Measurable Difference of Training with the Apollo SS Shirt

Recovery from training is a complex process. We’ve done our homework with the science and taken into account the practical considerations of training with correct weight room ergonomics.

Coaches and athletes always ask about a product’s real-world benefits. So what’s it worth? We did some of our own research and looked at the price of impact on athletes playing contact sports. We saw a pattern.

Skeletal Structure of Human Shoulder
Figure 4. This image illustrates how nerves are sometimes protected and sometimes exposed.

We found that the more impact or loading experienced by an athlete, the longer the recovery needed, all else being equal. There’s a difference between muscle recovery and joint inflammation.

There’s a difference between muscle recovery and joint inflammation. Share on X

The training process breaks down muscle tissue and builds it back up. This is necessary. Soreness is expected and may occur with heavy training. But lingering and excessive joint pain or inflammation only decelerate body recovery. Major pain or discomfort that sabotages sleep and prevents training is unacceptable.

When reporting their willingness to train, athletes are influenced by their physical and training fatigue. We’ve found that willingness specifically to lift heavy with a barbell on the body may not show up with subjective questionnaires, coach and athlete communication, or athlete self-reporting. Not because athletes aren’t motivated to lift heavy or train, but because most athletes don’t look forward to soreness and unproductive pain.

Sport Collision Classification
Table 1. Impact loads using technology sensors are becoming more accurate as they evolve. At Skin Tech, we believe that all loads and impacts must be taken into account for recovery purposes.

Everyone has a limit, whether physical or mental. We know that even tough athletes who pride themselves on the “no pain no gain” philosophy still benefit from wearing our shirt because it allows them to go harder.

We can care for the majority of athletes that simply use weight training as a means to an end and are willing to go hard provided that reasonable comfort exists when a steel bar goes to the body.

Skin Tech™ innovation adds the ability to safely maximize every athlete’s potential and provides support so recovery is deeper and intensified.

Proprietary Technology and Patent-Pending Design

Skin Tech™ assembled the utopian training shirt by combining the current leading technologies in both the sport and the protection industries. Every possible function an athlete needs is provided with the most comfortable training shirt on the market.

Weight training with Skin Tech Apollo SS

The Apollo SS delivers the best shielding system to exposed anatomical areas while being ultra-light and incredibly cool. The shirt provides individual, geometric pattern XRD® Protection foam armor that withstands 90% of the impact from ballistic lifts. It’s resilient to crush loads, has no skin irritants, and is laundry safe. The fabric is designed to allow for ease of motion in any training environment and is built to last.

Skin Tech offers the Apollo SS shirt for both men and women of all ages and sizes. In addition to an array of sizes for different athletes, the shirts can be customized with logos if teams and companies want to promote their brand uniquely.

The Apollo SS was designed to protect muscle, bone, and the nerves. The padding is a mere 6.35 millimeters thick but is able to handle high-velocity and high-load weight training shocks. The geometric patterns are strategically placed for key target areas for both power lifts and Olympic weightlifting. The precise spacing of the patterns allows for a smooth glide to preserve natural motion. In addition to barbell loading, athletes using other weighted instruments like kettlebells and medicine balls will benefit from the shirt’s design.

XRD Extreme Impact Foam
Figure 5. XRD® Extreme Impact Protection foam is designed for impact resistance and ensures the athletes are getting superior protection in the weight room.

The Apollo SS uses XRD® Technology, the leading impact absorption material in the industry. The material boasts an impressive tensile and tear strength index and is rugged enough to handle extreme conditions such as high-speed sports and life-saving professions. The material is surprisingly soft and flexible but is resilient to handle even the most demanding training sessions.

Skin Tech Shirt

The shirt is cool, breathable, antimicrobial, and designed to resist odors and stains. The reinforced TopCover shield provides added support around the chest and back to reduce muscle fatigue and pressure. The high impact material creates a natural and subtle gap between fabric layers to help release body heat during training. Unlike other protective shirts, the feel is natural and doesn’t irritate the skin. We designed and tested the Apollo SS to be the most comfortable training shirt on the market.

What to Expect and Getting Started

Skin Tech Shirt Sizes

When athletes put on the Apollo SS, they immediately feel the difference. The shirt is ultra-light and feels like a second skin. The high-tech armor covers the areas that need a little more support. The cut is athletic, form fitting, and designed for a personalized experience. Teams can customize their shirts with logos or ship same day if they just want the core essentials. If you have any questions or want guidance on sizing and large orders, visit skintechfit.com and give us a call or email me at [email protected].

Since you’re here…
…we have a small favor to ask. More people are reading SimpliFaster than ever, and each week we bring you compelling content from coaches, sport scientists, and physiotherapists who are devoted to building better athletes. Please take a moment to share the articles on social media, engage the authors with questions and comments below, and link to articles when appropriate if you have a blog or participate on forums of related topics. — SF

Sport Science References

  1. Ascensa ̃o, A, Rebelo, A, Oliveira, E, Marques, F, Pereira, L, and Magalha ̃es, J. Biochemical impact of a soccer—Analysis of oxidative stress and muscle damage markers throughout recovery. Clin Biochem 41: 841–851, 2008.
  2. Brancaccio, P, Maffiuletti, NA, and Limongelli, FM. Creatine kinase monitoring in sport medicine. Br Med Bull 81–82: 209–230, 2007.
  3. Cadore, E, Lhullier, F, Brentano, M, Silva, E, Ambrosini, M, Spinelli, R, Silva, R, and Kruel, L. Correlations between serum and salivary hormonal concentrations in response to resistance exercise. J Sports Sci 26: 1–6, 2008.
  4. Clarkson, PM, Nosaka, K, and Braun, B. Muscle function after exercise-induced muscle damage and rapid adaptation. Med Sci Sport Exerc 24: 512–520, 1992.
  5. Cormack, SJ, Newton, RU, and McGuigan, MR. Neuromuscular and endocrine responses of elite players to an Australian Rules football match. Int J Sports Phys Perf 3: 359–374, 2008.
  6. Coutts, A and Duffield, R. Validity and reliability of GPS devices for measuring movement demands of team sports. J Sci Med Sport 11: 500–509, 2008.
  7. Coutts A, Reaburn P, Piva TJ, and Murphy A. Changes in Selected Biochemical, Muscular Strength, Power, and Endurance Measures during Deliberate Overreaching and Tapering in Rugby League Players. Int J Sports Med 28: 116–124, 2007.
  8. Elloumi, M, Maso, F, Michaux, O, Robert, A, and Lac, G. Behaviour of saliva cortisol [C], testosterone [T] and the T/C ratio during a rugby match and during the post competition recovery days. Eur J Appl Physiol 90: 23–28, 2003.
  9. Gill, ND, Beaven, CM, and Cook, C. Effectiveness of post-match recovery strategies in rugby players. Br J Sports Med 40: 260–263, 2006.
  10. Hatanaka, E, Furlaneto, CJ, Ribeiro, FP, Souza, GM, and Campa, A. Serum amyloid A-induced MRNA expression and release of tumor necrosis factor-alpha (TNF-a) in human neutrophils. Immunol Lett 91: 33–37, 2004.
  11. Hartmann, U and Mester, J. Training and overtraining markers in selected sport events. Med Sci Sports Exerc 32: 209–215, 2000.
  12. Hoffman, JR, Kang, J, Ratamess, NA, and Faigenbaum, AD. Biochemical and hormonal responses during an intercollegiate football season. Med Sci Sports Exerc 37: 1237–1241, 2005.
  13. King, T, Jenkins, DG, and Gabbett, TJ. A time motion analysis of professional rugby league match play. J Sports Sci 27: 213–219, 2009.
  14. Howatson, G and Milak, A. Exercise-induced muscle damage following a bout of sport specific repeated sprints. J Strength Cond Res 23: 2419–2424, 2009.
  15. Kinugasa, T and Kilding, AE. A comparison of post-match recovery strategies in youth soccer players. J Strength Cond Res 23: 1402– 1407, 2009.
  16. Kyrolainen, H, Takala, T, and Komi, P. Muscle damage induced by stretch-shortening cycle exercise. Med Sci Sport Exerc 30: 415–420, 1998.
  17. MacLeod, H, Morris, J, Nevill, A, and Sunderland, C. The validity of a non-differential global positioning system for assessing player movement patterns in field hockey. J Sports Sci 27: 121–128, 2009.
  18. Magal, M, Dumke, CL, Urbiztondo, ZG, Cavill, MJ, Triplett, NT, Quindry, JC, McBride, JM, and Epstein, Y. Relationship between serum creatine kinase activity following exercise-induced muscle damage and muscle fibre composition. J Sports Sci 28: 257–266, 2010.
  19. McLellan, CP, Lovell, D, and Gass, GC. Creatine kinase and endocrine responses of elite players pre, during and post rugby league match-play. J Strength Cond Res 24 (11): 2908–2919, 2010.
  20. Peake, JM, Suzuki, K, Wilson, G, Hordern, M, Nosaka, K, Mackinnon, L, and Coombes, JS. Exercise-induced muscle damage, plasma cytokines, and markers of neutrophil activation. Med Sci Sports Exerc 37: 737–745, 2005.
  21. Portas, M, Rush, C, Barnes, C, and Batterham, A. Method comparison of linear distance and velocity measurements with global positioning satellite (GPS) and the timing gate techniques. J Sports Sci & Med 6: 7–8, 2007.
  22. Slattery, KM, Wallace, LK, Bentley, DJ, and Coutts, AJ. Effect of training load on simulated team sport match performance. Appl Physiol Nutr Metab 37: 315–322, 2012.
  23. Smart, DJ, Gill, ND, Beaven, CM, Cook, CJ, and Blazevich, AJ. The relationship between changes in interstitial creatine kinase and game related impacts in rugby union. Br J Sports Med 42: 198–201, 2008.
  24. Takarada, Y. Evaluation of muscle damage after a rugby match with special reference to tackle plays. Br J Sports Med 37: 416–419, 2003.
  25. Thorlund, JB, Aagaard, P, and Madsen, K. Rapid muscle force capacity changes after soccer match play. Int J Sports Med 30: 273–278, 2009.
  26. Tiidus, PM and Ianuzzo, CD. Effects of intensity and duration of muscular exercise on delayed soreness and serum enzyme activities. Med Sci Sport Exerc 15: 461–465, 1983.
  27. Vining, RF, McGinley, RA, Maksvytis, JJ, and Ho, KY. Salivary cortisol: A better measure of adrenal cortical function than serum cortisol. Ann Clin Biochem 20: 329–335, 1983.
Football Coach with team

18 Survival Tips for Coaches

Blog| ByTony Holler

Football Coach with team

I grew up in a coach’s house and witnessed the toll that coaching takes on a family. My father coached for 47 years and won 644 games as a basketball coach. By the time I was 15, my dad had coached at five schools and we had moved four times. By then, we were treading water financially. Our family car was a broken-down station wagon with a defective gas gauge and a dented driver’s side door that wouldn’t open. Needless to say, I didn’t drive to my prom.

My mom was the glue that held it all together. Somehow, mom found ways to provide food, clothing, and shelter for six people with limited resources.

In high school, I was ranked fourth in my graduating class and planned to attend college to become a doctor. However, after my first year of pre-med, my gut told me to drop the doctor idea and do what I loved instead.

“Tell me, what is it you plan to do, with your one wild and precious life?” – Mary Oliver, “A Summer Day”

I wanted the life that my father had. I was certain at age 19, and that same certainty has never left me. I wanted to wake up every day excited—excited about the players on my team, the next game, and the next season. I wanted the emotional connection that coaches have with their athletes. I wanted the winning and losing, and everything that went with it.

Most coaching careers end badly. Many are train wrecks. Marriages suffer. Families become dysfunctional. Every year, hundreds of coaches resign “to spend more time with their family.” If a coach is going to survive the long haul, he must take care of his family first. Nothing ends a coaching career faster than problems at home.

Take care of your family first if you want to survive as a coach in the long term. Share on X

I write this with a proud but humble heart. This article is not an attempt to impress anyone. As I enter my 36th year of teaching and coaching, I believe I have something of value to share with others. My survival guide may not be your survival guide. Even though my 18 tips are unique to my life, some of them are universal. I hope young coaches may benefit.

1. Go Home for Lunch

I live four minutes from Plainfield North High School. For more than 30 years of my career, I have lived within a four-minute drive of my workplace.

To my knowledge, I am the only teacher at Plainfield North who goes home for lunch. Rain, sleet, or snow, I go home. Stale air and fluorescent lighting can distort your senses. In addition, eating lunch with unappreciated, underpaid, curriculum-driven teachers is no way to keep your spirits high.

But here’s the more important issue. If you live close enough to go home for lunch, you also have a quick drive to work and a quick drive home. I work with teachers who endure a two-hour round-trip commute. I guarantee you one thing: those teachers aren’t going to coach long. With coaching, my workweek can approach 70 hours. If I added six to 12 hours of driving to a 70-hour week, something’s going to break.

2. Choose Wisely

In my introduction, I mentioned my mom. She was a mother of four by the age of 30 and gave up a promising career, like most women of the ’50s, in order to become a wife and a mother. My dad chose wisely. Not only did he marry an attractive high school valedictorian from a solid family, but he also married a girl who understood sports. Three of my mom’s brothers played college football; two of them became career football coaches.

Venus & Mars marriages may not work so well for coaches.

I married Jill in 1983. We were both teachers. Before we got together, I knew Jill attended every home basketball game at Harrisburg High School. I was the head basketball coach. I also learned Jill was a huge football fan.

To this day, a road trip to a college football game ranks near the top of Jill’s favorite activities. On our 20th anniversary we traveled to Austin, Texas, where we experienced the Sixth Street music scene every night and attended Texas Longhorn football practices during the day. I’ll never forget a booster pointing out their redshirt freshman, Vince Young, and describing him as a tall Michael Vick.

3. Buy a Backyard Pool

In 1993, I won a small settlement for a wrongful dismissal as head basketball coach. We invested around $3,000 into a backyard pool for our family of six. For the next 11 years, our pool was the center of family life.

Backyard Swimming Pool
Image 1: A picture of the Holler backyard pool, circa 2001. Resort living for a small price.

As a coach, I worked 50-70 hours every week from August until May. In my first eight years of teaching, I coached football, basketball, and track. Over the past 35 years, I’ve coached 72 teams. And, as every coach knows, coaching doesn’t end when the season is over.

For the career coach, summer must become summer vacation. Creating a backyard playground makes sense.

4. Discourage Baseball

Before you question my patriotism, let me explain. I am a lifelong baseball fan. I sat in the bleachers of Wrigley Field when the ticket price was $1.25 (1976). I attended the famous Disco Demolition Night at Comiskey Park in 1979. I played baseball until I defected to the track team in high school. I’ve played fantasy baseball my entire adult life. I named my 2016 teams, “Quantum Entanglement” and “Nikolaus Kopernikus.” I have baseball cred.

My boys played Whiffle ball in the streets. I played catch with my sons like every good American father. They also played Little League baseball.

With three boys playing on three teams in three leagues, Jill and I started to question our quality of life. We initiated a tag team plan. We had three jobs to share: delivery, attendance for a couple of innings, and pickup. The baseball community was probably appalled at our behavior. The normal family would get to the game 30 minutes ahead of time and set up their lawn chairs, with their aunts and uncles and grandparents also joining them. Not us.

Eventually, it got to the point where our oldest son, Alec, was offered a spot a team that would travel to other towns. Recognizing the detrimental effect this would have on summer vacation, I offered Alec the opportunity to attend three basketball camps of his choice in lieu of baseball. Alec attended Duke, Illinois, and Indiana. Yes, I bribed my son to ditch baseball.

Duke Basketball Camp
Image 2: At Duke Basketball Camp, Alec’s baseball alternative. Alec (14), Quinn (8), and Troy (11) got their picture taken with Coach K.

Today, youth baseball is the tail that wags the dog for many American families. An alarming number of kids age 6 to 18 are paraded all over the country to play in tournaments and gain national exposure. Parents invest thousands into a sport that was once relatively free. When families follow their prodigies from game to game, the fabric of family life changes. Forget about that backyard pool.

When I think of a coach giving up summer vacation in order to follow their kids’ baseball teams from Tucumcari to Timbuktu, I just shake my head.

5. Rethink Obligations

Greg McKeown The Disiplined Pursuit of Less

I was blown away by the book, Essentialism: The Disciplined Pursuit of Less, by Greg McKeown. I believe it to be the best coaching book ever written, even though it’s not a coaching book.

I’ve learned to say no. I have declined hundreds, if not thousands, of graduations, graduation parties, baptisms, First Communions, confirmations, funerals, weddings, school plays, family get-togethers, coach’s parties, and just about everything else you can imagine. I boycott basketball and haven’t watched an entire baseball game for years. I’m getting more selective every year.

Remember, these survival tips are mine. You may disagree. Throughout my coaching career, I’ve made decisions to simplify my life by going big on the things that mattered most to me. I’ve de-emphasized or eliminated many things that others hold dear.

Please understand I am not criticizing those who live lives of duty and obligation. I respect those who show up for their niece’s middle school graduation. I respect people who attend the funerals of distant relatives and friends of friends. Those people have made their choices and I have made mine.

6. Throw Friends Overboard

If my goals are to be a top-notch chemistry teacher, a solid coach, and the patriarch of a large family, obligations are not the only things that may get sacrificed. Friendships may also have to be reevaluated.

I learned at an early age that playing poker on Wednesday nights might not be family friendly. Going out with the guys on Saturday night was not a healthy pursuit. Road trips with college buddies may not be in the cards.

The people I call my friends today are coaches I work with and coaches from other schools. I may not spend time in friends’ backyards, but I have friends.

This gets back to McKeown’s Essentialism. Being a good friend is a wonderfully admirable trait, but it may not fit in with chemistry, coaching, and four kids. McKeown explains: “The word priority came into the English language in the 1400’s. It was singular. It meant the very first or prior thing.” In the modern world, people become overwhelmed with dozens of priorities. Too many priorities “draw us in and drown us in shallow waters.”

7. Reading Is Essential

Books are always available. They never demand my attention, and they don’t make appointments. I’ve read nearly 1,000 books in the past 40 years. To me, reading allows me to travel without leaving my home. I can’t imagine my life without reading.

When money was tight, I got my books from the public library. My Kindle is now my library. Reading fuels my teaching and coaching. Reading quiets my mind and feeds my spirit. Because of reading, I’m never bored. Never being bored is highly underrated.

8. Running Is Essential

Strangely, reading and running are connected in my brain. Back in the ’80s, my wife and I attended a show at Second City in Chicago. When I’m at a comedy club, I try not to get noticed. Nothing good comes from being singled out by a comedian. Well, on this night, I got singled out. The comedian on stage pointed at me and asked, “What are your hobbies?” I cringed and meekly answered, “Reading and running.” “The Most Boring Man in the Room” was an improv classic.

Running and reading have become the common thread of my life. Both are relatively free. Both can be done without going somewhere in a car. Both make me feel healthy. When I’m feeling stressed or out of control, I always find that two things are missing in my life: reading and running.

Tony Holler 20 Mile Run
Image 3: Here I am with training partner, Curt Wasson, at a water break on a 20-mile run. The country roads of Southern Illinois are smoking-hot in August. We would always start our long runs at 6:00 a.m.; my kids were still asleep when I got home. I was 41 at the time and had four kids going to four different schools.

When my kids were young, every run involved pushing a baby jogger. Not only was I taking care of myself, I was also parenting. Biking, the cousin of running, serves as my alternative workout. My wife and I both rode bikes with permanent child seats attached.

9. Money: All You Need Is Enough

My father never carried a wallet; never slipped me a $5 bill. His pockets were always empty. Dad brought his paychecks home and handed them to my mom. Some people’s minds never stray from the profit margin. The struggle for the legal tender is the alpha and omega of many American men. Not my dad.

What if I had grown up in a family where money symbolized success?

As a first-year teacher in 1981, I was assigned five classes of low-level science in a 100-year-old building with no air conditioning and plaster falling off the walls. I coached football, basketball, and track. My paycheck was $499, twice a month. Renting a trailer cost me $160 and my school loan payment was more than my rent. My teaching salary didn’t exceed $52,000 until I was 47. If I measured success based on my paycheck, I am a career failure.

Teachers and coaches measure success on a different scale. Our success cannot be quantified (though poorly informed people think otherwise).

I grew up in a family who had enough to live on. My kids grew up with enough.

There’s nothing divine about living paycheck to paycheck. Small setbacks cause high anxiety. One of my life’s regrets is not being able to pay for my kids’ college educations. My 26-year-old son, Troy, recently refinanced $106K of student loans. He will pay $925 a month for the next 20 years. If I had stuck with medicine, my kids would be debt-free.

In my ITCCCA Hall of Fame speech, I told the audience, “When Jill and I got married, we were about $20,000 in debt and we rented a house. Here I am 30-some years later, and we are $20,000 in debt and we rent a house.”

10. Take Your Kids to Work

There was no separation anxiety when our kids went to kindergarten because they went to school with their mother. Whether Jill was teaching 2nd, 3rd, or 4th grade, her classroom was right down the hallway from Adrienne, Alec, Troy, and Quinn. The perfect job for a mother puts her in the same building as her kids.

All four of my kids attended my high school. I had the privilege of teaching Chemistry-I, Chemistry-II, and Anatomy Physiology to Adrienne and Alec at Harrisburg High School. In Plainfield, I taught Honors Chemistry to Troy and Quinn.

I never coached my daughter, but I coached Alec’s freshmen and sophomore football teams. I was varsity offensive coordinator when Troy started as a wide receiver during his junior and senior years. Quinn was my quarterback in sophomore football. Alec, Troy, and Quinn ran track, and all three were hurdlers.

By the way, I quarterbacked my father’s sophomore football team and started for his varsity basketball team. Dad was my World History teacher at Princeton High School in 1973.

Having keys to the gym is one of the few perks of coaching. On most Sundays, I would take my kids to the gym. It seemed like they could play there forever.

I don’t think there was ever a track meet where a couple of my kids didn’t ride the bus. They witnessed every locker room and every sideline. Not many jobs are as kid-friendly as coaching.

To this day, I share coaching with two of my boys. Alec coaches football and track at Edwardsville High School. Quinn has been my right-hand man in football and track for the past three years. Soon, he will also be certified to teach.

11. Attendance Is Not Required

I’ve known many coaches who expect their wives to support them by attending their athletic events. This is unhealthy.

Attendance at events should never be required. After a week of teaching 2nd grade (aka, “The Death March”), Jill would often require an extensive period of rest and recovery. Heading out to a Friday night football game or an all-day Saturday track meet would have done her in.

Don’t force a spouse to attend every game or meet. Any involvement should be their choice. Share on X

By the very nature of a coach’s job, the wife of a coach will be involved; very involved. Coaches take their work home. During the season, I am a coach from the time I wake in the morning until the time I go to sleep at night, and then I dream it.

Your wife may want to be your assistant, or the team mom, or super-fan. She may want to sit in the stands and bask in your popularity and hear all the lovely things parents say about you. No problem. Just make sure the involvement is her choice and not yours.

And, on the subject of attendance, never force your wife to attend coach’s parties after games; especially those football parties. The Neanderthal nature of football will often segregate the group into football-talking men in one room and babysitting women in the other. Once again, attendance is fine but not required.

12. Raise Free-Range Kids

It’s strange that so many people prefer free-range chickens, but choose to cage their kids. I don’t know when all of this changed, but parenting today can be a soul-crushing job.

At the risk of sounding like an old codger who talks about the good old days, here goes. Jill and I were born at the end of the Baby Boom. We were born before the pill made it much easier to plan births and limit family size. As kids, we walked to school and walked home. We went barefoot in the summer, climbed dangerous trees, and ate wild berries, green apples, and anything else that looked edible. We made up our own games in the backyard, made our own rules, and fought our own fights. Our dogs ran the neighborhood with us. Bikes would take us places we had never been.

When Jill and I became parents, necessity demanded we raise our kids the way our parents raised us. We were busy people with four kids and no money. Our kids walked from their school to my practice without supervision. Ninety-nine percent of my kids’ athletic development took place without uniforms, travel teams, or personal trainers. Needless to say, we didn’t arrange playdates for our kids.

Tony Holler Family Photo
Image 4: A picture of my expanding family. From left to right: me, Jill, Alec, Alec’s wife Tanya, Adrienne, Adrienne’s husband Rob, Troy’s girlfriend Julie, Troy, and, in the first row, my youngest, Quinn.

If we would have raised our kids like the zombie apocalypse parents of today, there’s no way I could have continued to coach. I don’t know how modern parents do all they do. I’m sure it takes lots of sacrifice. I’m just not sure it’s necessary.

Here’s the good news: Kids don’t have to take up all of your time. Free-range kids grow up to be strong and healthy adults. As a bonus, parents of free-range kids also get to live as strong and healthy adults, instead of babysitters and chauffeurs.

13. All Work and No Play Makes Jack a Dull Boy

Coaches need to seriously consider Stephen King’s message from The Shining. Coaches are 24/7 during the season. Raising a family is a 24/7 job for two adults. What could possibly go wrong?

When Jill and I had kids, our lives changed a bit, but nowhere near the colossal change of modern parents. We didn’t give up pizza and beer. We still enjoyed live music. We still went on vacation.

Once, we drove our four kids all the way to Mexico. Actually, we got out of the car in Brownsville and crossed the Rio Grande by walking over a bridge. Another time, we drove to Las Vegas and stayed seven nights. Who takes four kids to Vegas?

We couldn’t afford it, but we went on vacation every year.

The financial advisor, Dave Ramsey, would be appalled at my lack of fiscal accountability. The idea of putting an expensive vacation on a credit card is totally irresponsible. On the other hand, my kids had only one childhood. Vacations were the best thing we did.

14. Golf Is an Addiction

Golf is a wonderful, but addictive, game. I’ve seen countless coaches resign from coaching “to spend more time with the family.” Their public declaration is a ruse. Instead, these ex-coaches play golf every day and, within a year, announce their new position as a dean, athletic director, or assistant principal.

The last time I played golf was in the 1983 “Elks Scramble” in Eldorado, Illinois, three months before I got married. I remember the day well because I lost a small fortune playing craps at a post-tournament party. I haven’t played golf since.

Seriously, golf is a time-eating monster. Playing 18 holes of golf steals the day. If this happened once per week, there wouldn’t be a problem. However, coaches don’t play golf, they intensely compete. When you want to be the best you can be, you work at it every day. When you add socializing to the time commitment, the harm to your family and coaching career may be significant.

When you consider the expense, golf can be viewed as the cocaine addiction of the sports world.

Don’t get addicted to golf. Instead, do something inexpensive, healthy, and family friendly… run.

15. Consider Writing

I did not write my first article until after my youngest son graduated from high school. It seems strange that my hobbies are now running, reading, and writing. Writing does not quiet my mind like running and reading, but there’s a special relationship between all three.

How is my writing related to running and reading? When I run, my mind gets creative. Almost all of my ideas come to me when I’m running. No one taught me to write. Reading provides my only training as a writer. The knowledge that a sentence either sounds right or sounds awkward is a product of being a reader.

Why is writing a survival tip for coaches? Writing forces you to organize your thoughts. Writing helps you to refine your coaching philosophy and articulate your beliefs.

Writing helps organize your thoughts, refine your coaching philosophy, articulate your beliefs. Share on X

If you can’t organize and prioritize your thoughts, how can you coach? Articulation is not just talking: It’s speaking in a way that connects with your athletes. Bad coaches get lost in minutia. Good coaches see things simply and emphasize the critical points. Writing is an effective way to condense and distill your thoughts.

16. Make It Look Easy

Some people have taken the advice, “fake it till you make it.” I don’t like faking it. Presenting your material with confidence is a good thing, but your material needs to be good, too. I have no respect for coaches who don’t attend clinics and don’t read.

One of my favorite Bob Dylan quotes is, “But I will know my song well before I start singing.” It takes years of work to make things look easy.

If someone shadowed me on a typical school day, he or she would probably be disappointed. I make my job look easy. No one would see the work I did to relearn the chemistry that I had long-forgotten. (I started teaching chemistry in 1997, 18 years removed from college chemistry.) No one would see the evolution of my teaching methods; making my classroom easier to manage and more fun to teach. No one would see the mistakes I made and the lessons I learned.

17. Less Is More

American high schools are inexpensive teenage daycare centers, but coaches are not babysitters. As a track coach, I’m no one’s babysitter. Coaches chase excellence. We are not in the business of keeping kids busy until it’s time for dinner.

My track team is focused on results, not practice. Like Steve Jobs, I am focused on content, not process.

I’ve witnessed “process coaches” who filled practice with nonsensical time-eaters. Below is a parody based on a couple of guys I’ve observed in my coaching career. You wouldn’t believe the garbage I’ve seen them do in an attempt to fill two hours (or three hours) of practice time.

Old School Sprint Practice (2 hours)

  • Allow sprinters to play grab-ass (10 min)
  • Take roll and rant about those not present (10 min)
  • Stretch and waste time warming up (20 min)
  • Explain workout and listen to sprinters complain (10 min)
  • Preach about how today’s athletes lack toughness (10 min)
  • Run 10 x 200 into the wind (30 minutes), with first 200 slow and each one after getting progressively slower
  • One mile cool-down (10 minutes)
  • Team meeting about lack of leadership and low enthusiasm (20 min)

My sprint practice starts at 2:45 and we never go past 3:30. We do the essentials and we go home.

Regardless of the sport, practice should be short. The maximum length of any practice, including football, should be no more than two hours.

Regardless of the sport, practice should be short. Do the essentials and then go home. Share on X

Short practices are good for coaches and the families of coaches. More importantly, short practices are good for student-athletes and the families of student-athletes. I’ve witnessed my own sons come home from football practice too tired to eat. How can this be good for a teenager?

18. Divide the Labor

My grandparents led a life typical of the WW2 generation. My grandfather owned an auto parts store and my grandmother ran the home. I don’t think my grandfather ever did laundry, dishes, cleaning, cooking, or any other domestic jobs. My grandmother’s work never earned her a dollar. Life was good, especially for my grandfather.

Modern life requires a different arrangement. If both parents have full-time jobs, domestic work must be shared. For some reason, many coaches are alpha male WW2-types who come home from a 10-hour day and expect a duty-free evening.

No coach can survive without harmony at home. Raising four kids and keeping up with domestic work was overwhelming at times, but we got it done. The operative word is, of course, we.

+++

If someone asked me to sum up my article in 140 characters or less, I would answer: “Find the work you love, invest your heart and soul, then find a way to balance work and family.”

We all need to ask ourselves, “Am I investing in the right activities?”

Essentialism has taught me that we all have a choice. We can be good at a few things or we can be half-assed at everything. If you don’t have an end game, you may live by default, not by design.

“If you don’t know where you are going, you will probably end up somewhere else.” – Lawrence J. Peter

Too many people fail to make a high level of contribution because they spread themselves too thin. Their career becomes an attempt to look good, rather than actually being good. Their fraudulent performance forces them to echo the ideas of their bosses to appear competent and important.

Recently, Mike Pence, Trump’s vice presidential pick, described himself as a “Christian, Conservative, Republican, in that order.” It’s important to define yourself. If you can’t define yourself, someone else will.

I’m not a Christian Conservative Republican. I am a teacher and a coach. I am also a husband, father, and soon-to-be grandfather. Balancing coaching, teaching, and home life allowed me to be reasonably good at all three. Believe me, a state championship would be meaningless without a happy home. Winning on Friday night would seem hollow if not for my classroom.

To all of you young teacher-coaches out there, always appreciate the uniqueness of your job. You inspire kids and chase excellence on a daily basis. You have the opportunity to share your work with your spouse and kids. When you fight through those tough weeks, remember summer vacation is coming soon.

I remember telling my daughter, “It’s spelled J-O-B, not F-U-N.” I am very fortunate to have a job that still stirs my blood.

I hope my survival tips will help coaches stay in the game.

Since you’re here…
…we have a small favor to ask. More people are reading SimpliFaster than ever, and each week we bring you compelling content from coaches, sport scientists, and physiotherapists who are devoted to building better athletes. Please take a moment to share the articles on social media, engage the authors with questions and comments below, and link to articles when appropriate if you have a blog or participate on forums of related topics. — SF

Runner wearing heart rate monitor

Age-Predicted Heart Rate Calculators for HR Training: Valid or Invalid?

Blog| ByDominique Stasulli

Runner wearing heart rate monitor

Age-predicted heart rate formulas have long been used in the athletic and fitness communities as a way to measure and safely prescribe exercise intensity, but little research exists about how those equations were derived. And there are numerous discrepancies surrounding these formulas which are considered commonplace.

Further research is needed to determine more valid and reliable methods to measure maximum heart rate for all age groups, genders, and fitness levels within practical resource means.

Developing a standardized approach to achieve more valid and reliable methods to measure maximum heart rate has been an ongoing challenge to scientists, especially considering the number of variables that can affect testing protocol.

These same variables can greatly affect the implementation of heart rate training on a daily basis. This potentially renders it less than adequate for prescribing specific intensities during a session with the intent to achieve a particular adaptation.

The most commonly used and well-known formula is 220 minus an individual’s age, which gives the age-predicted heart rate maximum value (Robergs & Landwehr, 2002). Unfortunately, this formula, nor any other derivative of age-predicted heart rate max, has accurately predicted maximum heart rate on a consistent and individualized basis within a reasonably narrow window of standard deviation.

In fact, this formula was never derived from original scientific evidence, but rather, from observation and compilation from other invalidated research sources (Robergs & Landwehr, 2002). There are numerous variables unaccounted for by these formulas. These include training experience, stress level, efficiency, adaptation level, hemoglobin content of the blood (oxygen carrying capacity), training phase, recovery status, health status, pre-existing health conditions, medications, and more. All of these can drastically affect heart rate and perceived exertion at a given exercise intensity each day.

Physiologically, to compete with the demand for oxygen delivery to the muscles and blood distribution requirements, the natural cardiac response to physical exertion is to increase the heart’s contractility and stroke volume to supply this demand. The two variables that directly play into cardiac output (CO) are stroke volume (SV) and heart rate (HR) such that CO = SV x HR. Therefore, if either one or both of these is amplified or diminished, CO is proportionally affected.

Heart rate max generally decreases with age and diminishing fitness levels and is also influenced by gender (Esco et al., 2015). The most accurate way to determine this value is by maximum exercise testing. Because this is not always practical or feasible for the general population, a heavy reliance on age-predictive formulas has ensued.

Daniels (2014) discusses the correlation between heart rate, velocity at VO2 max (vVO2 max) and blood lactate relating to training adaptation over time. The notion is that with advancement in training, the measured heart rate and blood lactate values associated with an improved VO2 max and vVO2 max were once the values representing lower levels of fitness and speed at a given intensity (Daniels, 2014). Essentially this means that, if a runner can perform at a faster speed with the same heart rate and blood lactate production levels as he or she has done at slower speeds in the past, they have adapted to a given training stimulus and become more efficient as a result.

In this respect, heart rate can be utilized to measure and record training adaptations over time. Relatively speaking, a given starting heart rate per intensity can be compared to the measured heart rate at the same intensity over time.

Typically exercise intensity is prescribed as a percent of the heart rate maximum, which is initially predicted with the infamous age-adjusted calculators, or sometimes through a graded exercise test.

The question remains, if the starting maximum heart rate is predicted incorrectly, does this affect the derived percentage intensities? Or is it all relative regardless of how inaccurate the initial starting number? Or, if the max heart rate is off by 10%, then the subsequent percent heart rates also will be 10% off. This is equivalent to all of them being 100% accurate, right? Let’s test this theory:

According to Daniels (2014), the associated heart rate intensities for a given running pace are distributed as follows:

  • Easy/Long Run Pace: 65-79% of Max HR
  • Marathon Pace: 80-85% of Max HR
  • Threshold Pace: 82-88% of Max HR
  • Interval Pace: 90-100% of Max HR
  • Repetition Pace: 97+% of Max HR

So if we have John Doe, age 45, with a Predicted Max HR of (220-45 = 175), his respective heart rate measured in beats per minute (bpm) would be as follows:

  • Easy/Long Run Pace: 65-79% of Max HR – 114 to 138 bpm
  • Marathon Pace: 80-85% of Max HR – 140 to 149 bpm
  • Threshold Pace: 82-88% of Max HR – 144 to 154 bpm
  • Interval Pace: 90-100% of Max HR – 158 to 175 bpm
  • Repetition Pace: 97+% of Max HR – 170+ bpm

Now if John Doe’s actual heart rate were measured at 186 bpm by a graded exercise test, representing a 6.3% difference in maximum heart rate, the values would be as follows:

  • Easy/Long Run Pace: 65-79% of Max HR – 120 to 147 bpm
  • Marathon Pace: 80-85% of Max HR – 149 to 158 bpm
  • Threshold Pace: 82-88% of Max HR – 153 to 164 bpm
  • Interval Pace: 90-100% of Max HR – 167 to 186 bpm
  • Repetition Pace: 97+% of Max HR – 180+ bpm

As we can see from comparing the actual versus the predicted numbers, the actual appropriate intensities for John are staggered by nearly an entire pace level up, which represents a 6 bpm to 10 bpm difference from the predicted values. Since there is not an even distribution across all intensities, it isn’t safe to assume that all adaptations to training are relative to the initial measurements. Clearly the values are not directly proportional to one another.

Coaches take a large risk prescribing exercise based on predicted percentage of heart rate values. Share on X

Coaches take a large risk when prescribing exercise based on predicted values. There is some overlap at the lower intensities of training, so having John keep his heart rate at an average of 132 bpm for an ‘easy run’ would satisfy both the predicted and actual ranges. However, if John performs his intervals at 160 bpm, in reality, only satisfies the threshold category of training. This which means John would achieve a drastically different outcome from that training session.

Daniels (2014) does note that these generic formulas may be useful for estimating heart rate for a large group of people. On an individual basis, however, there are more accurate ways to prescribe intensity that involve actual performance-based values and account for an athlete’s specific physiology and training background.

Nikolaidis (2014) compared the use of three separate heart rate max equations against a measured maximum in an age group-distributed sample of sport athletes under 18 years-old. Two of these equations are widely used, and one has recently been developed, respectively:

  1. Fox-HRmax = 220-age
  2. Tanaka-HRmax = 208 – (0.7 x age)
  3. Nikolaidis-HRmax = 223 – (1.44 x age) (Nikolaidis, 2014)

To physically measure heart rate max, all of the athletes participated in a graded exercise field assessment involving the 20m shuttle run endurance test (Nikolaidis, 2014). A total 147 athletes across a wide variety of sports (soccer, futsal, basketball, and water polo) were assessed for both a predictive and actual measurement. The values were then compared for data analysis.

This study found that none of the predictive heart rate equations provide accurate values of heart rate max in the sample of young athletes. The Tanaka-HRmax equation underestimated the actual max, and Fox-HRmax and Nikolaidis-HRmax overestimated the actual max across the whole sample.

Equations that overestimate this value can lead to athletes working at a higher intensity than desired and those that underestimate can lead to a lack of stimulus for adaptation. The equations could not be validated in this study. If, however, they are the limiting factor in developing an exercise program, the Tanaka-HRmax equation can be used when coaches want to avoid overtraining. The Fox-HRmax and Nikolaidis-HRmax equations can ensure that adequate intensity stimulus is provided (Nikolaidis, 2014).

In a similar study involving female collegiate athletes from 19 to 25 years-old, three general equations, and two female-specific equations were compared for accuracy against a treadmill-based graded exercise test using the Bruce protocol (3-minute stages with consecutive increases in speed and grade) (Esco et al., 2015). With this protocol, expired gas fractions are monitored by a metabolic cart to assess the respiratory exchange ratio of oxygen to carbon dioxide.

This gives insight as to how the individual is handling the increasing work rate and shows when they pass through the aerobic-anaerobic threshold and the VO2 max is approaching (as indicated by a plateau in oxygen consumption). The highest recorded value of VO2 is then matched with the corresponding heart to determine the maximum heart rate value of an individual athlete (Esco et al., 2015).

The three general predictive formulas used were:

  1. Fox-HRmax = 220-age
  2. Tanaka-HRmax = 208 – (0.7 x age)
  3. Astrand-HRmax = 216.6 – (0.84 x age)

The two female-specific formulas were:

  1. Fairburn-HRmax = 201 – (0.63 x age)
  2. Gulati-HRmax = 206 – (0.88 x age) (Esco et al., 2015)

All of the equations resulted in large limits of agreement, ranging 10 bpm above and below the mean error, which is not a promising indication that any of these formulas provide a veritable function in exercise assessment (Esco et al., 2015).

The two female-specific formulas were “more accurate” than the three general equations. However, they still tended to over-predict when compared to the actual measured value. When graded exercise testing is not feasible due to a lack of availability of resources, other exercise-based protocols can be implemented, such as the 20m shuttle test mentioned earlier, 2 x 200m sprint trials, and similar assessments (Esco et al., 2015).

Since you’re here…
…we have a small favor to ask. More people are reading SimpliFaster than ever, and each week we bring you compelling content from coaches, sport scientists, and physiotherapists who are devoted to building better athletes. Please take a moment to share the articles on social media, engage the authors with questions and comments below, and link to articles when appropriate if you have a blog or participate on forums of related topics. — SF

References

  1. Daniels, J. T. (2014). Daniels’ Running Formula (3rd ed.),. Champaign, IL: Human Kinetics.
  2. Esco, M. R., Chamberlain, N., Flatt, A. A., Snarr, R. L., Bishop, P. A., & Williford, H. N. (2015). Cross-Validation of Age-Predicted Maximal Heart Rate Equations Among Female Collegiate Athletes. Journal of Strength & and Conditioning Research, 29(11), 3053-3059. doi: 10.1519/JSC.0000000000000978.
  3. Nikolaidis, P. T. (2014). Age-predicted vs. measured maximal heart rate in young team sport athletes. Nigerian Medical Journal, 55(4), 314-320. doi: 10.4103/0300-1652.137192
  4. Robergs, R. A., & Landwehr, R. (2002). The surprising history of the “Hrmax=220-age” equation. Journal of Exercise Physiology (online), 5(2), 1-10.
Baseball coach with young boy

How Coaches Contribute to Athletes’ Motivation

Blog| ByDominique Stasulli

Baseball coach with young boy

Coaches can develop psychologically motivated athletes with positive self-regard by creating self-worth and a sense of belonging and by limiting judgmental comparisons to other athletes’ success. Coaches can also boost autonomy in their athletes by encouraging self-monitoring, performance reflection, and honest evaluation of physical and emotional well-being.

An athlete’s motivation plays a fundamental role in performance and perceived ability. Motivation comes from internal and external sources, so both nature and nurture contribute to the whole drive of the athlete.

In many ways, the coach plays a pivotal nurturing role by responding to an athlete’s emotional and physical needs. The surrounding climate dictated by the coach, whether it’s critical or motivational, affects the athlete’s psychosocial well-being.

Research delineates two types of climate atmospheres: task-oriented and ego-oriented (Reinboth & Duda, 2004). Task-oriented climates encourage the mastery of the task at hand, skill development, and knowledge acquisition, while ego-oriented climates focus on the individual’s performance and effort relative to other competitors (Reinboth & Duda, 2004).

Stress is an important consideration in an athlete’s overall well-being and can be inversely related to self-esteem. Coaching pressures often cause distress to those athletes who have an egocentric mindset and performance climate. An ego-involved climate can endanger the athlete’s self-esteem with constant social comparison and questions about their adequacy (Reinboth & Duda, 2004).

The same, however, is not true for athletes who aim to master tasks (Pensgaard & Roberts, 2000). In the task-focused climate, self-esteem can be built up gradually with individual development where improvement is only measured by comparing to oneself based on work ethic. Emphasis on the process rather than the immediate outcome contributes positively to self-esteem (Reinboth & Duda, 2004).

Emphasis on the process, not the immediate outcome, contributes to an athlete’s self-esteem. Share on X

In a study by Ruiz-Tendero and Salinero Martin (2012), the researchers found that coaches and athletes equally regarded dedication as the most influential factor of motivated success.

In the same survey, both coaches and athletes voted injuries as the number one factor negatively impacting performance. There is an ego-driven belief that enduring pain and winning are the strongest measures of an athlete’s reputation and success.

Coaches should strongly urge athletes to be smart about their competitive mindset and the damaging consequences of training ignorance. When sustained injuries challenge the athlete’s mental fortitude, mental toughness is better measured with humble honesty rather than stubborn pride.

Coaching environments can either foster or forgo mental toughness, a supplementary component in the motivational toolbox. A supportive environment acknowledges “feelings and perspectives, the use of non-controlling actions and feedback, the provision of meaningful rationales, and the nurturing of individuals’ inner motivational resources” (Mahoney, Gucciardi, Ntoumanis, & Mallet, 2014, p. 282).

Controlling environments provide just the opposite: intimidation, reward manipulation, and negative regard for emotional influence on performance (Mahoney et al., 2014).

One of the best coaching skills is the ability to bring positive enthusiasm to athletes. A 2014 study found a positive correlation between athlete optimism and race times and an inverse relation to negativity (Mahoney et al., 2014).

Without guidance, encouragement, and positive feedback from the coaches, athletes may experience discouragement, lack of motivation, unwarranted anxieties, and burnout.

Since you’re here…
…we have a small favor to ask. More people are reading SimpliFaster than ever, and each week we bring you compelling content from coaches, sport scientists, and physiotherapists who are devoted to building better athletes. Please take a moment to share the articles on social media, engage the authors with questions and comments below, and link to articles when appropriate if you have a blog or participate on forums of related topics. — SF

References

  1. Mahoney, J. W., Gucciardi, D. F., Ntoumanis, N., & Mallet, C. J. (2014). Mental Toughness in Sport: Motivational Antecedents and Associations with Performance and Psychological Health. Journal of Sport Exercise Psychology, 36(3), 281-292. doi: 10.1123/jsep.2013-0260.
  2. Pensgaard, A. M. & Roberts, G. C. (2000). The relationship between motivational climate, perceived ability and sources of distress among elite athletes. Journal of Sports Sciences, 18(3), 191-200. doi: 10.1080/026404100365090.
  3. Reinboth, M. & Duda, J. L. (2004). The motivational climate, perceived ability, and athletes’ psychological and physical well-being. The Sport Psychologist, 18(3), 237-251.
  4. Ruiz-Tendero, G. & Salinero Martin, J. J. (2012). Psycho-Social Factors Determining Success in High-Performance Triathlon: Compared Perception in the Coach-Athlete Pair. Perceptual & Motor Skills: Physical Development and Measurement, 115(3), 865-880. doi: 10.2466/08.25.PMS.115.6.865-880.
Female 100 meter sprinters

Want to Win Meets? Avoid These Three Coaching Mistakes

Blog| ByTim Daggett


Female 100 meter sprinters

As head track and field coach at The Classical Academy High School in Colorado Springs, I’ve led our team to 13 Colorado State Championships: 7 girls’ championships and 6 guys’ championships.

I’m often asked, “What’s the secret?”

I don’t believe there’s a specific secret, but if you want to build a winning culture for your program, you need to avoid these three common mistakes.

One

You are Not Present

As the head coach, I attend everything we do. If a coach is not a presence in the building, there’s a disconnect. It starts with me and ends with me. When we have practice or a weightlifting session with the strength coach or smaller training sessions, I make a point to be there, or I’ll lose that presence with my team.

Two

You Fail to Build Mental Toughness

Coaches undermine themselves constantly when it comes to their team’s mentality. In other words, they lose the mental war. In Colorado, for example, the weather is not great in the Spring. I combat that by always practicing outside, no matter how miserable it is; we don’t succumb to forces outside of ourselves.

Do not create a “victim of circumstance” mentality. I’ve spent a lot of time shoveling the track because, for us, we are going to win regardless of adversity. I am the start of that. We like the phrase, “Shared suffering is shared reward.” And that shows in our team’s mental toughness.

Three

You Promote a Self-Centered and Numbers-Centered Culture

We de-emphasize individualism and numbers. We make a big deal of our team environment because it gives us motivation, retention, and a reason to run. If a kid’s only motivation is their own success, their passion will hinge on their times and their numbers. Ultimately, they’ll feel empty and will fall short. We make a point to motivate kids with a sense of shared community.

We motivate our high school athletes with a sense of shared community. Share on X

We don’t have team goals. We don’t go into a season thinking we’re going to win the state championship; we de-emphasize all of that. When we’re tempted to ask ourselves, “What do we want to do as a team?” we try to instead ask, “What kind of team do we want to be?” Team competition and motivation occur naturally because of the nature of the sport, and we don’t have to talk about times and competition to make that happen.


Want to Become a Better Coach This Year?

Glazier Track and Field Clinics is offering free clinics around the country this Fall and later in the Winter and next Spring. Quality coaches are good learners. Time spent at a clinic can be the best opportunity to build your coaching knowledge, experience camaraderie as a staff, and lay the foundation for next season.

Clinics this Fall:

  • Atlanta – 9/16-18
  • Dallas – 9/30 – 10/2
  • Los Angeles – 9/30 – 10/2
  • N. Virginia / D.C. – 9/16-18

Since you’re here…
…we have a small favor to ask. More people are reading SimpliFaster than ever, and each week we bring you compelling content from coaches, sport scientists, and physiotherapists who are devoted to building better athletes. Please take a moment to share the articles on social media, engage the authors with questions and comments below, and link to articles when appropriate if you have a blog or participate on forums of related topics. — SF


  • « Go to Previous Page
  • Page 1
  • Interim pages omitted …
  • Page 159
  • Page 160
  • Page 161
  • Page 162
  • Page 163
  • Page 164
  • Go to Next Page »

Primary Sidebar

Latest Posts

  • The Six Absolutes of Perfect Technique
  • Building a Better High Jump: A Review of Stride Patterns
  • How We Got Our First Sprint Relays to State in Program History

Topics

  • Changing with the Game
  • form and technique
  • Game On Series
  • Getting Started
  • high jump
  • Misconceptions Series
  • Out of My Lane Series
  • Rapid Fire
  • Resistance training
  • Summer School with Dan Mullins
  • The Croc Show
  • track and field
  • What I've Added/What I've Dropped Series

Categories

  • Blog
  • Buyer's Guide
  • Freelap Friday Five
  • Podcasts

COMPANY

  • Contact Us
  • Write for SimpliFaster
  • Affiliate Program
  • Terms of Use
  • SimpliFaster Privacy Policy
  • DMCA Policy
  • Return and Refund Policy
  • Disclaimer

Coaches Resources

  • Shop Online
  • SimpliFaster Blog
  • Buyer’s Guide
  • Freelap Friday Five
  • Coaches Job Listing

CONTACT INFORMATION

13100 Tech City Circle Suite 200

Alachua, FL 32615

(925) 461-5990 (office)

(925) 461-5991 (fax)

(800) 634-5990 (toll free in US)

Logo of BuyBoard Purchasing Cooperative. The word Buy is yellow and shaped like a shopping cart, while Board and Purchasing Cooperative are in blue text.
  • Facebook
  • Instagram
  • Twitter
  • YouTube

SIGNUP FOR NEWSLETTER

Loading

Copyright © 2025 SimpliFaster. All Rights Reserved.