Analysis of Keni Harrison’s World Record 100m Hurdles Race

Summary
Keni Harrison set the new World Record for 100m hurdles by executing the best combination of flight times and run times of all other hurdlers. Pierre-Jean Vazel analyzes every aspect of Harrison’s race using videos showing various points of view plus rare, unpublished data.
When Keni Harrison set the new World Record (WR) for 100m hurdles with a time of 12.20 in July 2016, she erased the 28-year-old record of 12.21 set by Bulgaria’s Yordanka Donkova.
How did Harrison manage to beat Donkova’s time? To find the answer, I dug into the archives of rare and/or unpublished data from Bulgarian studies, and I used my high-speed cameras to capture the world’s best hurdlers.
When Harrison crossed the finish line, the time displayed on the screen was 12.58. But for spectators, Harrison seemed too fast and the rest of the field too far behind for this time to be true.
Yes, Harrison ran 12.20 and no, she did not lean under the photocells. To be exact, Harrison’s time was 12.194. Why did the time 12.58 appear first? There’s a bug in the timing system.
Before analyzing Harrison’s race, I’ll explain how the timing works.
The Timing Bug
OMEGA uses two pairs of photoelectric cells on the finish line so that a time can be shown instantly. Actually reading and interpreting the photo finish takes additional seconds, sometimes minutes. In one case it took years: Donkova’s 12.35 WR in Cologne in 1986 was submitted as 12.34 to the IAAF for ratification, but a closer examination of the photo finish showed 12.35.
One pair of cells is placed 1.10m high from the ground, the second at 1.25m. To stop the clock and to prevent false times (caused by such things as a runner’s hand or a flying animal), both cells must detect movement. This time appears on the stadium board and TV screens. In Harrison’s WR race in London, the clock showed 12.58, which turned out to be the time for the second finisher, Brianna Rollins.
Did Harrison lean too low and go below the radar? No, it’s unlikely, unless a runner dives over the finish line. This did happen recently during the Rio Olympics when Shaunae Miller dived across the finish line in the 400m race. The timing bug also occurred in this race. The screen displayed Miller’s time as 49.51, but the photo finish showed Miller ran 49.44, and Allyson Felix got 49.51.
Miller’s finish followed Kumari Taki’s dive to win the 5000m final at 2016 World U20 Championships:
Harrison’s World Record Finish
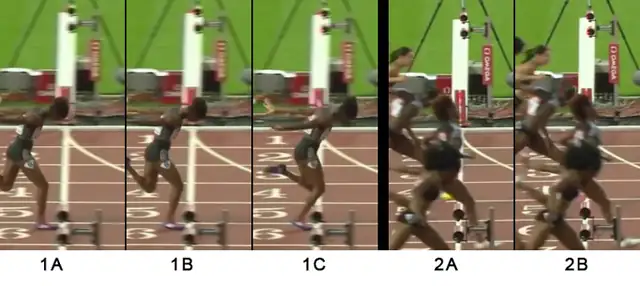
This photo sequence shows Harrison’s finish:
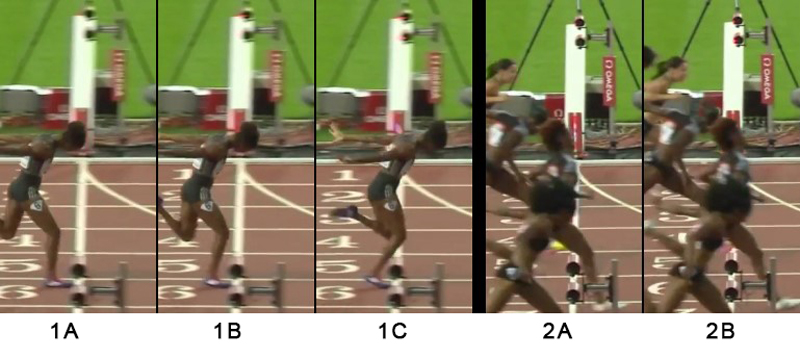
Figure 1A. Harrison closes to the finish line and the two pairs of cells (black circles on the finish line).
Figure 1B. Harrison’s head meets the upper cell, as indicated by the small red light signal.
Figure 1C. Harrison’s torso meets the lower cell, but there’s too much delay between the two events, and the system doesn’t recognize her as the same object so the clock does not stop.
Figure 2A. The second runner, Rollins, closes to the finish line while the clock is still running.
Figure 2B. Rollins’ body (and possibly Kristi Castlin’s head) meets both cells virtually at the same time, as seen by the small red lights, and she stops the clock at 12.58. After reading the photo finish, Rollins’ time must have been between 12.561 and 12.570 to be attributed an official time of 12.57, according to IAAF rules. OMEGA has released Harrison’s unofficial time to the thousandth: 12.194.
The World Record Race
I combined the data from Bulgarian records with footage of Harrison’s race from videos showing various points of view: three high-speed and four normal speed cameras; two front planes; four panoramic sagittal planes at the start, middle and finish of the race; and one traveling sagittal plane. During the 12.20 race, I recorded times for each interval (8.50m between obstacles) taken at the time of contact of each landing after a hurdle.
2.49, 3.49, 4.45, 5.40, 6.33, 7.27, 8.21, 9.15, 10.11, 11.10
After a 0.149 reaction time, Harrison led the race, passing the 10m mark in 1.98, which the best sprinters achieve during world class 100m finals. I don’t have Donkova’s 10m time for her 12.21 WR, but for her 12.29 WR in 1986, she did 2.01.
Because Harrison didn’t land her leading foot close to the hurdle, her time at the first hurdle is not the fastest ever recorded. Cornelia Oschkenat was timed by Dr. Miskos (Athletics Laboratory UV CSTV, Prague) at 2.47 at the first hurdle during her semifinal at the 1987 World Championships and in 2.48 for 60m hurdles at the European Athletics Indoor Championships (European Indoor) and 7.77 in 1988.
During her career, Donkova tried to use 7 steps to the first hurdle instead of the traditional 8 and managed to decrease her time at the first hurdle touchdown. But then her times slowed down in the race’s first couple of intervals. Since her acceleration pattern suffered, she stuck with the 8-step approach.
It’s interesting to note that the 7-step has been tried for a long time; the first woman under 13 sec. electric time, Chi Cheng, 12.93 in 1970, used 7 steps. But, the 7-step has never really clinched for female hurdlers, unlike their male counterparts. From the start line to the first hurdle, the 13m distance is a closer match to women’s usual sprinting acceleration pattern as opposed to men’s who have a 13.72m distance.
The unit analysis shows that Harrison reached her top speed between the 5th and 6th hurdle, after about 6 sec, similar to normal times recorded for 100m dash sprinters.
1.00, 0.96, 0.95, 0.93, 0.94, 0.94, 0.94, 0.96, 0.99
Donkova’s 12.21 race is yet to be seen on video. The race that’s available on YouTube titled Women’s 100m Hurdles World Record is not the 12.21 race on August 20, 1988, in Stara Zagora. It’s been said the racers ran in the opposite direction to take advantage of the wind. And, as strange as it sounds, only four women were competing. One did not finish and the second place winner was timed at 14.74.
Donkova, then, won by a 2.53 margin. Her touchdown times have never been published outside Bulgaria, and I’m happy to share them:
2.50, 3.47, 4.42, 5.34, 6.24, 7.19, 8.16, 9.14, 10.11, 11.14
0.97, 0.95, 0.92, 0.90, 0.95, 0.97, 0.98, 0.97, 1.03
Note: These times should be taken with a grain of salt because it’s very unusual for an athlete to lose 0.05 from one interval to another, and the 0.90 unit is dodgy.
Excluding Donkova’s possibly not-so-accurate intervals, 0.94 is the fastest unit I’ve found for her, and 0.93 is the fastest unit I know of during 100m hurdles. A 0.94 interval is quick enough to run 12.20, according to the models published in East Germany and the Soviet Union as well as my own recent models using the latest analysis.
A compilation of the all-time best interval units shows that Harrison achieved an outstanding top speed.
- 1-2H 0.97 Lolo Jones (7.72 Doha WI ’10)
- 2-3H 0.95 Gail Devers (12.46 Stuttgart WC ’93), 0.95 Keni Harrison (12.24 Eugene ’16)
- 3-4H 0.93 Lyudmila Narozhilenko (7.68 San Sebastian ’93), Lolo Jones (7.72 Doha WI ’10)
- 4-5H 0.93 Keni Harrison (12.20 London ’16)
- 5-6H 0.93 Brianna Rollins (12.34 Eugene NC ’16)
- 6-7H 0.94 Several women
- 7-8H 0.94 Gloria Uibel (12.44 Roma WC ’87), Keni Harrison (12.20 London ’16)
- 8-9H 0.95 Brianna Rollins (12.26 Des Moines NC ’13)
- 9-10H 0.97 Ginka Zagorcheva (12.34 Roma WC ’87)
To determine a theoretical time for a perfect 100m hurdles race, I added the total of these best world times to the 2.47 approach by Oschkenat and the 0.98 time between the touchdown at last hurdle and the finish line by Devers at 1993 World Championship.
The result is 11.96 for the perfect 100m hurdles. Of course, this is hypothetical because it doesn’t take into account energy distribution.
The perfect time, hypothetically, for 100m hurdles is 11.96. Share on XHurdling Technique
It’s a persistent myth that hurdle clearance time is the most important factor in competition results. At the 1991 World Championships, Japanese bio-mechanicians recorded participants’ flight times over the hurdles and run times between hurdles. The results showed that run times have a higher correlation with the final time.
Run times between hurdles, not clearance times, have a higher correlation with final time. Share on XYet total run times are not Harrison’s strong suit. Adding in her 9 interval runs without taking into account her hurdle clearance time, her 6.14 is not among the best ever.
Former World Champions Narozhilenko (12.28) and Devers (12.37) and African record holder Glory Alozie (12.44) have sub-6 sec totals.
Harrison’s total hurdle clearance times, 2.76 for 10 hurdles, is among the best. The 1982 European champion, Lucyna Kalek (12.44), and Ginnie Powell (12.45) have a 2.74, and Cindy Billaud did 2.75 for her French record (12.56).
Harrison maintained her shortest hurdle clearance time of 0.27 almost all through the race, while several other women might have hit 0.25 or 0.26, as recorded at 1991 World Championships, but failed to maintain this rhythm.
Donkova, who was a sharp technician, achieved a personal best hurdle clearance of only 0.28 during her 12.21 WR. This is not where she improved over the years. In 1980, she had a 0.31 clearance when she was a 13.24 hurdler while she decreased her run time from 0.73 to 0.64.
It turns out, Harrison has the best combination of all hurdlers.
Of all hurdlers, Keni Harrison has the best combination of flight times and run times. Share on XThe first step after the hurdle is important since that’s where the hurdler accelerates after losing speed from the takeoff in front of the obstacle. The runner also loses velocity during each foot contact so foot contact should be as short as possible.
This is where Donkova excelled with the best times, especially during takeoff, when her contact times were as short as 0.09. She was even timed at 0.083 before the 8th hurdle during the 12.21 WR.
Harrison’s takeoff time is slightly over 0.100 but, at touchdown after the hurdle, she is faster than Donkova at 0.08 vs. 0.083. Only Sally Pearson (12.28 for her 2011 World title) has done better.
Harrison deviates from the model with long air time after the first step. This could explain why, by the third step, she sometimes gets too close to the hurdles. From the front-plane view, you can see that she does side steps. She’s actually running more than 100m.
Training
To achieve 0.93 units in competition, hurdlers work on time or the corresponding speed, 9.14 m/s, by using shorter distances between the hurdles. Harrison has hit 0.92 with 8.25m distance, which is 8.96 m/s, according to her coach, Edrick Floreal. At warm-up before her WR, Harrison used much shorter 7.50m intervals and had best interval times of 0.82-0.83, which is 9.14-9.04 m/s.
Interestingly, Donkova didn’t use distances shorter than 8.10 because her coach believed it would create a different rhythm pattern. They favored 8.15-8.50m intervals.
In August 1988, just days before the 12.21 WR, Donkova ran a significant training workout of 110m with 12 hurdles and 11 intervals at 8.30m distance. The first 5 intervals were run at an average 0.928, exactly as she did during the 12.21 competition, and the remaining 6 in 0.95, demonstrating great top speed and endurance speed.
Flat Speed
The annual progression of the two best hurdlers shows that the differential between 100m hurdle and 100m times, often referred as technical index, improves steeply in their first years and then stagnates.
| Harrison | Donkova | |||||||
| Year | 100m | 100H | Diff | Age | Year | 100m | 100H | Diff |
| – | – | – | – | 15 | 1977 | 12.62 | 14.84 | 2.22 |
| 2009 | 12.73 | 17.18 | 4.45 | 16 | 1978 | 12.47 | 13.91 | 1.44 |
| 2010 | 12.04 | 13.79 | 1.75 | 17 | 1979 | 12.18 | 13.57 | 1.39 |
| 2011 | 12.03 | 13.49 | 1.46 | 18 | 1980 | 12.17 | 13.24 | 1.07 |
| 2012 | – | 13.03 | – | 19 | 1981 | 12.04 | 12.9h | 1.10e |
| 2013 | – | 12.88 | – | 20 | 1982 | 11.27 | 12.44 | 1.17 |
| 2014 | – | 12.71 | – | 21 | 1983 | 11.42 | 12.65 | 1.23 |
| 2015 | 11.64 | 12.50 | 0.86 | 22 | 1984 | 11.62 | 12.50 | 0.88 |
| 2016 | 11.35 | 12.20 | 0.85 | 23 | 1985 | – | 13.24 | – |
| 24 | 1986 | 11.44 | 12.26 | 0.82 | ||||
| 25 | 1987 | 11.44 | 12.33 | 0.89 | ||||
| 26 | 1988 | 12.21 | ||||||
Keep in mind that their peak 100m times are underestimated because they ran too few races to accurately display their actual potential.
In May 2016, Harrison ran a 100m in 11.35 (0.7), and she called this a bad race. In a properly executed performance, she should be able to run 0.2 faster.
This would be better than Donkova, whose 11.27 personal best (PB) was set in 1982 (0.5) a week after setting the World Leader with 12.44. She must have run faster in the following years if the wind had not been negative for the few occasions she lined up: -1.2 for 11.42 in 1983, -1.2 for 11.44 in 1986, -3.0 for 11.44 in 1987.
Based on Donkova’s best training handheld times, probably achieved in advantageous conditions (wind and altitude), I’ve estimated the corresponding electric times (by adding 0.60):
- 30m 4.16 (100m projection time according to my model: 10.96)
- 60m 7.00 (100m projection: 10.90)
- 100m 10.98
She was probably worth around 11.10 if we also consider her anchor leg times in relays:
- 1987: 10.23 European Cup (fastest of the field, times in the open 100m/anchor relay leg: Marlies Göhr 10.95/10.37, Ewa Kasprzyk 11.45/10.50)
- 1988: 10.26 Olympic Games (Evelyn Ashford 10.83/10.06, Göhr 10.99/10.26, Patricia Girard 11.65/10.48)
Donkova’s step length at her top speed measured during relay races remained similar from 1982 to 1988 (2m22), and her top speed only had marginal gains. Improvement of high-step frequency, especially by decreasing the contact times during the run between hurdles, were her technical trend until 1988.
Can Harrison Capture the World Indoor Record?
Donkova’s indoor 60m hurdles best was 7.74, a WR in 1987.
If Harrison can duplicate her shape next winter, she should be able to run much faster than Donkova’s time, and Sanna Kallur’s current World Indoor Record of 7.68 held since 2008 will be in danger. Harrison will also probably erase Narozhilenko’s 7.63 unratified record due to her 1993 doping offense.
Harrison’s time at 60m was 7.65 (high-speed camera placed at 60m), but theoretically, she could run faster since she had 6 hurdles instead of 5. This winter, she set her PB at 7.77 after a 5th hurdle touchdown of 6.48. Her 1.29 run-in time added to her 6.33 would give her 7.62.
I now expect she’ll have a faster finish.
Author’s Acknowledgments
Special thanks to my friend Daniela who helped me translate Bulgarian material more than a decade ago during endless afternoons. Credits to statistician Aleksandar Vangelov who provided early performance data for Donkova. And I’m grateful to Pr Apostol Slavchev for helping me with documentation for my research.
