Team Culture
A few years ago, I decided to take our girl’s track and field program a step beyond workouts to become something truly special. With the help of my coaches and team captains, we came up with several ideas to improve the team’s sisterhood.

Big Sister Little Sister Program
One of the first things we implemented was the Big Sister Little Sister program. Track and field is one of the few sports kids don’t experience in elementary and middle school outside the scarce physical education (PE) track unit. We felt it was important for our rookies to bond with teammates during week one.
The big sister’s job is to help a rookie on the team through the tough first couple of weeks. They partner-stretch their little sisters during warm ups and help teach them the weight room routines during strength training.
After the first few weeks, they buy their little sisters personally decorated water bottles to bring to practice and track meets. The water bottles are handed out during our Red Carnation Ceremony. The Red Carnation Ceremony is a bit of an initiation where the big sisters fully welcome their little sisters by giving quick speeches about how excited they are for their little sisters to join them on the path to greatness.
At the Red Carnation Ceremony, each new athlete receives a flower from me. I address the new athletes as a group, officially welcoming them to the program. I chose the red carnation because red is our high school’s main color as well as the color of my college and fraternity. In my fraternity, TEKE, our flower was the red carnation which we gave to fraternity sweethearts. I’m a sentimental chap, and I always wax nostalgic at the Red Carnation Ceremony.

Team Theme Days
We stole this idea from Jim Lohr of Mary Institute and St. Louis Country Day School. The morning before most track meets, the girls dress up in goofy ways to celebrate the coming day’s meet. This is always meant to be fun and is never hazing kids.
Our go to themes are Dress Nice and Tennis Shoes, Pride & Pig Tails, and Twins. When other students see our kids dressed in a unique way, it gives our athletes the chance to tell their classmates about the upcoming competition.
We developed Dress Nice and Tennis Shoes to keep the kids from wearing outrageously dangerous stilettos or sandals that harm young people’s feet and ankles. Pride and Pig Tails is a fun way to dress up in school colors, face paint, accessorize with ribbons, etc. Twins is a day where the big sister and little sister dress the same. Girls who don’t have little sisters team up with a pair of girls to form triplets.
The girls decided Twins day was a nice way to honor my wife, who lost two of our triplet babies in a difficult pregnancy. Two of our daughters didn’t make it past in utero to this world, but this doesn’t mean their lives or anyone who loses a child to miscarriage should be diminished. The kids tend to do this team theme during the infertility week.
To say there are very few dry eyes would be the grandest of understatements. Kids will surprise you in unique ways. As heavy and sad as this seems, it allows me to share our story and celebrate the miracle that is our child, Isabelle, who lived. The message I try and share with the kids is life can be tough, but with the faith and love of a friend, we can overcome the most difficult things in life.

Team Breakfasts
We hold Team Breakfasts on the morning of a track meet. It’s hard to control what happens during the twenty-one to twenty-two hours your athletes are away from you. By providing a team breakfast, we give the kids a chance to have at least one healthy meal on the day of their event.
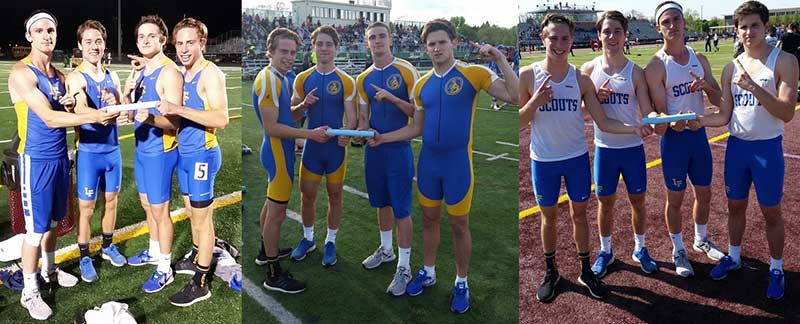
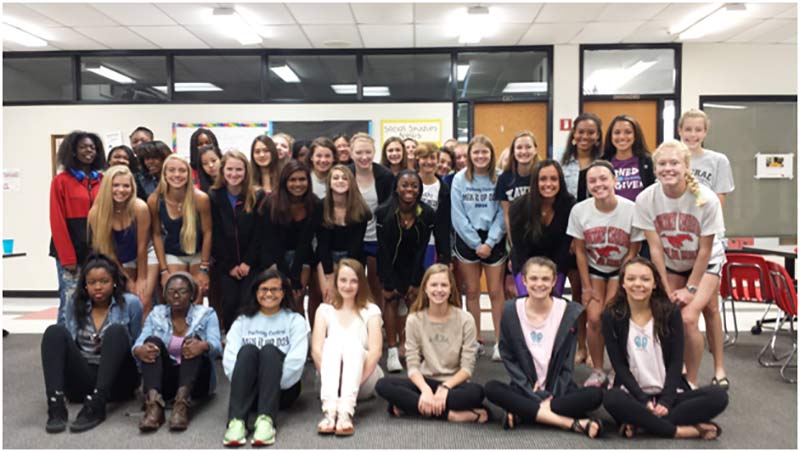
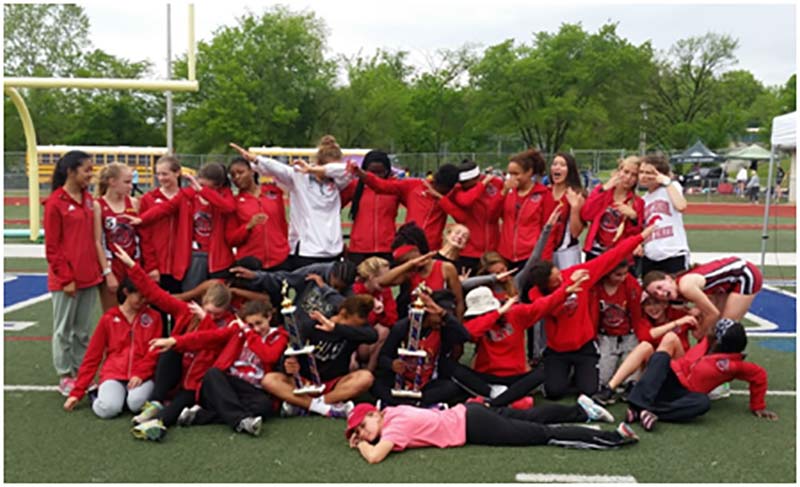
Our kids meet in my room which allows me to touch base with each of them before the meet for special instructions, injury issues, event changes, etc. The kids are responsible for bringing the snacks, plastic items, and drinks. Each week, we choose a different group of kids to bring the goodies. While we’re snacking, I play an Olympic or World Championship track meet highlight reel on my overhead projector. It’s fun and gets the kids inspired. Once we get a large enough number of athletes together, we take a group picture to post on social media.

Reward Systems: All World List, PR Bar, and Interval Cards
Pundits criticize rewarding kids for fulfilling basic expectations. On the other side of the spectrum, old school coaches rarely give their athletes a complement let alone a trophy or prize. Even the grandmaster of sport psychology says athletes should find intrinsic motivation, and extrinsic rewards don’t create the type of motivated athlete we are looking for long term.
Throughout the year, I do like to do small things for athletes of different abilities to help motivate them. It creates many small moments of positive energy that can be contagious to the rest of the team. Kids also become more aware of their progress.
Rewards create small positive moments that become contagious to the whole team. Share on XAll World List
When I first started coaching, I found it crucial to uncover as much of the girl’s track and field history I could. I wanted to create an accurate top ten list for our record book. Thankfully the few years before I started coaching, the leadership kept great records.
But as I worked back to the mid-1990s, I had no clue what former athletes ran, jumped, or threw in the regular season. I even went so far as to enter the Missouri State High School Athletics Association’s vault to look at the old state media guide and searched for Parkway Central state qualifiers. Sadly, I only found a handful of athletes.
I realized a historical top ten list would always be incomplete. At this point, I changed direction and created the All World List.
The All World List is different from a top ten. Instead of adding names to an increasingly difficult top ten list, I created a standard based on numbers and distances athletes must hit to be placed in Parkway Central’s track history books.
In the 200 dash, for example, an athlete must run under 28.00 seconds. The trick to the All World List is that the standards must require a high enough performance that most team members can’t hit the numbers without some talent or work. On the other hand, the standards need to be attainable to provide early motivation for athletes entering the program.
After a major meet, it’s always fun to add names to the list. I hope these lists become so long that our yearly track and field media guide will become hundreds of pages long. I always let the kids know when they’ve made the list and where they rank in school history. It’s so much fun to see the kids climb up the list during their school careers.
PR Bar
After reading Coach Guthrie’s book from his tenure at UW-Lacrosse, I implemented a Personal Record (PR) Bar reward system. Any time an athlete gets a PR, they earn a candy bar. Every couple of meets, we buy bags of individually wrapped candy bars to reward dozens of new PRs. I like the idea because even the slowest or least talented kid on the team will get many PRs throughout the season.
Occasionally giving the kids a candy bar also sends the message that it’s ok to enjoy sweets or treats. I always tell my kids, “It does not matter what the scale says, instead it’s about how you look and feeling in your clothing.”
We hand out the bars near the beginning of practice during our team huddle. We have all the athletes who hit a PR at the previous meet stand. Once all the PR athletes are standing, we go around from left to right and have the athletes tell us how many PRs they got and the mark they hit in the event.
Each PR gets a Colt Clap. A Colt Clap is one loud unified clap by the kids. The single clap quickens the time it takes to recognize all the PRs and limits wasted time if you have a long training session planned for the day.
Interval Card
I developed the idea for an interval card while watching Willy Wonka when the characters found Golden Tickets. We give the interval card to an athlete who has done something truly special in practice or at a meet. An athlete can use the ticket to sit out an interval during any workout the rest of the season.
It’s amazing how much harder a sprinter will work for the chance to get out of an interval in the future. Having this option also lets a kid who needs a break to take one without feeling guilty. What I find really humorous, though, is that some of the athletes never cash in the ticket.
To use this reward effectively, specific rules must be followed, or the interval card could be abused.
- I never allow sprinters to use the card on the longest interval in practice. Speed endurance is an important component of success on the track. This sends the message that everyone has to do the longer and tougher intervals when scheduled.
- An athlete can only use one per practice. I have key workouts in the middle and late part of the season, and I don’t want my athletes to hoard the cards to miss an entire practice. A complete absence from practice disrupts our training plan.
- If an athlete misses a practice and the absence is unexcused, the sprinter cannot use the card for a week. They don’t lose the card, they just lose the right to use it for a week.

Social Media
A couple years ago, my assistant coach told me about a team that used social media to promote their program to a large audience of alumni and parents. At that moment, I decided we could enhance our presence on social media by increasing the number of weekly updates by our coaches.
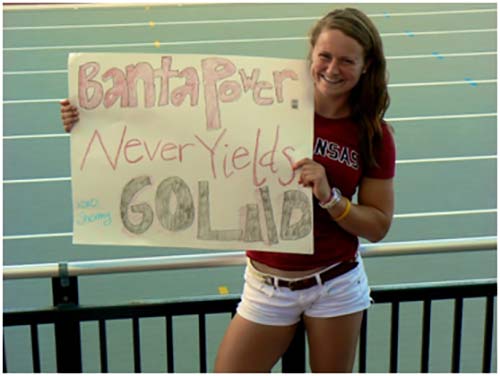
Before, during, and after a track meet, it’s now common to hear about our team’s accomplishments during the week. Getting the word out and spreading the love is always good for the kids, parents, and track alumni to see. #bantavsweather is a funny ongoing social media battle I have with good ole Mother Nature on a private Facebook page.
I love the way new and old athletes and our coaches share their love of the sport. It can be highly entertaining to see a former Parkway Central athlete and state record holder yelling, “Pay the MAN!” and former athletes making plans for road trips to see their old team achieve state dreams.
Connecting the past, present, and future with social media builds community for a sports program. Share on XConnecting the past, the present, and the future is a valuable way to build energy and community for the program. When and where possible, create an easily accessible social media homepage dedicated to your program for people to visit, share, and add to the positive energy. Social media can also help you to communicate last minute changes and adjustments to your athletes and a much needed quote of the day to help steer the conversation at practice during the team huddle.

Secret Track Buddy
Secret Track Buddy is a game like Secret Santa. During the season, I take the team roster and put everyone’s name in a hat. Once we start the game, the secret buddies have a week and a half to do three sweet things for their buddy. These do not need to cost money and can range from a personal poem to a gift card to St. Louis Bread Co.
We usually schedule the Secret Track Buddy reveal the day of a track meet. The kids have a chance to hand off their last gift at our team breakfast or before our warm up for an evening track meet.
Six Recruiting Ideas
Create communication between the high school and middle school programs and PE departments. You can do this several ways. For example, post a bulletin board in the middle school highlighting your team’s accomplishments.
Our middle school PE program does one track and field unit. During this unit, teachers record each performance and reward the top performers in each class. I receive this list every year and target the kids who I believe can help us.
The middle school also has a yearly intramural track and field meet with the middle schools in our school district. Each year I go to this meet so I can see the kids in action.
Have a middle school teacher on your coaching staff. This isn’t always easy because middle school usually has a different daily class schedule that conflicts with practice time. But if you can sacrifice having them at the beginning or end of practice, they can help build relationships, spread the word, and open the door to the possibility of running track in high school.
Every year, I send each of 300-plus incoming freshmen a letter highlighting our program’s accomplishments. I also mention the benefits our sport provides young people–goal setting, fitness, improving their main sport, and participation. As we all know, there is no bench in high school track and field.
For the best prospects in the high school, I write each a personal letter discussing how they could help improve our program. I mail this to the athletes’ parents. I also bold face the personal part of the letter. This is a little trick that creates an opportunity for the parents and kids to have a positive conversation about our sport and to receive a nice letter complimenting them.
Hold a team informational meeting and post fliers before the season starts. I like to send the letters six weeks before the season starts and hold the informational meeting a couple of weeks later. We talk about team expectations, rules, and complete a lot of the paperwork.
After the meeting, we post fliers highlighting action pictures of our athletes. The fliers include important information about the season, including the start date.
Spread out the events mentioned above to stay in the kids’ thoughts and, at the same time, avoid becoming a wall of noise.
Offer an offseason conditioning program. Each state has different rules on how many days you can meet and what things you can do during conditioning. In Missouri, we’re lucky because the rules allow us to get our kids into shape.
This program should be open to everyone and any sport. If done correctly, it will prepare your kids for success. It may also help you attract athletes who enjoy the time you spend with them so much they’ll join your team in the spring.
The time spent in the offseason can dwarf the time spent coaching during the regular season. The time commitment is intimidating but, in the end, it’s well worth the effort.
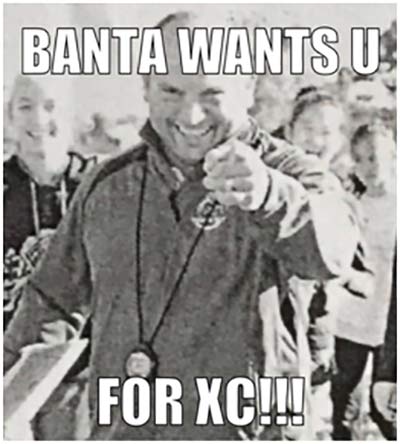
If all else fails, personally introduce yourself to a talented kid, shake their hand (very important), look them in the eye, and tell them how much you would enjoy the chance to coach them.
Promoting the Program: Coaches are Cheerleaders
Coaches have to be the biggest cheerleaders for their kids. Before our season starts, I plaster the walls in our building with large laminated color posters of current athletes in previous track meets. These posters can be very expensive, so each year I make about eight to add to the collection.
Coaches have to be the biggest cheerleaders for their athletes. Share on XBefore our school switched how we made announcements, I would have a detailed track and field statement after all track meets. We would announce the team score, varsity event winners, and any records set in the process. Spring sports tend to be forgotten amid the end of year responsibilities, and I like to keep them on people’s minds.
For every kid who’s awarded an All-State Track, XC medal, or becomes a Division I athlete, I hang a framed black and white picture on my wall among the social studies maps, presidents, and other famous people I have displayed in my room.
I also like to display the trophies we win in my room for potential athletes to see. Since my room is now getting crowded, I’ve decided that my assistant coaches will display, on a rotating basis, any upcoming trophies we win other than the conference, district, or state trophies. Sharing these trophies is another way to positively reinforce our program to athletes in places other than my classroom.
Speaking of assistant coaches, it’s important to build a group of diverse but popular personalities inside the school. There are always kids who won’t have a relationship with you. Other staff members can help bring these kids into the program or help retain them from a previous season. My current staff is the best group I’ve coached with, and we grow closer each season. My assistants have done an outstanding job promoting our program and pushing our athletes to their potential.
Kids Spell Love as T.I.M.E.: Winter Conditioning and Summer Track
Attitude reflects leadership. If you want your kids to commit 100%, you can’t give them 50%. This means you’re there on cold winter days and during hot summer months. You ride the bus. You’re the first person to the track and the last one to leave. Even when you’re ill, you show up as long as you’re not contagious.
Athletes need to train all year to become great. This doesn’t mean you blast their legs out all year long. Each season should have a different point of emphasis to build toward the important championship phases of indoors, outdoors, and cross country seasons.
For more on team culture, see my podcast with Joel Smith sponsored by SimpliFaster
Since you’re here…
…we have a small favor to ask. More people are reading SimpliFaster than ever, and each week we bring you compelling content from coaches, sport scientists, and physiotherapists who are devoted to building better athletes. Please take a moment to share the articles on social media, engage the authors with questions and comments below, and link to articles when appropriate if you have a blog or participate on forums of related topics. — SF