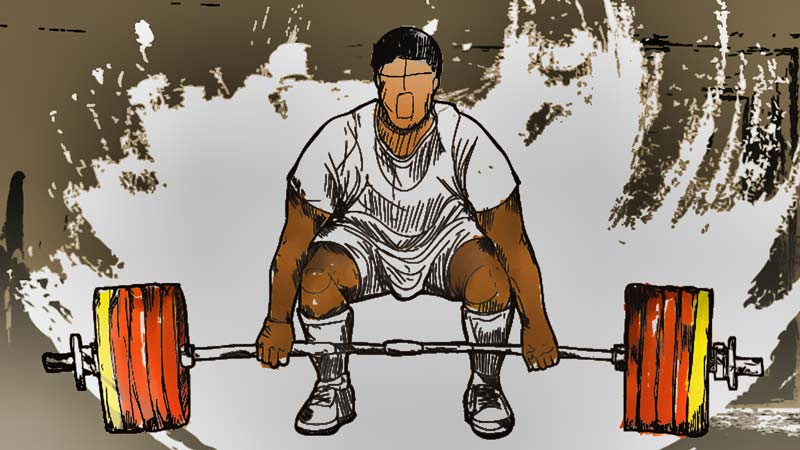
There’s currently a lot of talk about waving loads to advance adaptations and to increase muscle capacity without overtraining.
Progressive overload does work. But if we continually increase the load without undulation, an athlete will quickly overtrain because energy is not restored. Nor is there sufficient time for adaptation to take place before the next overload.
We know that adaptation requires change and stabilization is necessary before additional loading. An excellent way to make this happen is to undulate the loads in a wave (or block). Some common variations of this are found in Kraemer’s Flexible Nonlinear periodization,4 Simmons 3-week waves,7 and Rhea’s Undulating periodization.6
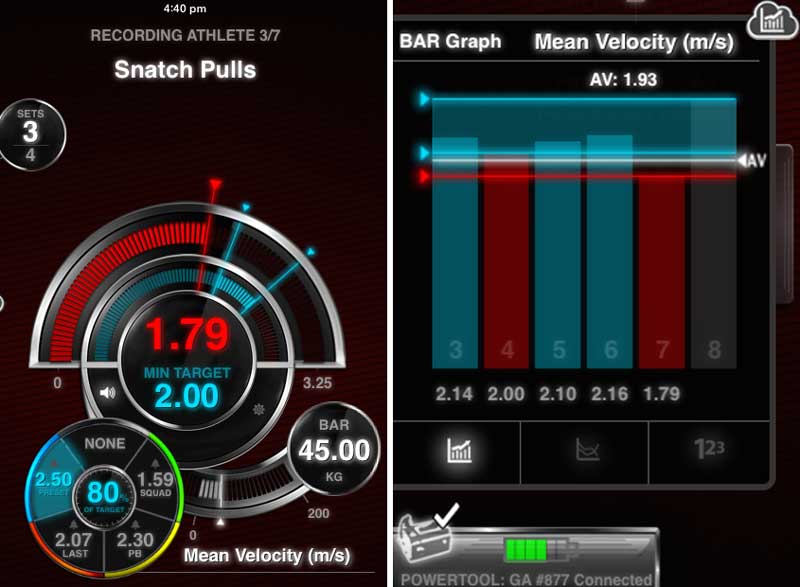
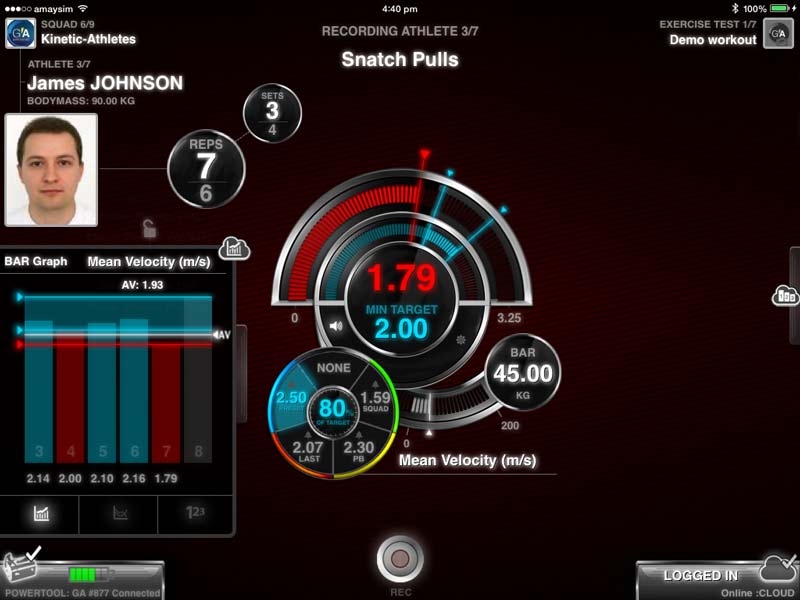
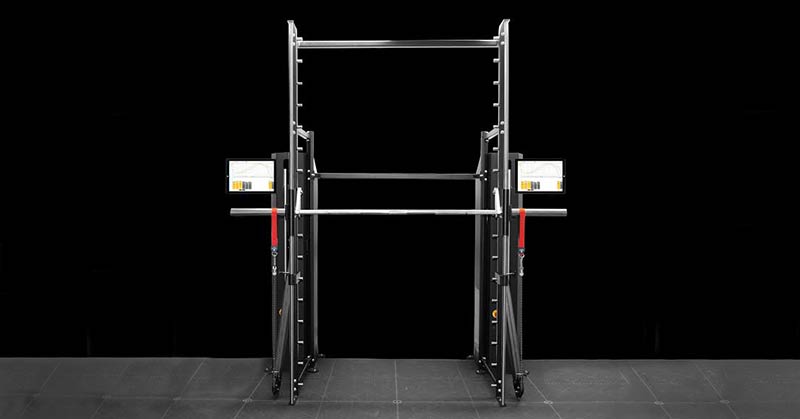
We can use velocity to dictate loads within a wave and to foster an athlete’s self-competition. Velocity offers precision loading and greater increases in performance when the athlete uses the feedback from their training.
Definitions
In this article, I refer to ascending and descending waves. An ascending wave increases velocity over the course of the wave (and load may decrease), and a descending wave decreases velocity over the course of the wave (and load may increase).
By increasing velocity, we emphasize the movement’s increasing rate of force development. By decreasing the velocity, we emphasize increasing the strength of the movement.
Most commonly, velocity-based training (VBT) is used to increase the rate of force development for team sport athletes. The two traits most commonly developed are strength-speed and speed-strength. Strength-speed is developed for the majority of the traditional movements between.75 and 1.0m/s. Speed-strength is developed between 1.0 and 1.3m/s.
Typically waves are done with smaller intensity jumps, so most of my examples wave within their own trait. It is possible, however, to wave between traits.
Strength-Speed: Improving Power
Let’s say we have an in-season model of an offensive tackle in American football trying to improve strength-speed for greater improvements on the field. The athlete is a little bit slow and less explosive; two things we want to improve.
| Ascending Strength-Speed | ||
| Sets x Reps | Velocity | |
| Week 1 | 6×2 | .75m/s |
| Week 2 | 6×2 | .85m/s |
| Week 3 | 6×2 | .95m/s |
An advantage to changing the velocity is that it psychologically allows the athlete to overreach a little. That is, when the athlete knows what load they hit last week, they will naturally strive to use the same load or more.
This allows for a greater acceleration phase of the movement and greater transfer to the sporting movement.
Athletes are pre-programmed to move up in weight each week, rather than down in weight and up in velocity. Accordingly, athletes often try to move even faster because they expect to be stronger than they were the previous week.
This is a Jedi mind trick that sometimes motivates an athlete to make sure they’re putting full effort into each repetition. Once the athlete understands how to do this, they’ll see better gains overall.
This phenomenon allows the practitioner to get an extra bit of overshoot from the athlete who may alter their force-velocity curve up and to the left. It definitely can’t hurt.
As we already know, progressive overload is required to cause adaptation. This is a nice scheme to increase overload to influence power.
Strength-Speed: Improving Strength
Now let’s say we have an in-season model of a defensive tackle in American football who is trying to improve the strength side of the strength-speed curve. The athlete is already explosive, and we’re trying to increase his absolute strength in-season.
According to some experts, increases in absolute strength using heavy resistance training are not possible, but increases in strength from submaximal loads and volumes may occur with less, or no, detrimental impact on the field.
| Descending Strength-Speed | ||
| Sets x Reps | Velocity | |
| Week 1 | 6×2 | 1.0 m/s |
| Week 2 | 6×2 | .9m/s |
| Week 3 | 6×2 | .8m/s |
The descending velocity actually is an increase in load. This may allow athletes to feel more confident as they progress in loads each week because they appear to be “much stronger” than they were the previous week.
When athletes feel more confident, their results will improve. Share on XThe greatest transferable trait from the weight room to the playing field is confidence,3 said Joe Kenn, Carolina Panthers head strength coach and author of the Strength Coaches Playbook. If we can help athletes feel more confident, we will have a better result.
Waving Between Traits
Some people may like to wave between traits to maintain both strength and speed during the block. This follows the same premise, but we have to know the goal of the training cycle to decide where to spend most of the training time.
Full disclosure, I have not intermixed speed-strength and strength-speed. I know some people who have, and this is how they’ve done it.
For me, this is purely theoretical. I’m not a fan because I’ve found that, to achieve speed-strength on exercises like squats and deadlifts, I have to use accommodating resistance such as chains and bands. When I use these, I don’t like to switch back and forth between the accommodating resistance and straight weight.
To do so is fine. I always like to err on the side of caution and have never tried it. I prefer to try and keep the movement the same throughout the wave.
| Intermixed Ascending Strength-Speed Dominant | ||
| Sets x Reps | Velocity | |
| Week 1 | 6×2 | .8m/s |
| Week 2 | 6×2 | .95m/s |
| Week 3 | 6×2 | 1.1m/s |
| Intermixed Descending Strength-Speed Dominant | ||
| Sets x Reps | Velocity | |
| Week 1 | 6×2 | 1.1m/s |
| Week 2 | 6×2 | .95m/s |
| Week 3 | 6×2 | .8m/s |
Wave Time Periods
In-seasons and off-seasons are usually much longer than three weeks, so what can be done for this? We could repeat the wave time and time again.
We could stay with the same velocities and change up the movement. With squats, this could mean simply changing up the width of the stance, changing the bars, adding or changing accommodating resistance, or a combination of all of these.
We can also vary the velocities.
| Ascending Strength-Speed | ||
| Sets x Reps | Velocity | |
| Week 1 | 6×2 | .75m/s |
| Week 2 | 6×2 | .85m/s |
| Week 3 | 6×2 | .95m/s |
| Week 4 | 6×2 | .77m/s |
| Week 5 | 6×2 | .87m/s |
| Week 6 | 6×2 | .97m/s |
We could repeat or change it up from there. If we want a longer wave, we could simply make smaller jumps from week to week, like a .05m/s jump instead of a .1m/s jump.
Using Velocity to Dictate Loads
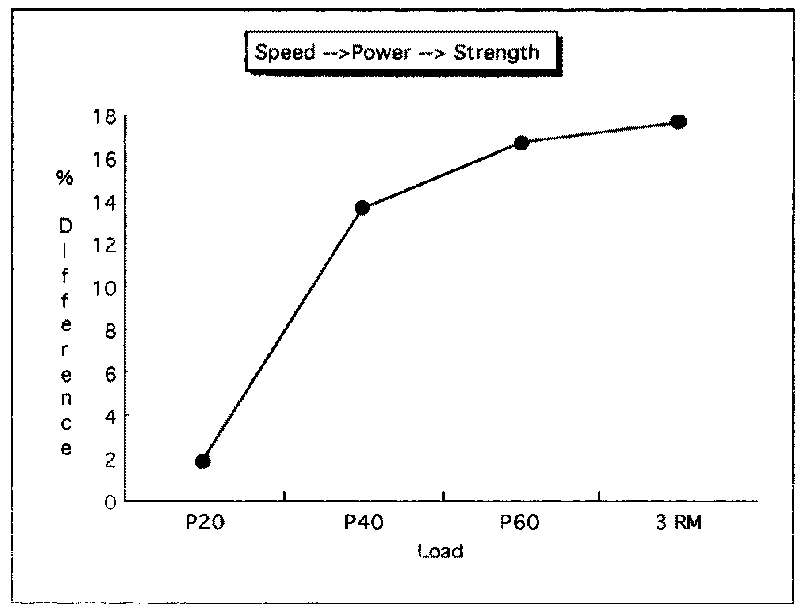
Another advantage to dictating loads by velocity, especially in-season, is the relationship between 1RM and velocity.
As Jidovtseff2 and Gonzalez-Badillo1 found independently, there is a near perfect relationship between velocity and percentage of 1RM. Gonzalez-Badillo found that between testing periods, there was no greater change in the relationship than .01m/s.
Since in-season sport specific loads are very high, it’s quite possible an athlete will be at a reduced capacity in the weight room. By using velocity to dictate loads instead of a percentage of 1RM, we ensure the athlete works at an appropriate load and progresses through loads properly. This is better than using a previously tested number which may or may not be relevant for the athlete on any given day.
Using velocity to dictate loads ensures athletes work at appropriate loads and progress properly. Share on XAlso, using feedback from velocity waves leads to a greater transfer of training, as shown by Randell.5
In Randell’s recent study, two groups did the same workout with the same reps, sets, load, and rest periods. The only difference was that one group received velocity feedback on their squat jumps and the other did not.
The group using the feedback saw much greater improvements in vertical jump height, sprinting times, and ability to change direction.
Simply providing the athlete with feedback about how they did on every repetition increased the quality of every repetition and each subsequent repetition. And this led to a greater transfer to training.
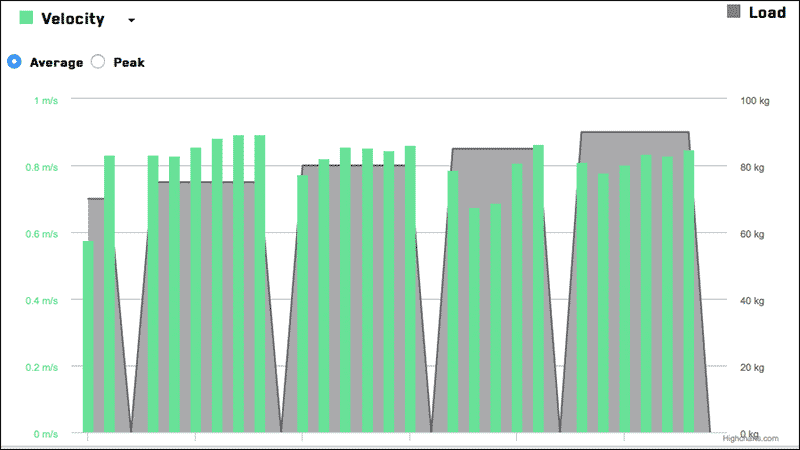
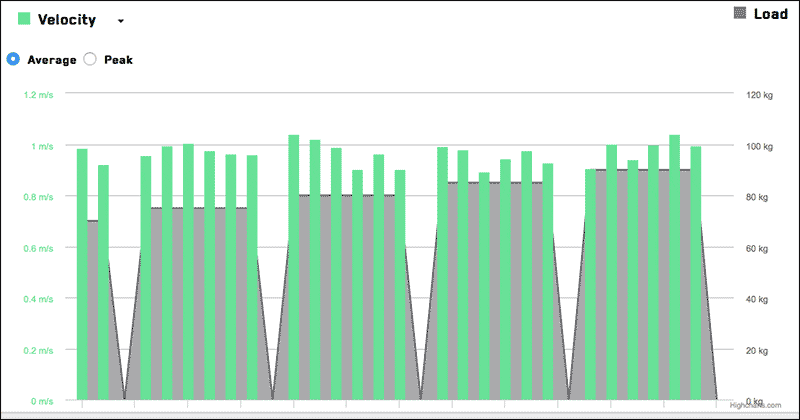
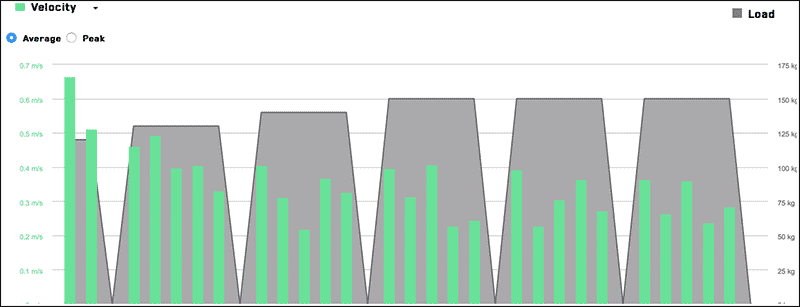
Three-Week Wave for College and Professional Athletes
Regarding college and professional athletes, if they use the same load and type of barbell for three weeks, watch what happens to the velocity. Referring to the Randell study, which focused on professional rugby players, using feedback has a large impact on speed and strength improvements.
By using the same load each week, an athlete has a chance to use feedback more effectively. Changing the load each week may make more sense from a classical periodization model. But it may take away from the athlete’s effort.
If the athlete knows about their fastest reps the previous week, they can take this information to increase their effort, speed, and possibly adaptation.
Giving feedback to athletes generates speed and strength improvements. Share on XIf velocity increases each week, we can tell the athlete is getting stronger. A very plastic relationship exists between load and velocity. If the velocity of the load increases, this indicates a lower percentage of 1RM for that day.1
Velocity training requires more time on the floor and more effort to coach athletes how to use it. It also leads to greater performance.
Additional Wave Cycles
| Ascending Speed-Strength | ||
| Sets x Reps | Velocity | |
| Week 1 | 6×2 | 1.0m/s |
| Week 2 | 6×2 | 1.15m/s |
| Week 3 | 6×2 | 1.3m/s |
| Descending Speed-Strength | ||
| Sets x Reps | Velocity | |
| Week 1 | 6×2 | 1.25m/s |
| Week 2 | 6×2 | 1.15m/s |
| Week 3 | 6×2 | 1.05m/s |
| Intermixed Ascending Speed-Strength Dominant | ||
| Sets x Reps | Velocity | |
| Week 1 | 6×2 | .95m/s |
| Week 2 | 6×2 | 1.1m/s |
| Week 3 | 6×2 | 1.2m/s |
| Intermixed Descending Speed-Strength Dominant | ||
| Sets x Reps | Velocity | |
| Week 1 | 6×2 | 1.2m/s |
| Week 2 | 6×2 | 1.05m/s |
| Week 3 | 6×2 | .9m/s |
Since you’re here…
…we have a small favor to ask. More people are reading SimpliFaster than ever, and each week we bring you compelling content from coaches, sport scientists, and physiotherapists who are devoted to building better athletes. Please take a moment to share the articles on social media, engage the authors with questions and comments below, and link to articles when appropriate if you have a blog or participate on forums of related topics. — SF
References
- Gonzalez-Badillo, J.J., and L. Sanchez-Medina. “Movement Velocity as a Measure of Loading Intensity in Resistance Training.” International Journal of Sports Medicine 31(5): 347-352, 2010. doi:10.1055/s-0030-1248333.
- Jidovtseff B., J. Quièvre, C. Hanon, and J.M. Crielaard. “Inertial muscular profiles allow a more accurate training loads definition. (Les profils musculaires inertiels permettent une définition plus précise des charges d’entraînement).” Science & Sport 24(2): 91-96, 2009. doi:10.1016/j.scispo.2008.09.002.
- Kenn, J. The Coach’s Strength Training Playbook. (Monterey, CA: Coaches Choice) 2003.
- Kraemer, W.J., and S. Fleck. Optimizing Strength Training: Designing Nonlinear Periodization Workouts. (Champaign, IL: Human Kinetics) 2008.
- Randell, A.D., J.B. Cronin, J.W. Keogh, N.D. Gill, and M.C. Pedersen. “Effect of Instantaneous Performance Feedback During 6 Weeks of Velocity-Based Resistance Training on Sport-Specific Performance Tests.” Journal of Strength and Conditioning Research 25(1): 87-93, 2011. doi:10.1519/JSC.0b013e3181fee634.
- Rhea M.R., S.D. Ball, W.T. Phillips, and L.N. Burkett. “A Comparison of Linear and Daily Undulating Periodized Programs with Equated Volume and Intensity for Strength.” Journal of Strength and Conditioning Research 16(2): 250-255, 2002.
- Simmons L. Westside Barbell Book of Methods. (Grove City, OH: Action Printing) 2007.