[mashshare]

SimpliFaster: Olympic-style lifts are very specific to body types and technique, making them more than just a simple summary of peak or average output. Besides using feedback for motivation and accountability, what can be done to use the data beyond estimating work?
Dan Baker: First, a little preamble to set up this answer. Exercises can be deemed by their biomechanical attributes as either “strength” or “power” oriented. In power exercises, the velocities are high and acceleration continues to the end of the range—the forces do not have to be decelerated. Basically the energy is released into the air through jumps, hops, and throws. Olympic lifts also fall into this category (they are jumping exercises, essentially). If the force is safely dampened at the end of the movement, like hitting a heavy bag, then throwing punches and kicking are also power exercises.
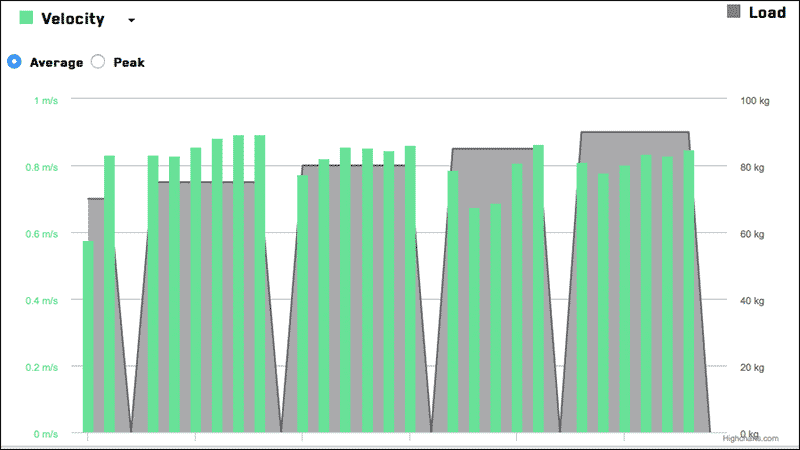
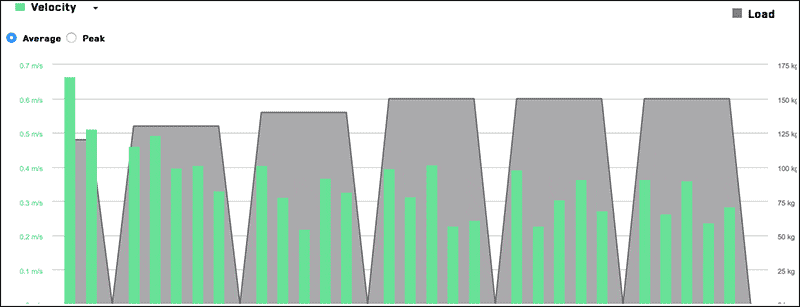
Figures 1a, 1b, and 2 show sets of snatch push presses (power exercise, Olympic lift) and heavy squats (a strength exercise). Despite the same sort of % 1RM (sets working from about 70 to 80% 1RM), the mean velocities are much different. For the snatch push press, the velocities are around .8 to over 1 m/s. For the heavy squats, .3 to .5 m/s. For the snatch push presses, the velocities remain fairly stable, despite the increase in resistance for each set. For the squat there is a decrease in velocity with increased resistance.

| March 25 | Rep #1 | Rep #2 | Rep #3 | Rep #4 | Rep #5 | Rep #6 | Set Average |
| Set #1 75 kg | 0.83 | 0.83 | 0.86 | 0.88 | 0.89 | 0.89 | 0.86 |
| Set #2 80 kg | 0.77 | 0.82 | 0.86 | 0.85 | 0.85 | 0.86 | 0.84 |
| Set #3 – 85 kg | 0.79 | 0.67 | 0.69 | 0.81 | 0.86 | 0.76 | |
| Set #4 – 90 kg | 0.81 | 0.78 | 0.80 | 0.83 | 0.83 | 0.85 | 0.82 |

| Apr 21 | Rep #1 | Rep #2 | Rep #3 | Rep #4 | Rep #5 | Rep #6 | Set Average | % Change |
| Set #1 – 75 kg | 0.96 | 1.00 | 1.00 | 0.98 | 0.96 | 0.96 | 0.98 | 13.1 |
| Set #2 – 80 kg | 1.04 | 1.02 | 0.94 | 0.90 | 0.96 | 0.90 | 0.96 | 15.0 |
| Set #3 – 85 kg | 0.99 | 0.98 | 0.89 | 0.94 | 0.97 | 0.93 | 0.95 | 24.3 |
| Set #4 – 90 kg | 0.91 | 1.00 | 0.94 | 1.00 | 1.04 | 1.00 | 0.98 | 20.2 |

Strength exercises have a deceleration phase at the end of range when resistances are low (< 50% 1RM)= to avoid stressing the tendons and joints. On major strength exercises like squats, bench presses, and deadlifts, with resistances below 50% 1RM, more than half the ROM is spent in deceleration, making them less than ideal for power training even though at this low level of resistance the velocity may be high. The length of the deceleration phase decreases as resistances go above 65% 1RM. By 85-90%, there is no real deceleration phase, but the velocities are so low at this level of resistance that they cannot be classified as power exercises. So using light resistances below 50% 1RM in traditional strength exercises to develop power is often counterproductive as it is training the body to decelerate for much of the ROM, rather than continuing to accelerate.
So we do strength exercises with heavy resistances to develop force/strength, and power exercises with the appropriate resistance to train the body to use force with high velocity until the end of range. If you want to use “strength exercises” to develop power, you need to use resistances of 50-70% 1RM. Something to dampen the ferocity of a rapid lockout (such as bands and chains) also helps.
In addition, there are two measures of velocity and power—the mean or average of the entire range of (concentric) movement, and the peak, which represents the highest velocity in the shortest measuring time (say 5 millisecs). So there will be a difference between the two measures. When someone is doing a lot of end-range deceleration (because they may be trying to lift 30-40% 1RM in a bench press explosively), there will be a marked difference between the two figures as the body has to severely decelerate the lock-out to protect the joints. In Olympic lifts, which are virtually full ROM power exercises, there should not be a huge difference. If there is a more marked difference for one athlete compared to others, it suggests that they are decelerating near the end of ROM.
Why would they? Because they have mobility or technique problems and the body inherently knows not to continue accelerating (or at least, lifting with high velocity) until catch or lock-out. It may be dangerous to the involved joints, tendons, etc. So there may be a high peak velocity, but the body will slow down the speed to avoid dealing with high force and high velocity at a vulnerable end of ROM in athletes with mobility/injury concerns.
This may suggest that you don’t perform the full versions of the Olympic lifts (or power versions) with athletes who have mobility problems. You may be better off performing a variation (for example, clean power shrug jump instead of power/hang clean).
Also, Prue Cormie’s research shows that the benefit with, for example, power cleans is that as resistance goes up, power also goes up because the velocity is fairly stable—you need a certain velocity to make a successful lift. In other exercises, as resistance goes up, at some point the % dropoff in velocity is greater than the % increase in resistance. Therefore, power goes down.
More than 20 years ago, Greg Wilson called this point—where mean power is highest—the “optimal power load.” It is different for every exercise and there is also individual variation. Some of my published research looks at bench press throws in a Smith machine by professional rugby league players. That “optimal power” (mean power of the entire concentric range) was 55% 1RM for weaker blokes (about 125 kg 1RM), 50% 1RM for the across- the-board normal blokes (about 140 kg 1RM), and 45% 1RM for the strongest blokes (about 150 kg+ 1RM).
To summarize:
- Olympic lifts are great because we know that if resistance goes up, so does power, until about 90+% 1RM. You don’t need a measurement device unless you are doing pulls or push presses.
- With the Olympic lifts, the “optimal power” goes up in resistance as you get stronger but stays fairly stable in % 1RM.
- For strength exercises, the optimal power may go down in % 1RM, even if the actual resistance has gone up a little, if the athlete has gained a lot of strength.
- For strength exercises, that optimal power point may need to be determined if it is relevant for the individual and the sport. To determine this “optimal power” point or resistance, you need measurement modalities—either a linear position transducer or the new accelerometer type like the PUSH armband.
- A marked disparity between peak and mean power in an Olympic lift suggests a mobility/technique problem.
- A marked disparity between peak and mean power in a strength exercise with light resistances (< 50% 1RM) is due to the body self-protecting the joints and tendons from a forceful lockout. Why bother to do this?
- For a strength exercise to develop power, use 50-70% 1RM for explosive power, perhaps with bands and chains added, or keep these exercises solely for strength development with appropriately heavier resistances.
- Use jump squats, bench press throws, and similar exercises to train power with resistances 50%1RM of the strength exercise.
SimpliFaster: Jump testing sensitivity is not perfect from the sensitivity being limited, but more reactive options that utilize the stretch shortening cycle add more validity. Is jump training worth doing regularly, a waste of time, or perhaps valuable enough to explore?
Dan Baker: It depends on the athlete and sport. For jump athletes, yes—jump testing and training are important! But the type of jump testing and training needs to be determined. For example, when I worked with Olympic divers, we did squat jumps (no countermovement or arm swing), countermovement jumps (no arm swing), and a vertical jump with arm swing that mimicked a dive take-off (BVJ). The SJ and CMJ are just diagnostic tools to improve the most important, sport-relevant jump test, the BVJ. The SJ is thought to represent the contractile capabilities of the muscles. The difference between the SJ and the CMJ is the extent to which the stretch-shortening cycle contributes.
So, if there is very little difference between the two (say <10%), then the athlete needs more SSC-type training such as jumps, plyos, etc. If the difference is large (>20%), then they may need more basic strength work (squats, etc). This ratio will also reflect the recent training content. So if we concentrate on heavy squats and heavy jump squats for a month or two, the SJ may go from, say, 40 cm to 42 and the CMJ from 46 cm to 47 cm—the SSC augmentation decreases from 15% to 12%. But in following up that block with lighter, faster jumps, depth jumps and other plyos, the SJ may remain unchanged. But the CMJ may improve up to 50 cm and now the augmentation is 19%.
We also did loaded jump squats, up to 80 kg. This is pure leg-jumping power and another tool to improve BVJ. If you look at my paper on the training of an Olympic diver from 1993 to 1996, published in the NSCA Journal in 2001, you will see that a 50% increase in squat strength (coming off a low strength level) begets a 25% increase in power in loaded jump squats, which in turn begets a 15% increase in BVJ height.
So jumps can be used diagnostically to develop training strategies or as tools to achieve outcomes, especially for “jump sport” athletes (volleyball, basketball, diving, gymnastics, etc).
For other sports, jumping is associated with things important in the sport and again can be used diagnostically or as a training tool to achieve an outcome. For example, my research on professional rugby league players, with whom I worked for 19 years, shows that the power achieved jumping with 80-100 kg really differentiates those at the pro team level (NRL) from second- and third-division players. Basically the average weight of players is 98 kg, so if you can’t move that weight quickly in a triple-extension movement in the gym (jump squat or hang clean), you aren’t going to move it quickly on the field! To move those sorts of weights with velocity, they needed to be about 60% 1RM squat. Therefore, you needed a 1RM squat of >170 kg (much more for the bigger boys, whose opponents weigh about 110+kg!). So testing and training influence each other.
Jump squats with 20 kg did not differ much between teams in professional rugby leagues. But at the end of every power training session warm-up, before the real barbell work started, we would do five jump squats with 20 kg to monitor the state of the neuromuscular system/recovery. An easy test, not fatiguing, and it allowed us to monitor how the squad was coping. A 3-4% deviation (from the best preseason score) meant nothing. That is just the normal weekly variation, but changes of 7-10+% meant something! If the whole squad is down on average 7%, look out!
See Figure 3 below for changes across an 8-month rugby league season. There is a slump during the middle portion, which corresponds to two key factors: mid-winter and an increase in playing volume and intensity for key players. So we are dealing with the twin stressors of a suppressed immune system and harder games to recover from, and our N-M scores decrease for the whole squad accordingly.
So we can look at jump training/testing for diagnostics or for training to achieve outcomes associated with success in the sport.
SimpliFaster: Submaximal loads are great for estimating repetition maximal abilities, and research is showing evidence that general exercises and lift velocity can predict what one can do if the load is heavier. One worry coaches have is that submaximal loads with maximal effort for velocity is fatiguing. What is the best way to implement one-repetition estimation with submaximal loads?
Dan Baker: For me, it is still a reps-to-fatigue (RTF) test, with either 5RM or 3RM to predict 1RM. My correlations to predict 1RM are very high with these (R= 0.93-.97). There is not enough data with velocity-based estimation yet for it to be considered better than RTF testing, but it looks promising. We just need more studies, across different populations of athletes and sports, on different exercises. Certainly, for the lower body this would be great—to hit a full squat of somewhere 60-80% 1RM for 1-3 reps and extrapolate to 1RM with a degree of certainty, especially in-season! But right now, most of the evidence on this is done with a Smith machine on Spanish phys ed students, soccer players, or water polo players! We need more data, male and female, on more athletes from more sports and free weights! We need more research that includes super-stars and explosive athletes.
“One worry coaches have is that submaximal loads with maximal effort for velocity is fatiguing” – WTF! Someone fatigued by doing 1 to 3 reps at 70% 1RM with maximal velocity is no athlete!
SimpliFaster: Most holistic programs in the weight room and on the field use different strength training modalities, not just one type of lift. Besides alternating intensities and volumes, does bar velocity-type tracking help with better adaptations biologically to the body? Many coaches are looking into hormonal and gene activation as part of the training process. Is this a wrong path or a good idea?
Dan Baker: My research from the past 20+ years shows that I have always measured power output during jump squats and bench press throws (in a Smith machine). These are my basic power exercises and tests. I prefer to track performance measures (strength, velocity, power, MAS, etc.), not physiological measures (hormone levels, gene activation, etc.). No gold medals for best mTOR signal or fiber type or testosterone-to-cortisol ratio in the Olympics. Don’t get lost by chasing sports science measures when there are easy performance measures to track (says the sports scientist!)
SimpliFaster: Following up on genes and hormones, muscle-fiber profiles of athletes are gaining interest. Could coaches do a better job or individualizing training based on one genetic trait—specifically the amount of fast and slow fiber distribution?
Dan Baker: We are not allowed under the WADA code to manipulate hormones (their changing levels are a consequence of what we do, but we cannot expressly attempt to manipulate them) or genes. Do people understand the WADA code? Manipulating hormones or genes is a doping offense under WADA and you face a 4-year or lifetime ban. We are not allowed to change our genes, so why bother with this stuff? Apart from the peak Olympic sports of sprints, jumps, throws and lifting, most sports require a mix of attributes.
If we take rugby-type sports which need various physical attributes, a lot of blokes are fast-twitch fiber types. But they get beaten down by their opponents through the cumulative fatigue of the high workload imposed on them. Same with many MMA fighters, who get gassed late in the bout and lose. So catering to their strength (explosiveness) is not going to help their weakness (less aerobic capacity). Mixed sport athletes need to work on many things. But can we do a better job on the explosive outliers? Of course! We just need the extra manpower resources!
However, if we take jumpers, divers, sprinters, Olympic lifters, throwers, and others like them, all their training is catered to the fact that they are explosive power athletes. They are on small teams, so manpower aspects of coaching are not as critical as field sports with larger teams. What more could you do that you are not already doing with them? You know they are fast-twitch fiber type people! And you program more individually.
Look at Figure 3. This is the mean bench press velocity lifting for 95 kg (63% 1RM) for three professional rugby league players from the back-line positions—the fast runners, the Ferraris and Lamborghinis. They are lifting at high .8 to over .9m/s for six reps for 2 sets. Yet the González-Badillo et al IJSM 2010 paper suggests that at 63% 1RM, the mean velocity should be < .8 m/s. So why do we have > .9 m/s, when the research suggests maybe .77 m/s for this level of intensity? Because these are our outliers, our superstars. They can’t handle the same volume of work and they are not good at grinding reps because they burn brighter, not longer.

One of those players from Figure 3, doing 3×8 on the bench with a RPE of 8, can only use 64% 1RM. Whereas another player (not depicted),a real slow-twitch type, a grinder, does 3×8 with 78% 1RM. They both bench press 155kg for their 1RM (but have different body weights). We take that into account when designing training.
SimpliFaster: The final need of coaches is to make training work better in reducing injuries, improving speed and size of players, and transferring to sporting actions like deceleration and jumping. How does Velocity Based Training do this with athletes?
Dan Baker: I don’t propose all training be VBT. Why would I? Velocity is another metric to monitor, not the be-all and end-all. Training needs to be holistic, not just based upon velocity. Certainly, the focus on velocity, rather than just 1RM levels, appears to have found its way into the US training mainstream. It will help improve performance, reduce injury, and so forth, as we gain more data and make more informed training decisions. The low cost of velocity measuring devices will see their proliferation. The Plyometric Power System, developed in the early 1990s by Greg Wilson and Rob Newton to measure velocity and power, cost my team $18,000 in 1996! Now the PUSH armband is only a few hundred dollars.
There are certain key exercises and power output or velocity metrics that are useful for sports. You just need to determine what they are! As I mentioned, we have seen that power output or velocity during jump squats with 100 kg and bench press throws of >60 kg separates the pros from 2nd and 3rd division rugby league players, but velocity and power generated with 20 kg in the same exercises does not.
So I need to make sure the velocity I am measuring is one actually associated with performance. If two rugby league players generated .8 m/s with the same % 1RM, are they the same? Not if one is 40 kg stronger than the other, because his power output would be much higher. Look at Figure 4. The greater the amount of resistance, the greater the difference between U/20 years and professional rugby league players. If we just measure velocity with 20 kg during a bench press throw, there is only 2% difference, but it is 16 % with 60 kg, and with 3RM bench press more than 18%.

For divers, the velocity or power generated during jump squats with 20 kg, however, is associated with performance levels. So different sports have different relevant performance measures—jump squats with 20 kg is performance-relevant for divers but not for pro rugby league players who need 80-100 kg! S&C coaches will need to determine what measures relate to success in their sports.
So do some testing. What separates the best performers from lower level performers? Use a battery of loads, initially, until you find what loads and velocities are important (power is the product of load and velocity). And I use absolute loads for testing, not % 1RM. So jumps with 20, 40, 60, 80, 100 kg or whatever is most appropriate for the athletes.
For in-season recovery monitoring, we see (Figure 5) that jump squats with 20 kg can give a guide of recovery and adaptation, especially during the in-season for football and rugby players (Australian Football League, National Rugby League, Rugby Union). So we can use this as a measure of recovery monitoring, not performance.

With respect to injury and rehab, we can look at the velocity of, for example, squats and RDLs with sub-maximal loads in injured players to gain insight of where they are at in their recovery (compared to their normative data in the same exercises).
There are two major things that inhibit us—forces and speeds, especially at end-ROM. After an injury, we have to gradually and progressively break down the neural inhibitions to these things. Maybe someone has good strength (force) in an isometric test at mid-ROM, but can they safely express that high force at high velocities through full ROM? Also is there a large disparity between peak and average velocity?
This is where the proliferation of velocity measuring devices will come in handy. The future is exciting in this area with low-cost, accurate measurement devices gaining widespread acceptance. Many more smart coaches will now be able to make better training decisions because they will have velocity and power data to help inform them about the adaptation processes the athlete is experiencing. I have been using various measurement velocity devices for over 20 years now and I am super-excited about the future.
Since you’re here…
…we have a small favor to ask. More people are reading SimpliFaster than ever, and each week we bring you compelling content from coaches, sport scientists, and physiotherapists who are devoted to building better athletes. Please take a moment to share the articles on social media, engage the authors with questions and comments below, and link to articles when appropriate if you have a blog or participate on forums of related topics. — SF
[mashshare]


