I work with some of the best coaches internationally, and we get into both macro and micro conversations related to practical and meaningful feedback metrics. These in-depth conversations include a lot of “why’s”: why do we and why don’t we. With the increased buzz and adoption surrounding the various technology options for Velocity-Based Training (VBT) used with the barbell, I think we are overdue in exploring a lot of “why’s.”
From my perspective, much of the way VBT tech feedback is utilized today is rather stale, uncreative, and possibly not very transferable. More and more coaches, at all levels, are hungry for VBT tech solutions—seeking to improve outcomes—yet today’s mainstream guidance is dated. The majority of questions related to barbell tracking technology that I get asked by coaches were already answered in the 1980s. This is certainly not a knock on those coaches, as if you do not know you need to ask; rather, the thing that is troubling is that the answers have not changed.
We have seen the most progress for barbell tracking in the recent and rapid evolution of the technology: wireless and ultra-portable sensors that report to apps sitting on smart devices. The result is a significant reduction in cost to the coaches, which opens the door for wider adoption because cost is no longer an issue. This is great. With less-expensive options now available, and systems that utilize the smart device you are already carrying, the technology progression makes a lot of sense.
The fresh sport tech options have no doubt increased buzz around barbell tracking, but we need to be cognizant of conveniently blending the new tech with the old methods. I understand your intent in using VBT tools and methods to develop better athletes. Since you are taking the time, spending the often-limited resources, introducing change, and putting in a lot of overall effort, my plea is a simple one: Read our scientific and coach-friendly argument to train with a purpose instead of training within potentially flawed fundamentals.
As the founder of my company, I knew that we had two paths to choose from: (1) roll into what is popular to get quicker sales; or (2) build for those that are aware of the true needs of athlete development. The second road was clearly going to be tougher—a longer and bumpier road in terms of product development and market acceptance—but it’s worth it now, as coaches are understanding the “why.” We chose to design a system that provides professionals with the right information delivered in a way that makes training better, and not hampered by too many steps or a time burden.
Please understand, this is all a balance, and many pros and cons are evaluated. What I share may ruffle some feathers and may make some coaches and even some sports scientists uncomfortable. But I am committed to ensuring the improved solution is available for those in the iron and athlete craft. Our product development goal and vision is to offer what you know and understand, while leading with innovation.
Are Speed Zones Obsolete and Just a Dead End?
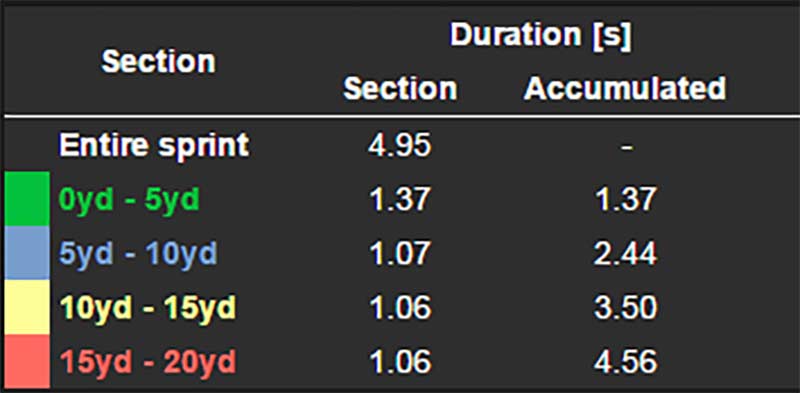
There are often two primary mistakes made with training with velocity: (1) training at specific speeds for the purpose of hitting strength qualities, and (2) training to optimize power within the force velocity curve. I will explain why we moved away from speed zones and why the promotion of excessive force velocity by social media needs to simmer a bit. Reaching a peak or average speed on a snatch or clean is not overly meaningful without the load of the bar being relative to the athlete’s bodyweight. Barbell velocity hits a terminal speed barrier from the mechanics of many exercises, including most Olympic lifts where coaches use VBT tools to measure. Terminal speed is represented by the metric peak speed, the point of the movement where acceleration essentially hits zero, and the bar is no longer accelerating or gaining speed.
The promotion of excessive force velocity on social media needs to simmer down a bit. Share on XDue to the specific timing sequence of weightlifting exercises, bar speed doesn’t provide room to hit sufficient-enough velocities to be meaningful beyond successful attempts or an indication of just using a lighter load. Put simply, a light and heavy clean or snatch will not vary much in velocity because of the technical limitations of the exercise, so slightly faster or slower speeds will not mean anything beyond the athlete selecting a different load on the bar. Mladen Jovanovic fully explains this in his roundtable discussion when he outlines the difference between open- and close-ended exercises, namely the jump squat and Olympic-style exercises. In summary, bar speed for Olympic lifting is important to keep the athlete sharp, but the exercise speed range is much more narrow than coaches are aware.
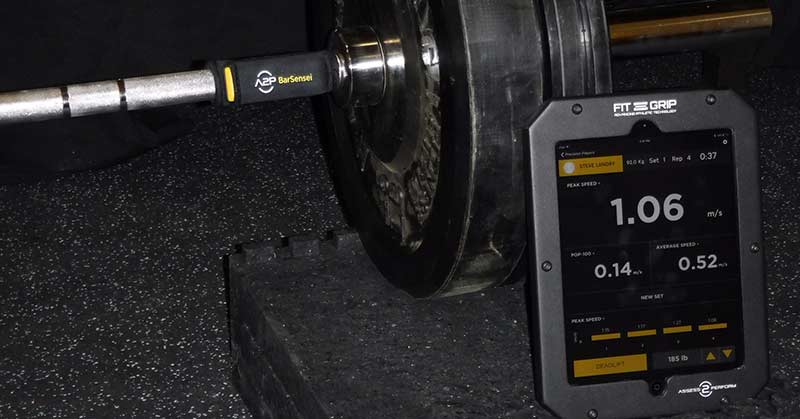
Video 1: This video showcases how the Bar Sensei stacked up to the Tendo and Push Band while I was at a local university. Speed zones are an OK starting point, but most coaches really want more speed or more load in training.
Bar speed does matter, no doubt, with the intent of bar velocity being essential during lifts that help drive power down the road from greater gains in maximal strength. Much of the improvement in power comes from low-velocity lifts that recruit more of the “high threshold motor units,” and those lifts are slow, such as heavy squatting. Other activities that are much faster, like plyometrics, are significantly more rapid than barbell exercises. When the movements are unloaded, coaches often prefer to do those actions on the field and save VBT for heavier weights. Barbell velocity should be about selecting the right load with the right exercise in order to get a desired training effect in activities that team coaches want results in on the field or court.
Earlier in the article I mentioned how most coaches ask me the same question. To elaborate more, that question is related to average zones and, often, on applying these zones to Olympic lifts. Whether the question is centered around Olympic lifts or a squat, I ask “Why are you interested in average versus peak?”
Bryan Mann is currently doing a great job migrating coaches away from the earlier suggested average velocity ranges to peak velocity ranges. We would like to see the coaching conversation evolve from simply recording a bar speed/hitting a zone target, to asking questions like how (or which) barbell metrics transfer to body performance.
Unless you are a competitive bar speed lifter, isn’t transference what we are really trying to get at? By displaying how specific measurements of exercises help transfer and identify improvement from training, coaches are more empowered to make decisions that really show up later in sport, not just on weight room record board walls. Like coaches in the past understanding the balance of blending maximum strength into power and speed training, we are concerned about the carryover to athletic actions.
Barbell Measurements That Matter for Sports Performance
When we develop a product, we work backwards, anticipating the user needs and working them into the technology platform (there are many layers to this). The same holds true for performance enhancement: work backwards, understanding athletic actions and seeing what is necessary to improve those abilities. Approaches often start with strength and power training and forcing a hit-or-miss agenda with concepts that might make an athlete test better in the weight room, but the results may not show up outside of the complex. Coaches that chase a certain barbell measurement will inevitably get frustrated later when that training “improvement” does not manifest anywhere in the game or event that the athlete competes in. Whereas, when using the right metrics package, coaches can hone in on the right movements, the right overload, and the right timing to stress the system.
We certainly provide legacy barbell measurements like average and peak velocity, and estimated force and power values, as they still have a place, but we are committed to providing a better measurement menu to coaches and athletes.
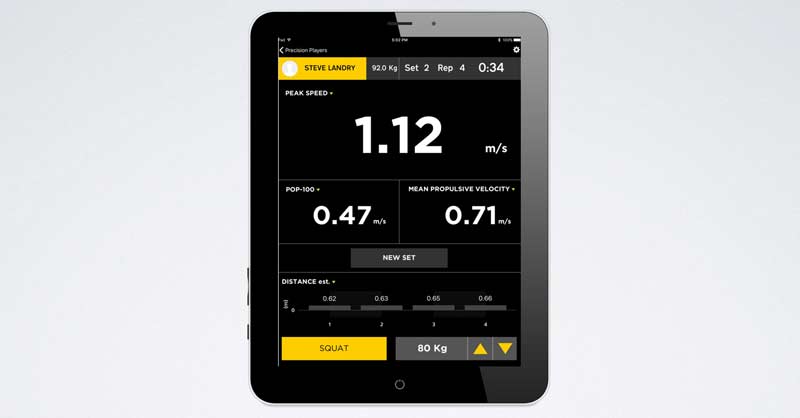
Mean Propulsive Velocity (MPV): In the research, a braking force occurs with some movements at lighter velocities. If you do not plan to jump, you “force” yourself to slow down. Even at heavier loads where the research backs acceleration throughout the full range-of-motion (ROM), our field data collection from elite power lifting shows this isn’t always the case. Advanced athletes consciously don’t lock out a rep, as they fear hyperextension or, if they are squatting, don’t want barbell rapid compression on the upper spine. As the loads get more and more impressive, including the speeds performed, the technique changes from what we typically see at lower level athletes who are using much lighter loads and sometimes even a Smith machine.
The bottom line is that different athletes move weight a different way, and we all know that. There are explosive lifters and there are grinders. That is why speed and power zones based off a percentage of 1RM really bug me. The art of coaching is determining the demands of your athlete and getting them trained to the right place. MPV is not a replacement for peak velocity; it acts like a watchdog to technique variance that will sometimes occur with unique training circumstances.
RFD (POP-100): Rate of Force Development is not very reliable in some sport actions. It is a moving target, and a controversial measurement due mostly to the procedures of the test. The conversation around RFD has turned it into a wide-open term, as most people do not understand its true definition, making it a complicated metric. But the context of what RFD represents to sport transfer is important, as the most explosive athletes are not always differentiated via full ROM metrics.
Finding a reproducible time frame within the movement to display results is key. Enter POP-100, defined as the speed produced at the 100-millisecond point of the concentric phase. Whereas Athlete #1 and Athlete #2 record a very similar full ROM peak bar speed for the squat, Athlete #2 has a 40% greater POP-100. Who is the explosive athlete? Using pin press exercises (squat, pulls, and bench press variations—coming very soon) in combination with POP-100 creates a firm starting point to test the rate of force generation trends.
Distance: One area that is neglected with bar tracking technology is joint angle estimations. A quarter squat may have sport-specific connections, but without knowing how deep one is, making a comparison is nearly impossible. The distance (or displacement) of any defined squat depth (1/4, half, parallel, full) will vary among athletes. Reinforcing full range of motion, consistency, and even exploiting sport-specific joint angles are all possible when distance of motion is measured.
We estimate distance from careful calculations, and the data is precise enough for solid decision-making in real-world scenarios. In addition, once the athlete learns their intended squat distance, the instant rep-by-rep feedback keeps them honest. As we refine our algorithms for higher levels of precision, coaches and athletes can start adding another level of evaluation with popular training lifts.
Eccentric Action: Popular outputs like peak and average force, velocity, and power are all concentric scores of movement. While I thankfully sense, by attending conferences, that eccentric training is growing in understanding, rarely does the VBT discussion come into play. Rather, the conversation still sits on counts, which are often deliberate and slow.
If you want your concentric values to improve, consider VBT applications on the eccentric side. Share on XEccentric training isn’t about speed in isolation; it is about overload and how speed is lost or gained later. Eccentric strength is very specific and a priority to coaches, and it is limiting to only look at the contributions from concentric actions. In fact, if you want to see your concentric values improve, consider VBT applications on the eccentric side.
Composite metrics, or combined measurements, will come down the road eventually, and exporting these aforementioned measures can further inform the coach and sports scientist of the true cause and effect of training. As the science evolves, my team and I will explore these opportunities, provided they are practical to coaches in the trenches. All of the above-mentioned measurements center around being a guide to help the coaches achieve human performance improvements with their athletes, not just as a means to collect barbell movement numbers.
Surgical Repetitions and Valid Measures in Training
In 2007, when I was hired by Myotest (in the pre-smartphone days), bar velocity was just starting to gain mainstream traction, and the measurements of more complex movements like jumping were more popular. Randy Huntington, a USATF Master Coach, used the Myotest to creatively evaluate very demanding bounds (hurdle jumps) with Olympic-level jumpers. The project we worked on together to fuse the force curve into the video was a big eye-opener for my education.
Here was a guy applying this brand-new tool in his own manner to analyze the muscle stiffness of athletes. This kind of blew away the value of vertical jump testing; drilling down into what really counts. I had recently transitioned from the medical device space—surgical precision is where I came from and what I wanted to bring to coaches. After seeing this surgical breakdown to get at stride-to-stride muscle stiffness, I caught the bug.
Yet, what was happening in the majority of sports was just the opposite—a lack of precision with the technologies and a lack of movement discipline during the assessments. There were many ways to cheat the tests, and the athletes were well aware of them. Without getting into the engineering details, some of these testing products flat out had way too much variability introduced by movement technique differences, while others were too loose in function to simply provide a number over data efficacy. Is the number valid and/or precise and can we trust the data?

Most of the challenge of calculating barbell performance is knowing the exercise in infinite detail, not using statistical modeling or other convenient ways to get estimates quickly. A lot of testing is required, as well as defining what a repetition truly is. Coaches badly want each repetition to be measured, but the system is looking for what it is programmed to pick up. We certainly are not perfect, but most of the coaching comments about the system “missing reps” are due to user error, not the technology. There are the issues of following the movement instructions, and the intended use of the product, along with proper execution of the lift. For example, during the deadlift the system is expecting the concentric phase followed by a lock-out. If you start the lift but don’t lock out, the system errors the rep and resets for the next one.
My job is to dissect a repetition and know when the sensors need to measure and when the motion is not to be counted. This is the hardest part of developing a bar tracking device. A box squat to an accelerometer is radically different than a jump squat, but detecting the difference between a quarter squat and racking a heavy full squat often results in some sensors adding a false rep, commonly referred to in some circles as the “phantom rep.”
Missing reps are not the fault of the sensor; it’s usually the sensor being so precise that a few centimeters of motion are lost, so it doesn’t count the rep at all. Like a very-demanding judge at a powerlifting meet, those that have been a little lax in training will have a rude awakening. It’s not the judge’s fault; it’s the athlete not knowing the rules or definitions of what is counted and what is not allowed. If you prefer to coast through the stop sign, you will probably struggle with our system.
Why so much discussion of what a rep means, you may ask. In short, the answer is that coaches that demand quality, research-grade data have to do their part in the data collection process. Strict technique based on the common definition of the movement must be adhered to or it’s technically a different exercise and the sensor may not pick up the repetition. Research that tests athletes with simple exercises or with Smith machines may have good intentions, but when the rubber hits the road in the weight room, much of the validity is lost.
I have been a staunch advocate for creating measurements “in the wild,” or in collaboration with athletes who are training properly, not from machine learning or similar. I would rather have calculations based on valid movements versus allowing too much slack, and thus delivering inaccurate data. In this scenario, what’s the point?
The military work we do is the inspiration for what I call “Barbell Discipline,” or the ability to follow instructions time after time. Last year, I had a product training meeting with a Special Ops Division head performance coach. We talked about the system movement requirements, and he said “no problem, my guys follow instructions.” Strict execution while allowing for natural style is necessary for testing reliability. Unfortunately, coaches sometimes don’t like strict procedures, but a bodyweight squat jump test with a small countermovement is not a squat jump test. The point of the test is to see what you can do without any stretch reflex.
If you have the proper squat jump assessment and the countermovement jump assessment, then you can properly look at eccentric utilization ratio (EUR), which is a powerful metric to consider. Coaches demand accuracy and validity from the devices, but the engineers need the same from movements protocols being conducted in the field. How many times do we allow athletes to cheat or get away with compliance of a protocol just to get a number? Strength coaches promote discipline and obedience because it sounds nice to the head coach, but in order to benefit from that philosophy in the weight room, they need to start with accountability in testing and measuring.
Immediate Feedback, Autoregulation, and Repetition Recovery
The combination of multiple methods of training using barbell data as feedback is a phenomenal opportunity in training. Some examples of the reason we use the rep-by-rep flash and alert sound are to reduce drift error (common with accelerometers) and leverage the athlete’s inter rep recovery period. The amount of time between bouts of effort is part of the equation of cluster sets, or lifting sets that manipulate recovery times between single or low repetition ranges. Our system is not for cranking out reps, which is counterintuitive to the purpose of using VBT methodology.
“Using barbell data as feedback on multiple training methods is a phenomenal opportunity in training.”
During power/speed training, every rep needs to count, with full reset by the athlete and full concentration for each rep. Maximizing effort is emphasized. You would be amazed what the total power output looks like over a five-rep set using our system method versus free forming through the reps. Sure, sometimes you may want the athlete to crank out reps, with a different training goal, so go for it. Keep in mind, just because you have a VBT measuring tool, it does not mean you need to use it all the time. I actually advocate for less assessment time, as there’s no need to create numbers for numbers’ sake. Pick your spots and do it right. Make the days the VBT tool is on the barbell competitive days, not part of a daily routine.
Video 2: My presentation from 2010 when I was with Myotest, the first accelerometer barbell tracking product in the market. What we learned from a decade ago is now being put to use, as coaches are learning more about best practices with cluster training and potentiation.
With all the science and support by coaches, you would think cluster sets would be a trend and popular request with us, but they’re not. Obviously, the logistical factors of sharing a rack with other athletes is one thing, but we have not encountered as many coaches performing autoregulation and cluster-style training because managing it with teams is far different than using it for your own training. How hard, how much, and when to stop are the things coaches have a thirst for. Cluster sets are perfect options for teams when athletes can share similar loads, but also great for organized groups as long rest periods can include partnered training if instructed properly.
Autoregulation is great on paper, but it really is nothing more than adjusting on the fly versus what is planned. One of the strongest arguments for VBT is the use of the immediate feedback of data to add or lower the weight based on how the athlete is feeling at that particular time. Combined with a good training plan, autoregulation can be part of warm-up and work sets for a true optimal load.
Just because you have a VBT measuring tool does not mean you need to use it all the time. Share on XFinally, we get to motivation, which can be a double-edged sword; meaning VBT feedback is great to utilize for higher levels of effort, but it can drive athletes into the ground if they are not supervised properly. Nobody wants to be the bad guy and pull them away from a motivational challenge, but injuries are real. Warning signs must be acknowledged and acted upon.
Are You Willing to Change or Want to Be Comfortable?
I realize some coaches reading this article will likely want to argue the science to continue what they do, and not change what they do or believe. Change can be painful and uncomfortable, but it is necessary to be competitive. Uncomfortable change has been part of our process. If you want better results, you must look at things differently, with a fresh lens.
Ask the tough questions and challenge your own beliefs and preferences in training. We are on the same side—working together to help athletes—and exploring the concepts shared here will move training forward.
Since you’re here…
…we have a small favor to ask. More people are reading SimpliFaster than ever, and each week we bring you compelling content from coaches, sport scientists, and physiotherapists who are devoted to building better athletes. Please take a moment to share the articles on social media, engage the authors with questions and comments below, and link to articles when appropriate if you have a blog or participate on forums of related topics. — SF