[mashshare]

Body composition is often overlooked as an important metric, but it’s crucial to have a detailed understanding of how it applies to performance and health. There is a general misunderstanding of body composition in sport.
First, we’re not only concerned about the type of mass (i.e., percent fat, fat-free mass, fat mass), but also the type and distribution of mass. The distribution of an athlete’s lean and fat mass will influence how they move through space. Two athletes who weigh 250 pounds and have 15% body fat will move very differently if their upper to lower mass ratio is 1.7 (top-heavy) or 1.5 (bottom heavy).
Second, there is no clear definition of what good or ideal body composition is for sport. I’ve spoken with many coaches who have a range for different athletes, but there’s a big difference between a general range and an ideal range. We need to consider ideal body composition in the context of the demands of the athlete’s sport and their body frame.
Finally, there are many ways to measure body composition and each has different levels of accuracy, reliability, and feasibility. Having spent time in both applied and research settings, I understand that we usually have to pick two out of three of these (i.e., accuracy vs. reliability vs. feasibility). Which two you pick determines the cost, another important factor.
For athlete body composition, accuracy and reliability are more important than feasibility, but there is a way to get all three. Body composition does not need to be measured daily, weekly, or even monthly because meaningful changes take time.
DXA: Advantages and Limitations
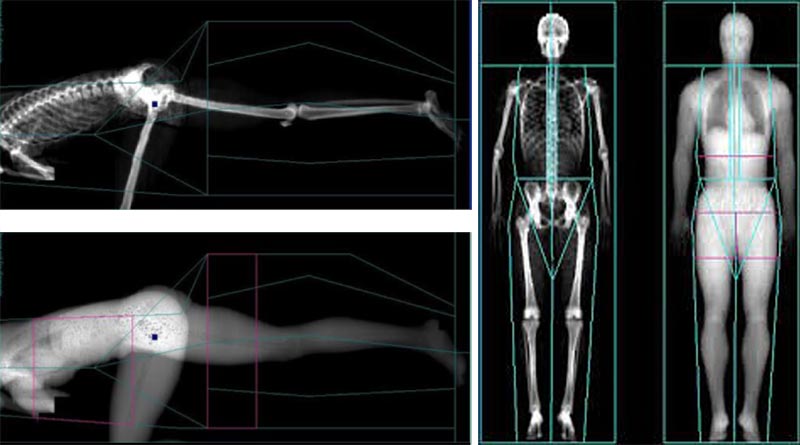
Two to four measurements a year with dual x-ray absorptiometry (DXA) will benchmark changes and help us understand the type and distribution of mass. DXA scans paired with more feasible measurements like weight, 3D scanning, and in some cases bioelectrical impedance allow us to track changes between scans with more accuracy.
While many consider DXA a gold standard, it’s not without its limitations. First and foremost, DXA uses ionizing radiation. While the absolute dose is minimal for each scan (less than spending eight hours outside on a sunny day), we need to be cautious. That’s why we recommend two to four scans each year.
Other limitations include cost and scan time. Because machines cost $70-$100K and individual scans range from $75-$150, cost is a legitimate issue. But accuracy and reliability are expensive. We can buy a 60-inch flat screen TV for $100 bucks, but if it only lasts a few months, wouldn’t it be better to spend more money for a reliable high-quality TV?
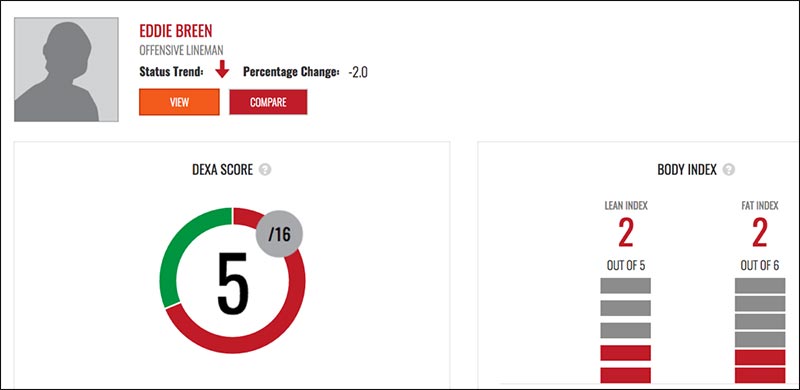
DXA also has a big limitation in the interpretation of the data. Currently the reporting capabilities of DXA are limited to multipage hard copy reports (5-15 pages per athlete) or CSV export with over 200 variables for each athlete. I believe this is a critical reason why there has not been widespread adoption of DXA in sport, and it’s one of the reasons we started Dexalytics. There is a lot of valuable information obtained from a single DXA scan; we wanted to create a solution that pulls this information out and displays it clearly.

Because DXA provides so much information, the critical information sometimes can be missed. In addition to the traditional metrics of %body fat, total lean mass, and total fat mass, DXA provides accurate and reliable segmentation measurements for different regions of the body. It also gives asymmetry measurements of the right and left sides of each region. These data points allow us to calculate functional ratios of an athlete’s mass distribution.
We can also create custom regions of interest (ROI) for specific measurements of other parts of the body.
More data is not always better if we can’t interpret it or summarize, analyze, and disseminate it promptly. And it’s critical to understand that body composition is not just about totals, it shows how the different parts contribute to that total.

Bone Density and Athletes
Bone mass and bone density measurements are important for monitoring athlete health. Bone density issues are usually associated with female distance runners. But look at all of the bone stress injuries that are becoming more common in other sports (the NBA, for example). There is a need to start tracking bone density in athletes.
Two important things to remember:
- DXA measures the overall density of the bone (g/cm3). It does not measure the specific structure and strength of cortical (outer) versus trabecular (inner spongy) bone that you may get from peripheral quantitative computed tomography (pQCT) or other methods.
- Bone density needs to be compared in terms of like versus like. When you get a DXA, you typically will get t- and z-scores compared to the normative DXA database for total bone mass density (BMD). In our experiences, the vast majority of athletes will have t- and z-scores above two or three.
T- and z-scores refer to the amount of deviation above and below the mean of the data. Although two or three is well above the age and gender average for the normal population, athletes are not part of the normal population. They need to be compared to similar individuals in their sport and their position.
Some athletes can be at risk even with a high z-score of 2.5 (2.5 standard deviations above the mean) when compared to everyone else who plays their position and they fall in the lowest 10%. We identify the individuals in the lowest 10th percentile for their position and sport, and we pass that information along to their medical staff to decide if further assessments are needed.
Visceral Adipose Tissue
DXA also estimates visceral adipose tissue (VAT). VAT is fat tissue that surrounds our internal organs and is associated with chronic inflammation and several cardiometabolic diseases. The body does not want to store fat in the visceral region. But subcutaneous (above the muscle layer) fat stores are limited, so spillover occurs into the visceral regions and other ectopic depots (for example, the liver and heart).
We’ve demonstrated that VAT in male athletes significantly increases when they’re above 20% body fat. Females store fat better, and we have not observed significant increases in VAT in women until about 40% body fat.
Tracking VAT in athletes with large body types can help maintain their health and well-being. Share on XThis puts some larger athletes at significant risk of increased VAT stores. Especially collegiate and professional offensive and defensive linemen who, on average, have 28-32% body fat. This becomes even more important after retirement when activity levels decrease, adding to a high likelihood of increased body fat accumulation. Tracking VAT in athletes with large body types is important for maintaining their health and well-being.
Bringing the Team Together with Information
Almost every athlete has a large support network to improve or maintain their health and development. While everyone agrees that the athlete is (and should be) at the center of this group, communication among these individuals is sometimes lacking.
Moreover, if we share data without any context, we risk multiple interpretations and communication of varying messages. We focused on this when designing Dexalytics. We want to provide information that is understandable for everyone, so the entire team is on the same page and moving the athlete in the same direction.
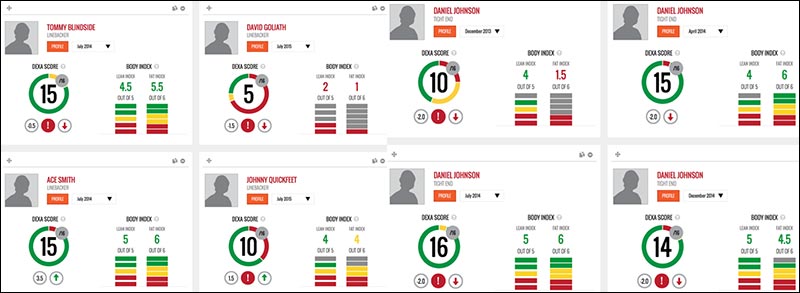
We understand that each member of the team will view the data through their unique lens; that’s what makes them specialists in their area. We summarize the data in a way that makes the initial message clear: This is where this athlete is at now, this is the change from their last scan, and these are the areas that can be improved. The additional context and information that comes from each specialist then become even more valuable.

Body Mass: Ratios and Symmetry
We based Dexalytics on over 20 years’ experience with DXA and our belief that meaningful information is missed when we rely on totals. Imagine using only the total load metrics from player tracking devices. Yes, it can be done and does provide some value. But much more information and context are garnered from looking at the type and intensity of movements that contributed to that load.
The type and distribution of load are similar to the type and distribution of body mass. Share on XThe type and distribution of load are similar to the type and distribution of body mass. When we measure body composition, we first look at the traditional metrics. Then we want to know about the ratios and symmetry of the body, and we want to do all this within specific parameters of an athlete’s sport and position.
Body Types and Sport, Player Positions
The information allows us to compare similar body types. Exploring body type is incredibly important in sports because there are dramatic differences between positions (for example, American Football). From there, we look more in depth and begin to identify body composition differentiators that are associated with on-field and on-court sport success.
Bigger is not always better for every athlete; added mass can lead to slower movement, increased load, and greater stress. Without knowing what the body is made of, how can we know what the body is capable of?

We’re very interested in the changes that occur during a competitive season and recently completed postseason scans for a variety of sports teams. We’re finding that change is even more complex than simply mass or percent mass going up or down.
For example, ten athletes had an increase in percent fat mass ranging from 1-4% from the start to the end of the season. Three athletes increased lean mass and fat mass (with a disproportionate increase in fat mass to lean mass). Two lost lean mass and maintained fat mass. Two others lost lean mass and increased fat mass. And two athletes maintained lean mass and gained fat mass while one lost lean mass and fat mass (a higher proportion of lean mass lost).
It’s noteworthy that the converse was also true. Of the group that had lower percent fat at the end of the season, there were multiple variations of how this occurred. Most of us would agree that increases in percent body fat would be expected (although not ideal) over the season. But which of these five different options is better or worse for maintaining performance? Admittedly, I don’t know the answer yet; there’s a lot we do not know about body composition and performance in athletes.
Type and Distribution of Body Mass
To further complicate things, we have to look at where the increases and decreases came from for both fat and lean (muscle) mass. Loss of leg muscle mass is not ideal just as gaining fat mass in the abdominal or gluteal region would not be ideal.
We often see lean mass increases in the trunk with similar losses in the legs, which would register as no change in total lean mass or FFM (depending on your method). In one extreme case, we retrospectively observed an athlete gain 16 pounds of muscle in his torso and lose 16 pounds in his legs.
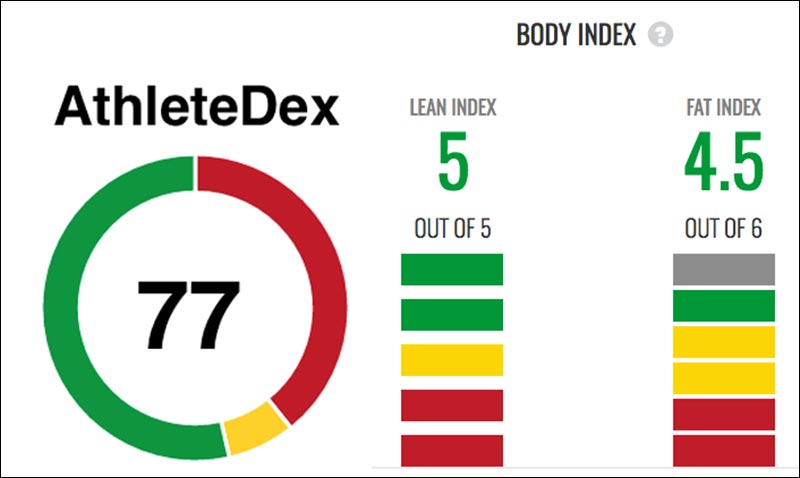
These shifts go unnoticed when we look only at totals, but they are far more important than the change in the total mass. To account for these changes, we’ve created the AthleteDex—a composite score of total and regional mass measurements that factors in changes in functional mass.
Functional mass refers to the type and distribution of mass that is changing. For example, an athlete who maintains their total mass with a loss in leg lean (muscle) mass is classified as a functional loss. In most sports, the legs are the primary mover and losses in the legs are associated with decreased strength and power.
We also produce an index of lean and fat mass to describe the relative change in these to compartments.

The Future of Body Composition
Body composition is an undervalued metric in sports, mostly due to a misunderstanding about what body composition is and a reliance on feasibility over accuracy. Nevertheless, as the quest for more and better data continues to increase in elite sport, I foresee a greater interest in athletes’ bodies beyond totals (and yes I am clearly biased in this regard).
Several Division 1 programs, multiple Olympic training centers, and double-digit professional sports franchises currently use DXA with their athletes, with a DXA on site or through a third party.
As a researcher, I want to move beyond traditional total metrics and start using metrics that describe not just the type of mass but the distribution of that mass.
We recently began a 10-year study to measure 4,000 athletes from high school through retirement (longitudinal and cross-sectional) to understand how athletes evolve over different periods of their careers. As our database continues to grow, we’ll get even better at identifying the frame size for different athlete body types. A clear understanding of how much mass each frame can hold will help inform changes in body composition over time.
At Dexalytics, our mission is to create better information, allowing for better decisions to develop better athletes. You can check us out at our website Dexalytics. If you would like to talk or see a demo of Dexalytics, I can be reached by email at [email protected] or @tylerAbosch on Twitter.
Since you’re here…
…we have a small favor to ask. More people are reading SimpliFaster than ever, and each week we bring you compelling content from coaches, sport scientists, and physiotherapists who are devoted to building better athletes. Please take a moment to share the articles on social media, engage the authors with questions and comments below, and link to articles when appropriate if you have a blog or participate on forums of related topics. — SF
[mashshare]
References
- Dengel, D. R., T. A. Bosch, T. P. Burruss, K. A. Fielding, B. E. Engel, N. L. Weir, & T. D. Weston. “Body Composition and Bone Mineral Density of National Football League Players.” Journal of Strength & Conditioning Research 28.1 (2014): 1-6. doi:10.1519/JSC.0000000000000299.
- Bosch, T. A., T. P. Burruss, N. L. Weir, K. A. Fielding, B. E. Engel, T. D. Weston, & D. R. Dengel. “Abdominal Body Composition Differences in NFL Football Players.” Journal of Strength & Conditioning Research 28(12) (2014): 3313-3319. doi:10.1519/JSC.0000000000000650.
- Bosch, T. A., D. R. Dengel, J. R. Ryder, A. S. Kelly, & L. Chow. “Fitness Level is Associated with Sex-Specific Regional Fat Differences in Normal Weight Young Adults.” Journal of Endocrinology and Diabetes 2(2) (2015):5.
- Raymond, C. J., T. A. Bosch, F. K. Bush, L. S. Chow, & D. R. Dengel. “Accuracy and Reliability of Assessing Lateral Compartmental Leg Composition Using Dual-Energy X-Ray Absorptiometry.” Medicine and Science in Sports and Exercise 49(4) (2017): 833-839. doi: 10.1249/MSS.0000000000001168.
- Bosch, T. A., A. Carbuhn, P. R. Stanforth, J. M. Oliver, K. A. Keller, & D. R. Dengel. “Body Composition and Bone Mineral Density of Division 1 Collegiate Football Players, a Consortium of College Athlete Research (C-CAR) Study.” Journal of Strength & Conditioning Research 2017 [Epub ahead of print]. doi:10.1519/JSC.0000000000001888.
- Buehring, B., D. Krueger, J. Libber, B. Heiderscheit, J. Sanfilippo, B. Johnson, I. Haller, & N. Binkley. “Dual-Energy X-Ray Absorptiometry Measured Regional Body Composition Least Significant Change: Effect of Region of Interest and Gender in Athletes.” Journal of Clinical Densitometry 17(1) (2014): 121-128. doi.org/10.1016/j.jocd.2013.02.012.
- Nana, A., G. J. Slater, W. G. Hopkins, & L. M. Burke. “Effects of Exercise Sessions on DXA Measurements of Body Composition in Active People.” Medicine and Science in Sports and Exercise 45(1) (2013): 178-185. doi:10.1249/MSS.0b013e31826c9cfd.
- Binkley, T. L., S. W. Daughters, L. A. Weidauer, & M. D. Vukovich. “Changes in Body Composition in Division I Football Players Over a Competitive Season and Recovery in Off-Season.” Journal of Strength & Conditioning Research 29(9) (2015): 2503-2512. doi:10.1519/JSC.0000000000000886.
- Trexler, E. T., A. E. Smith-Ryan, J. B. Mann, P. A. Ivey, K. R. Hirsch, & M. G. Mock. “Longitudinal Body Composition Changes in NCAA Division I College Football Players.” The Journal of Strength & Conditioning Research 31(1) (2017): 1-8. doi:10.1519/JSC.0000000000001486.


