

Performance testing is commonplace in most strength and conditioning programs. By implementing the correct tests, you can get a snapshot of an athlete’s strengths and weaknesses while also quickly comparing that athlete to their peers. Nearly every physical quality can be tested, with options available for any budget. Among the cheapest, low-tech assessments are jump tests—specifically, horizontal-based variations like the broad jump. These are excellent assessments of lower body power, and athletes also love seeing how far they can jump compared to their peers.
For an S&C coach, the attractiveness of these tests is that all you need to do is lay down a tape measure, give some simple instructions, and start collecting data. Coaches now have a metric (jump distance in either feet or meters) to rank athletes…but is this the best use of this assessment?
A common trend in performance testing is to calculate an athlete’s “relative” strength or power. This is because athletes of different body sizes—despite being similar in other respects, such as gender, age, or absolute scores—may have wildly different relative scores. Moreover, having a superior strength- or power-to-weight ratio is more advantageous for an athlete than simply having higher absolute scores, especially in sports where weight categories are used (e.g., wrestling). This is why coaches care more about squatting 2x bodyweight than x amount of weight, as it is a more useful way of seeing how strong an athlete really is.
While many strength and power metrics are viewed under this lens, it is apparent that traditional jump testing has not been given this level of consideration.
Why Traditional Jump Testing Doesn’t Tell the Whole Story
There is a glaring weakness to using an athlete’s jump distance at face value. Take, for example, the hypothetical data set below.
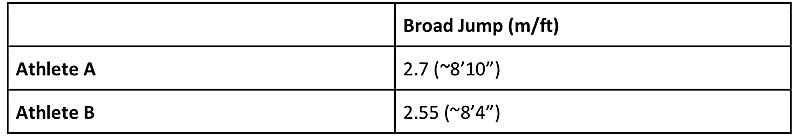
Based on this limited information, if I asked you to determine which athlete is more powerful, or at the very least who is the better jumper, most coaches would automatically assume Athlete A. It makes sense, as the first athlete jumped nearly half a foot further. It is common for jump scores to be used this way (including vertical jumps) in practice; athletes who get a higher absolute score are slated as the better jumpers and more powerful athletes.
But how would this assumption change if we added a little more context?
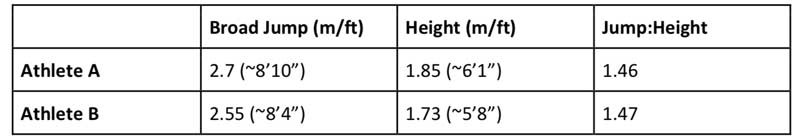
As we can see, by simply taking the athlete’s height into consideration, we can see a different story emerge. We can now see Athlete B slightly edges out Athlete A when looking at the jump-to-height ratio. This is because we can now assess the athlete’s relative jumping ability, not just their absolute jumping ability. By using a jump-to-height ratio, coaches can compare athletes of different ages, heights, genders, and playing levels without having to buy any high-tech or expensive equipment. Just stick a tape measure on the wall and take the athlete’s standing height.
By using a jump-to-height ratio, coaches can compare athletes of different ages, heights, genders, and playing levels without having to buy any high-tech or expensive equipment, says @CoachGies. Share on XI know what you’re thinking: “But coach, this is just a theoretical example. Surely this doesn’t mean much with real athletes!” Au contraire.
To provide some real-life context with elite-level athletes, I pulled the broad jump data from the 2022 NFL Combine for the Wide Receivers group (Table 3). When I applied the jump-to-height ratio and then ranked athletes on both their broad jump and ratio scores, something interesting started to emerge. Some athletes who were in the top third of broad jump scores suddenly dropped down the ranks, and athletes with some of the worst scores moved up. For example:
- Athlete 3 was 12th in the broad jump when looking at raw scores but is third overall when looking at his jump-to-height ratio.
- Athlete 11 was 28th in the broad (out of 33) but then jumped up to 11th with jump-to-height ratio.
- Athlete 26 dropped all the way down from 12th overall to 26th.
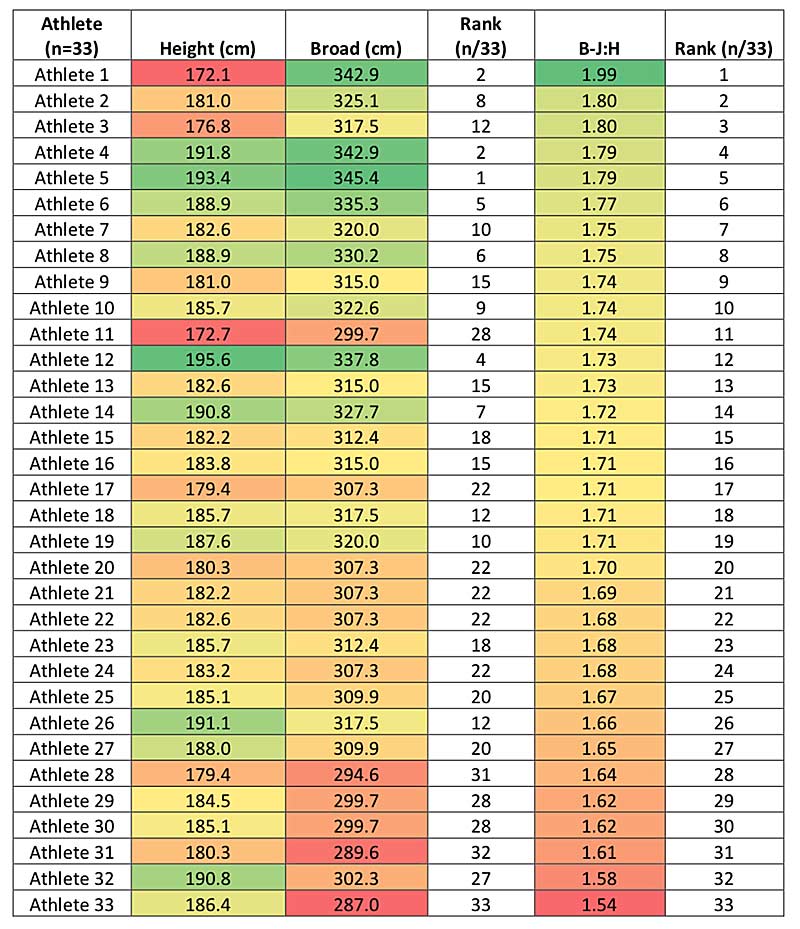
Legend: B-J:H = Broad jump to height ratio; Darker green = highest score; Darker red = lowest score
It also highlights just how freaky Athlete 1 is in terms of broad jump performance. This athlete was the shortest overall but had the second farthest broad jump corresponding to the top jump-to-height ratio. He is jumping 2x his standing height! The jump-to-height ratio helps put into perspective just how exceptional this athlete really is in terms of horizontal power production compared to other athletes.
I also looked at the correlation between broad jump distance, jump-to-height ratio, and the 40-yard times for the same group. When looking at broad jump distance and 40-yard times, there was a low to moderate negative correlation (r= -0.41). Meaning, as broad jump distances increased, 40 times decreased. But when looking at jump-to-height ratio, there was an even stronger negative correlation of r= – 0.51. Granted, it’s not a super strong correlation, and I am no statistician, but it does appear that the jump-to-height ratio is a little more informative than broad jump distance on its own—at the very least, it is something to consider when evaluating jump performance.
It does appear that the jump-to-height ratio is a little more informative than broad jump distance on its own… It’s something to consider when evaluating jump performance, says @CoachGies. Share on XBy adding this one quick change, coaches can level up their performance assessments.
Introducing the Jump-to-Height Ratio
Hopefully, it is apparent that simply using raw jump data is an incomplete method for comparing athletes. Typical standing broad jump normative data only gives us a grading system based on raw values.
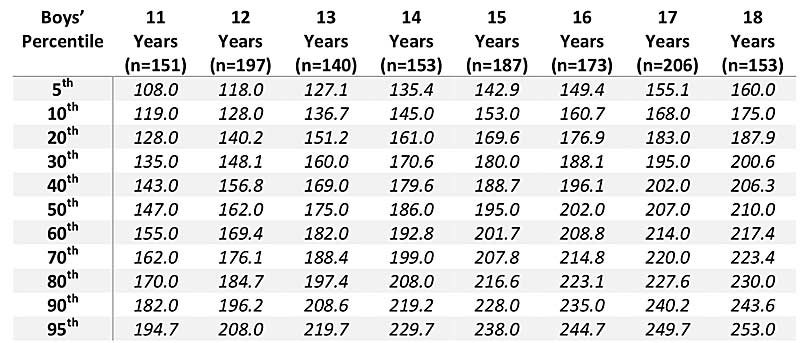
For example, consider data looking at normative reference values for the broad jump in adolescents (Table 4). This large data set gives us a good idea of what different-aged athletes can perform for this test; however, as height is not considered, we are in the dark on whether the athletes in the higher percentiles are there because they are more powerful or simply because they are taller than their peers.
All things being equal, taller athletes should be able to jump farther than shorter athletes. This is for a few reasons:
- Taller athletes have longer limbs (i.e., longer levers), which increases the biomechanical advantage and torque produced around the joints, which can increase the amount of force produced during jumps.
- Taller athletes have longer legs, meaning they can reach further forward before landing.
- Some taller athletes may have more muscle mass and, thus, more force potential.
However, there are some disadvantages, like taller athletes being heavier, which could negatively affect their jump performance. The point is that simply looking at jump distance doesn’t provide enough nuance to make informed decisions on how good of a jumper an athlete is. Utilizing the jump-to-height ratio would clear up this confusion and provide more information when ranking athlete abilities.
Simply looking at jump distance doesn’t provide enough nuance to make informed decisions on how good of a jumper an athlete is. Utilizing the jump-to-height ratio would clear up this confusion. Share on XWhile absolute data can prove useful, it is difficult to use this data in isolation when assessing athletes who may have a foot of difference in standing height, which is common for those who coach 12- to 18-year-old athletes. The simple answer is that you can’t, but with a few quick changes, you can start applying the data in a useful context.
We use the jump-to-height ratio with three different styles of jump:
- The standing broad jump.
- The single leg hop and stick.
- The lateral bound.
For the first two, you will need the athlete’s standing height, but for the lateral bound, you will need the athlete’s standing split.
Protocols:
Standing Height: Ensure you measure the athlete with their shoes off, from the base of the foot to the top of the head.
Standing Split (Lateral Bound Only): Have the athlete stand with their feet as far apart as possible and measure from the inside edge of one foot to the inside edge of the other foot. Some key points in standardizing the standing split:
- Hands must be on hips.
- Torso must be completely vertical.
- Feet must remain flat.
- Knees must remain straight.
- Toes must be pointing forward.
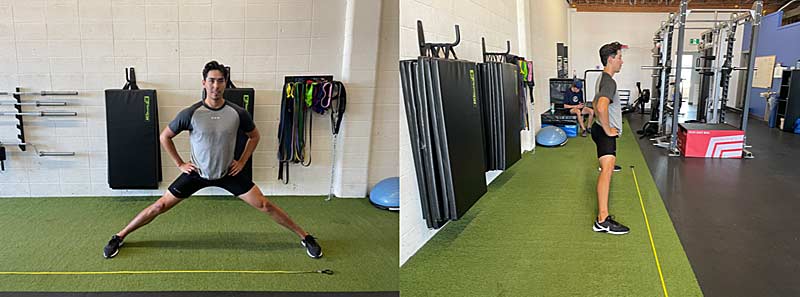
Video 1. Standing Broad Jump: Have the athlete stand behind a marked line and jump as far forward as possible. Measure the back of the athlete’s heel. If the athlete falls or steps back, the rep does not count; if the athlete falls or steps forward, measure where their heel initially touched the ground.
Video 2. Single Leg Hop and Stick: Have the athlete stand behind a marked line on one foot and jump as far forward as possible, landing on the same foot. Measure the back of the athlete’s heel. The athlete must stick the landing. If the athlete bobs around to regain balance or steps down with the other foot, do not count the rep. Make sure to repeat with both sides.
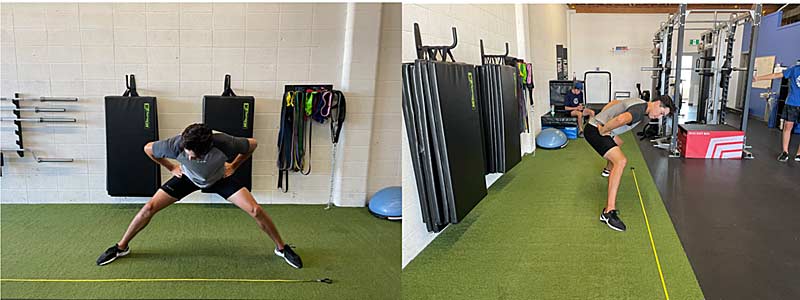
Video 3. Lateral Bound: Have the athlete stand behind a marked line with the inside edge of their foot against the line and jump as far sideways as possible, landing on the opposite foot. Measure the inside edge of the foot. The athlete must stick the landing. If the athlete bobs around to regain balance or steps down with the other foot, do not count the rep. Make sure to repeat with both sides.
Have them attempt each jump 2–3 times to find the athlete’s best score. You can now divide the jump distance by either the athlete’s standing height or standing split.
Applying the Jump-to-Height Ratio
Now that you have your athletes’ jump-to-height ratios, you can start applying that data to begin understanding your athletes’ jump abilities on a deeper level. You can rank groups of athletes (age groups, sports teams, positions, etc.)
The jump-to-height ratio gives coaches a clearer picture of which athletes are better jumpers without getting distracted by the shiny object of an athlete jumping the farthest overall. Share on XRehabilitation Uses
Jump-to-height ratio can be an impactful metric when considering lower body rehabilitation exit criteria and return to play. An interesting study from Ohji et al. (2021), which looked at single leg hop distances normalized to height and return to sport status post ACL reconstruction, found that a distance <70% of standing height on the operated leg was negatively associated with return to sport status. The authors concluded that improving single leg hop score to >70% of height may be important in supporting return to sport post-ACL surgery.
This shows the potential of jump-to-height ratios in providing clear exit criteria and training goals for athletes recovering from injury and potentially identifying risk factors for future injury. It should be mentioned that this is an understudied area, so you should take caution in over-interpreting this data. However, having historical jump-to-height ratios for athletes can be helpful if they suffer a lower body injury, as you then have clear benchmarks to work toward during the rehab process to ensure a safe return to sport.
Performance Uses
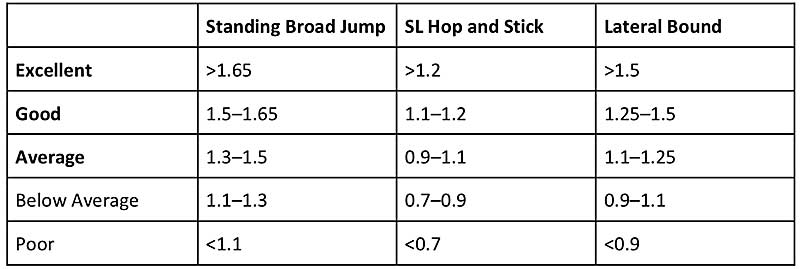
Though this is not a commonly used metric—meaning there is little in the way of normative data—we have started building out scoring standards that we hope will be improved as more coaches adopt the jump-to-height ratio. The beauty is that the more data you collect with your athletes, the more accurately you can produce scoring standards that apply to your specific situations (age groups, sports, genders, playing levels, positions, etc.). It can then help inform training interventions based on the ratios that best fit those athletes.
Closing Thoughts
S&C coaches have used relative metrics to gain deep insights into an athlete’s athletic potential; however, horizontal-based jumps have not been given this same level of consideration. By utilizing a simple jump-to-height ratio, coaches can quickly and accurately compare jump data between athletes of different heights, sports, or stages of rehab. Rather than relying solely on the total distance jumped, I encourage you to dig a little deeper to get the most out of your testing data.
References
1. Saint-Maurice PF, Laurson KR, Kaj M, and Csányi T. “Establishing normative reference values for standing broad jump among Hungarian youth.” Research Quarterly for Exercise and Sport. 2015;86(sup1):S37–S44.
2. Ohji S, Aizawa J, Hirohata K, et al. “Single-leg hop distance normalized to body height is associated with the return to sports after anterior cruciate ligament reconstruction.” The Journal of Experimental Orthopaedics. 2021;8(1):26.
3. NFL Combine Data accessed: https://www.draftcountdown.com/combine/2022-nfl-combine-results/


