
Plantiga is a company that has developed a research-grade computer analysis platform and wearable sensor that slides into a pre-fashioned inner sole for the latest in wearable technology.
The sensor is an IMU (inertial measurement unit) that weighs just 17.5 grams. Depending on the footwear, the athlete is barely aware of it. This allows for data collection in the functional task of interest without the changes to athlete behavior that occur in a lab setting or using correlation studies to draw inferences back to the area of interest.
Plantiga’s IMU allows for data collection in the functional task of interest without the changes to athlete behavior that occur in a lab setting. Share on X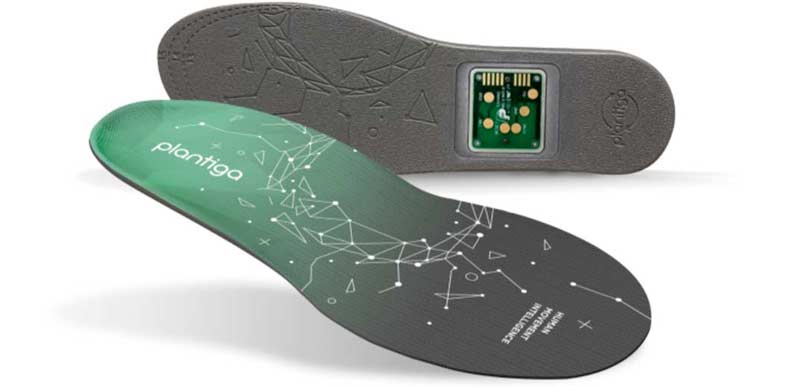
Wearable biometric devices are fast becoming a must-have for every athlete, from the recreational to the elite. Dr. Matt Jordan wrote for SimpliFaster outlining the history and development of wearable monitoring, the validation studies, and what sets Plantiga apart with its plans for the future using AI algorithms to aid the practitioner.
How to Use Plantiga
As a sports physio, my main area of work is in athletics. The basis of this article is how I have been using Plantiga in the field to improve performance as well as monitor and guide end-stage rehabilitation strategies. A future article is planned on how Plantiga is used within the clinic, but in the meantime, you can read many such articles on the Plantiga blog.
The Basics (Which Are Far from Basic)
The beauty of Plantiga is that you can select the test that is most relevant to you and your athlete. There are numerous suggested tests where normative data has been collected that demonstrated reliability. These are walking, self-selected pace running, change of direction, workload monitoring within session, countermovement jumps, repeated hopping, single leg hop for height, and single leg hop for distance. Plantiga has described and video guided a methodology via their app to assist with reliability.
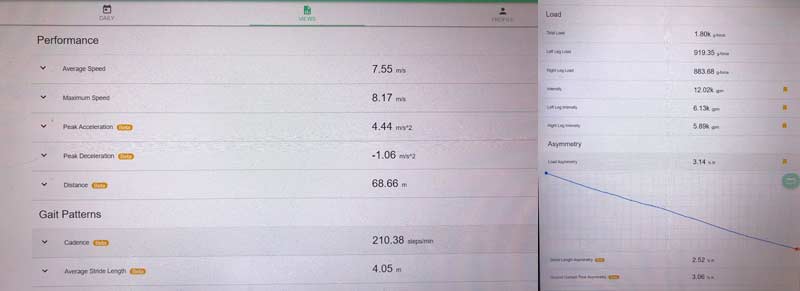
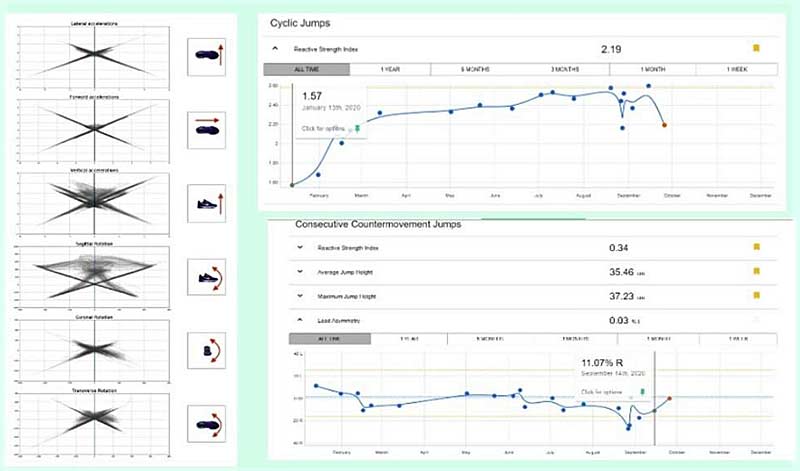
The review function summarizes the metrics related to each task and highlights metrics that fall outside of the growing body of collected normative data to aid in further analysis. Data such as top speed, average speed, cadence, stride length, peak acceleration and deceleration, ground contact time, flight time ratio, and distance are all very usable measures that the practitioner can pull up within minutes of testing. (Example is image 2a.)
Plantiga then goes further…
By having the IMU in the shoe, it can act as more than just a contact mat. It can detect acceleration changes that will give information on force while the athlete is moving. The review will break down the overall load experienced within a session, as well as across limbs and over time (intensity). It then calculates the asymmetry across sides to provide information to the practitioner on right/left discrepancies in load, ground contact time, and stride length. (See image 2b.)
By having the IMU in the shoe, it can act as more than just a contact mat. It can detect acceleration changes that will give information on force WHILE the athlete is moving. Share on XThis can then provide meaningful baseline data on willingness to load and limb kinetic function, but more significantly, it can provide a signposted pathway of the athlete’s rehabilitation or performance history. We can see in image 2b under load asymmetry a graphical representation of changes over time that the dashboard automatically generates. For ease, the practitioner can create notes on the focus or intervention within each session for historical referencing.
Barrie Jennings of NZ Speedworks uses this feature with Cyclic CMJ in elite netballers.
By using Plantiga’s analysis system, Barrie was able to show the coaching staff objectively what they were observing in training. The athlete was using her right side far more than her left, affecting her performance and risking potential reinjury. The coaching team decided to modify the athlete’s training to reduce the number of high-intensity sessions. Retesting showed a return to pre-aggravation levels by September without setback or injury.
The Advanced
When I have an athlete, I like to perform the one-minute walk test and the two-minute (self-selected pace) run. These two tests provide wonderful insight into how the athlete moves habitually via the “movement map.”
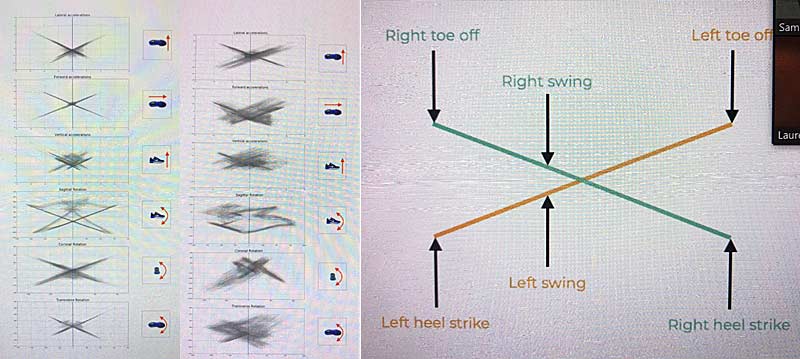
I will utilize these “maps” to correlate with what I am seeing within the clinic or on the track.
Movement maps are complicated, and your interpretation improves with practice (and often after discussion with the amazing staff of Plantiga!). An outline on how they are generated can be found here, and image 3c is a guide to what part of the gait cycle you are looking at when attempting to interpret.
An entire article could be written on analyzing movement maps, but I will attempt to give you a snapshot.
In image 4, I have enlarged the last section of the walk test (image 3a), which measures the foot add/abduction motion. The highlighted section shows an increase in movement (longer lines) at left toe-off and right heel strike, as well as more movement variability (thicker lines) at right heel strike.
In a normal walking pattern, the left leg is in contact with the ground here, so my attention at the track and within the clinic may be drawn to what is creating this. In this case, this athlete has a mild left gluteus medius tendinopathy and left sinus tarsi irritation that may be affecting his left stance phase. Intervention here and then reassessment using Plantiga can help to determine this within the clinic.
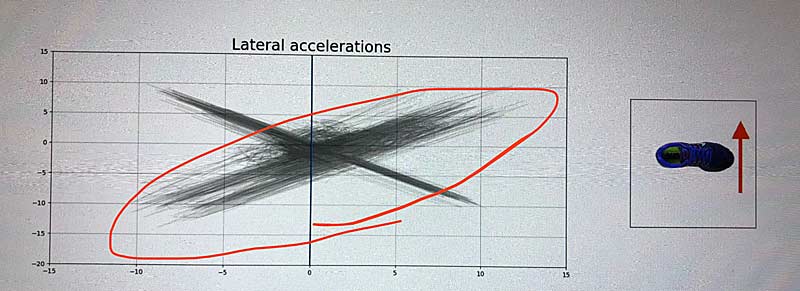
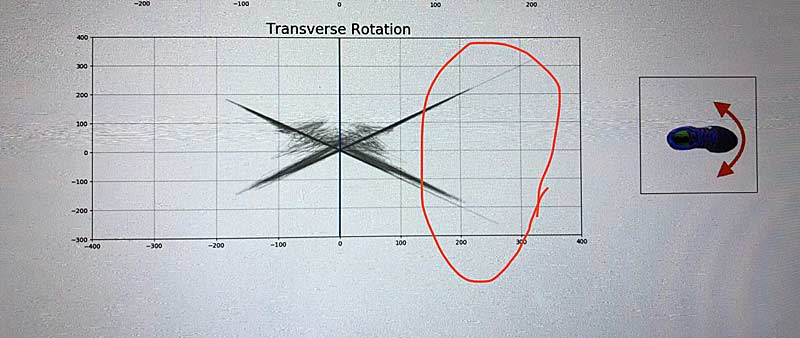
With the image above, I have enlarged the top section of the run test, which looks at lateral accelerations. The highlighted section shows clearly that this athlete has an issue with the left limb from heel strike through swing to toe-off, as seen by the thicker lines (more variable movement) compared to the right limb. (See image 3c as a reference point for movement map analysis.)
This athlete has a long history of chronic left-sided limb injury, so we will aim rehabilitation strategies at improving their left lateral chain and abduction/adduction control before retesting to aid in determining their efficacy.
The Individualized
There are often times when a test does not highlight what we may see in the field, and it leaves us scrambling for objective data that not only tells us if we are progressing, but also informs our decision-making on where intervention may make the greatest impact.
This is where Plantiga is a game changer.
I am going to give two brief case examples of Plantiga helping guide athletes’ training focus both in the gym and at the track.
1. Within Session Changes to Block Starts
Since a back injury, an elite-level sprinter (10.40 PB) has found it difficult to generate the power out of the blocks that he successfully had in the past.
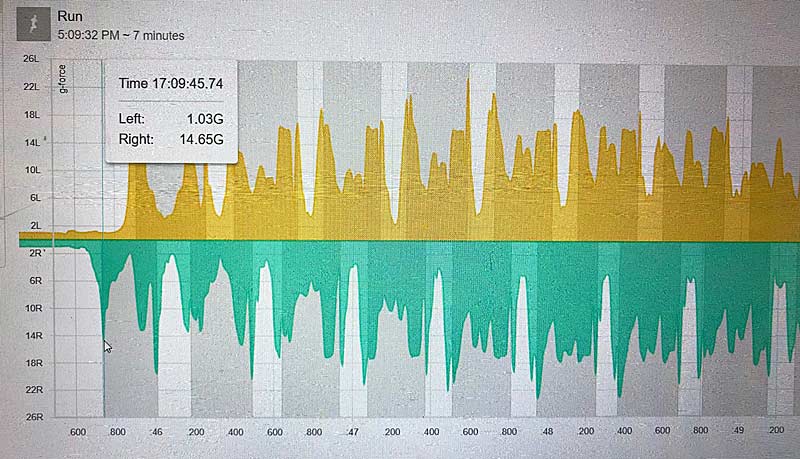
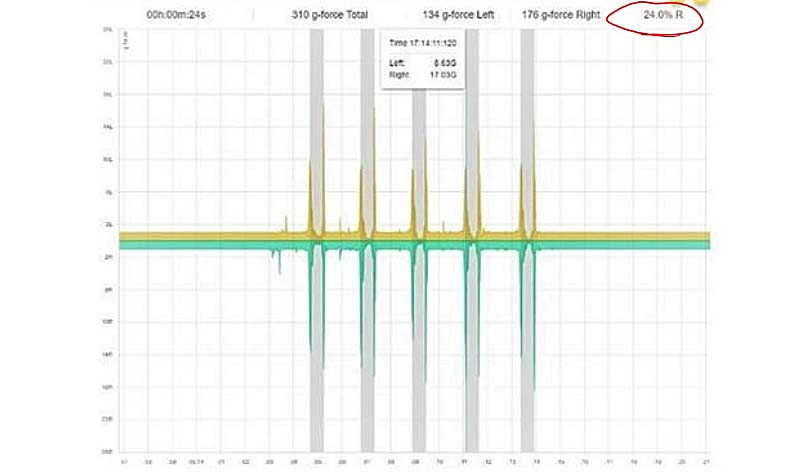
The above image highlights that the acceleration “out of the blocks” of the right leg (back leg in the blocks) was just 14.65G (unit of gravity).
Of interest are the grey areas indicating flight time of the limb, and consequently, the white shows when the limb is in contact with the ground.
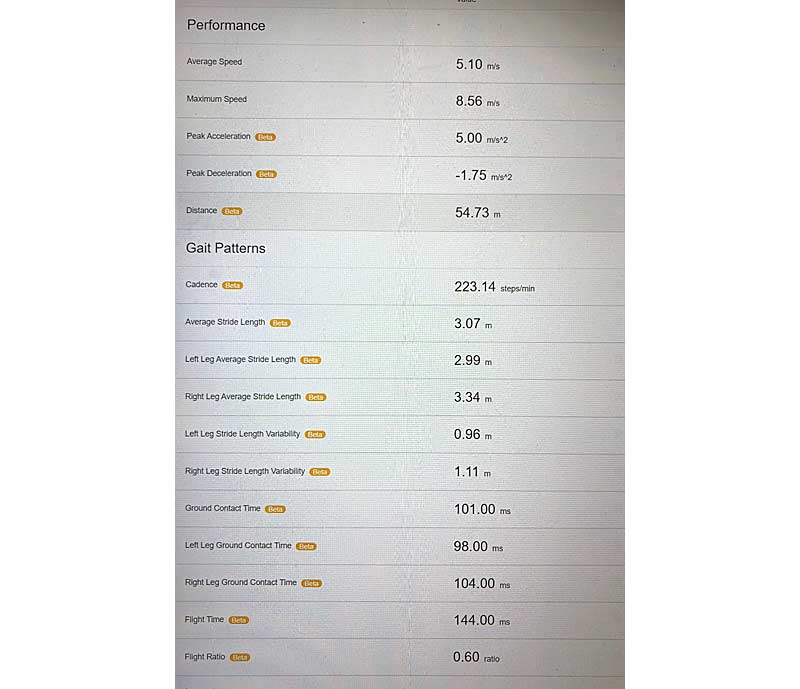
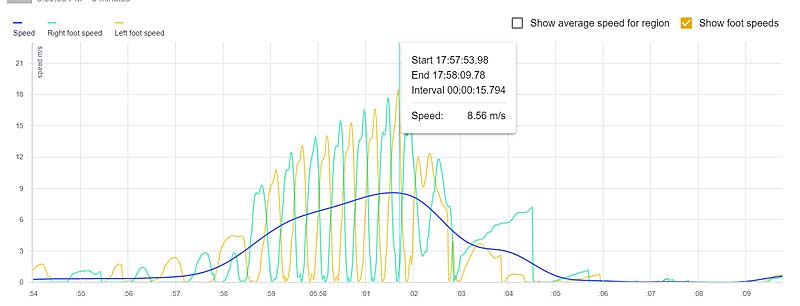
A review of this section is shown in image 8. However, due to the deceleration phase being present, only maximum speed (8.56 m/s), peak acceleration (5.00 m/s2) and ground contact time (98 milliseconds left, 104 milliseconds right) are truly of interest.
So, what did we do?
The intervention for this is not in the scope of this blog post. However, I have written previously for SimpliFaster on direction bias assessment and direction bias programming and utilized these methods within the session before testing again.
Reassessment
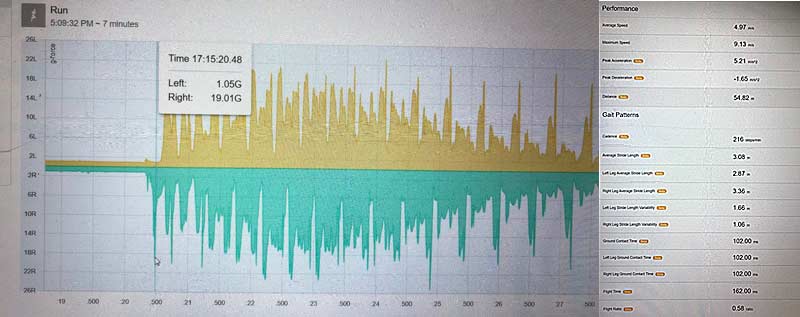
The athlete repeated the block start to 30 meters and obtained improvements to 19.01G on the first step (image 10a), maximum speed of 9.13 m/s (from 8.56%), and peak acceleration to 5.21 m/s2 (from 5.00 m/s2) (image 10b), and an improvement in load and ground contact time asymmetry from 9.80% to 4.88% and 5.77% to 0.00%.
While in this event it can’t be said that the intervention was responsible for the improvement, it does demonstrate the usefulness of Plantiga to the practitioner/coach at the track. Within a few minutes of testing, the baseline showed a large asymmetry to the right limb and the low acceleration observed at first step, which correlated with the athlete reporting that he “felt flat and couldn’t activate.”
An intervention based on past clinical assessment was supported by the objective data from Plantiga, indicating that it would be added to future warm-up protocols for the athlete’s sessions.
2. The Long Jumper
Plantiga was used with an elite long jumper (8.05-meter PB) to:
- Determine the forces exerted at takeoff and the penultimate step to aid in finding limits to gym programming.
- Compare force/load production between sides in a series of single leg bounds.
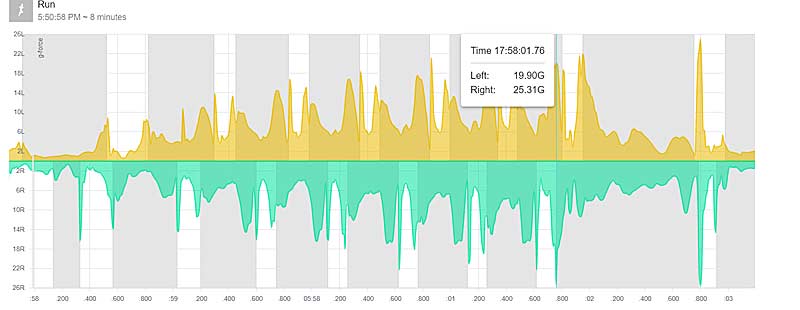
The data that we wanted to extract has been highlighted as 25.31G at the penultimate step and 21.94G at the left foot takeoff.
Bounding
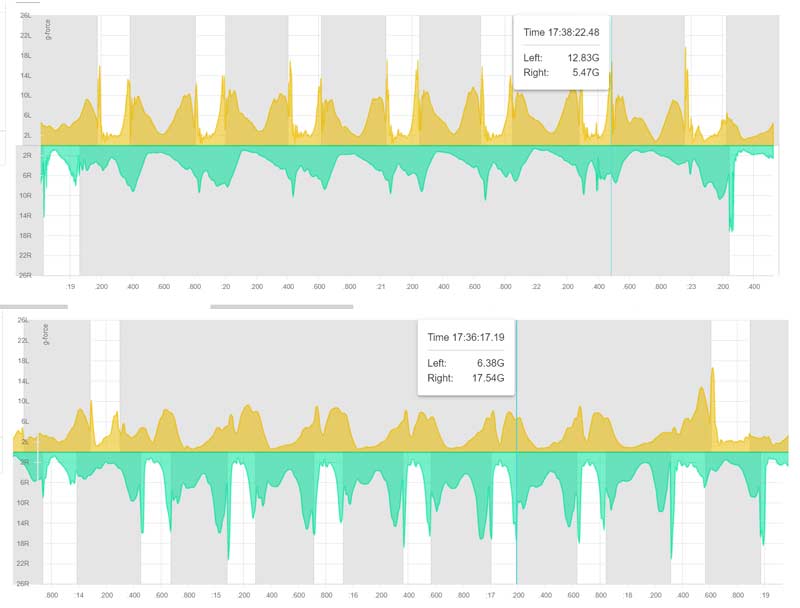
The grey areas indicating flight time of the non-involved leg clearly show which leg was not “hopping” in the activity but also demonstrate the amount of load still experienced by that side. By hovering the cursor over the end of each loading phase, we are able to measure the load created at toe-off of each bound. Figure 5 (top) shows that the fifth “hop” experienced at 17.54G compared to the example on the left in figure 5 (bottom) of 12.83G.
Furthermore, there was a “drop-off” in load on the left over the six hops in this example of 10.7%, from 14.2G to 12.83G (average 13.57G), compared to a 3.0% drop-off on the right 17.9G to 17.3G (average 17.62G). This indicates that the left was not able to create and absorb the same load as the right and showed less capacity over repeated hops.
This information is a great way to create a conversation with the strength and technical coaches to discuss program design for optimal loading and then follow it up with reassessment. From this example, we went on to discuss that bounding was not eliciting the same force as the last two steps of a long jump, so adding a weight vest or more depth jumps progressively would be considered. Additionally, more focus would be placed clinically on the left side’s readiness to load as well as on eccentric rate of force development.
Future Use
Plantiga in its current form has a wide scope of use in the ways that have been discussed but also in athlete monitoring in rehabilitation, return to sport, and return to performance scenarios. Load asymmetry can be tracked over time and, when tests are repeated in a standardized format, so can performance and overall load and intensity values.
The monthly subscription model to Plantiga essentially pays for itself with 4-5 assessments a month, making it within financial reach for most practitioners. Share on XFrom a financial point of view, clubs and individual athletes have been willing to pay for individualized testing of this research-grade equipment to give them insights on how to improve performance and reduce injury risk. Once satisfied, the athlete will return at important intervals (pre-season, pre-competition, or recent injury) to be reassessed for even deeper analysis. This shows that the monthly subscription model to Plantiga essentially pays for itself with 4-5 assessments a month, making it within financial reach for most practitioners. This in conjunction with its four-hour battery life, quick upload speed, unobtrusiveness, and portability, make it my favorite tool in and out of the clinic.
However, the really exciting part is what Plantiga is working on for the future. With its use of “deep learning” AI, it is collecting data on every test to not only improve its accuracy but also to start acting as a prediction tool for injury based on how the athlete moves. This is essentially the holy grail of sports medicine and just maybe it’s getting a little closer.

