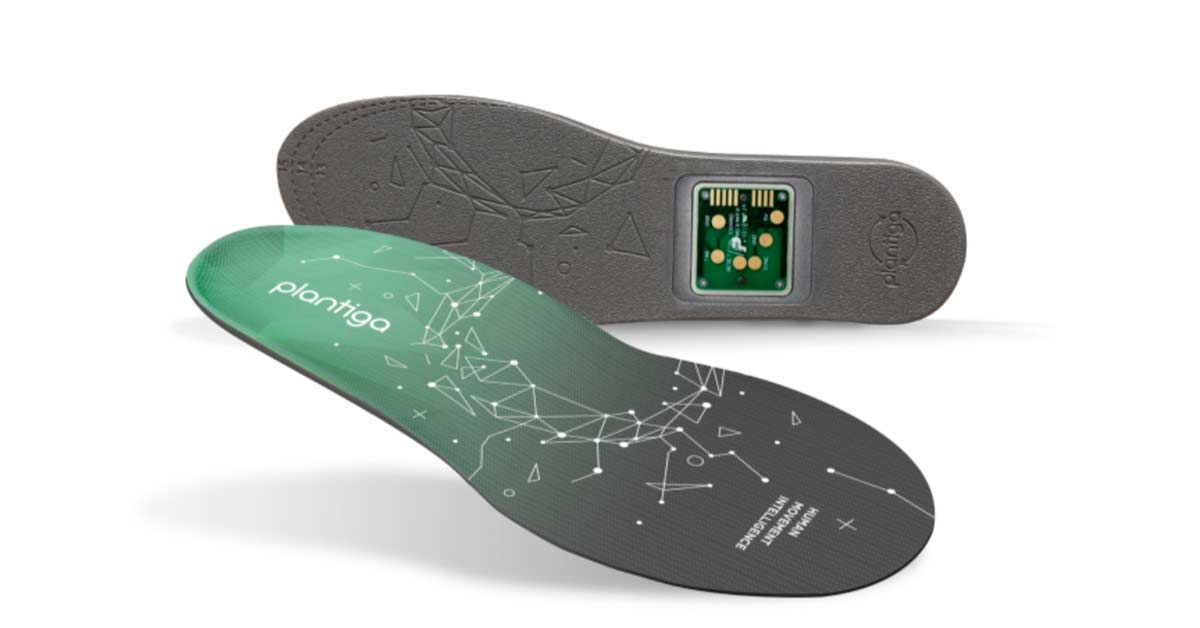
I wrote this blog post for SimpliFaster to provide an assessment of the various wearable technologies on the market focused on the smart shoe and smart insole. I provide a review of Plantiga below, present unpublished results of initial validation studies, and discuss the direction the company is taking.
It seems like the smart insole and smart shoe space is beginning to take off. The technology, including pressure mapping, has advanced rapidly. As you will see below, Plantiga places an inertial measurement unit (IMU) in an insole, but in addition to reporting what an IMU actually measures (acceleration, position, orientation), they use artificial intelligence (AI) to provide performance and health insights based on how we move.
In addition to reporting what an IMU actually measures (acceleration, position, orientation), Plantiga uses AI to provide performance & health insights based on how we move. Share on XWhy Measuring What Matters, Matters, and How Wearables can Help
I have been working in elite sport for more than 20 years. The early part of my career was hampered by technology. More specifically, I wanted to take a scientific approach to training, but measuring most of the physical strength capacities was largely out of reach (e.g., rate of force development (RFD)).
The second part of my career was underpinned by a desire to get better at quantifying the impact of my programming on the performance and musculoskeletal health of the athletes I worked with. It’s hard to measure the impact of coaching, but it’s important, and just because something is hard to do, it doesn’t justify not doing it.
After the Vancouver Olympics in 2010 and spending time working closely with Derek Hansen and our speed skating program, I picked up a cohort of female alpine skiers.
Injuries are common in skiing, especially knee injuries. I found that measuring things that matter, like interlimb asymmetries, was helpful for me in terms of quantifying functional recovery after injury. I was interested in identifying trainable deficits that I couldn’t see with my eye, so that I could write more targeted and individualized training programs.
In my experience, if we don’t measure, we might miss important physical deficits. And it’s important for us to bridge the gap between the laboratory and the “real world,” which really just means on the turf, grass, court, snow, or ice.
The Gap
The gap between what we do in a laboratory and on the field of play is vast. I’ve written on the problems with injury prediction from baseline testing.
How can a test conducted in September accurately predict an injury six months down the road?
How do we know that what we measure in the lab isn’t impacted by the Hawthorne Effect, where the simple act of taking a measurement changes the behavior of the system of interest?
Enter wearable technology.
Wearable technology allows us to take measurements on the field of play, where they matter most, says @JordanStrength. Share on XWearable technology allows us to take measurements on the field of play, where they matter most.
Where Is the Smart Shoe?
How is that we don’t have a wearable in our shoes or a smart shoe that can measure our movements and tell us about our health and performance?
I think the answer is that it is incredibly hard to measure movement with a wearable technology that is durable, can fit in a shoe, and can then provide relevant insights to the end user.
About Plantiga
Plantiga approached me in 2016 when I was just about to wrap up my Ph.D. I had been using dual force plates to measure interlimb asymmetries in jumping to identify deficits in athletes recovering from knee injuries.
At this point, I had limited experience with instrumented insoles. I had used the PEDAR system, and I had seen other types of insoles. But the problem was always the same—the technology was either too obtrusive or just too difficult to use to make it valuable.
We had done projects with our speed skaters and skiers using pressure mapping, but we never got past the first few data collection sessions. The athletes hated the insoles, and we couldn’t make sense of how to use the data in practical terms to change what we were doing.
I was interested in functional asymmetries at the time, especially for tracking recovery after injury, and the science suggested that sensors placed remotely on the body did a poor job of detecting asymmetries during running and jumping.1
There were companies that had placed wearables on the shanks or torso to measure lower-body movements, but there are distinct advantages to having the sensor in the shoe.2,3 The signal is cleaner and far less noisy, making event detection that much better.
When Plantiga contacted me in 2016, they were (to the best of my knowledge) one of the first companies trying to tackle the problem of a smart insole. What intrigued me was the ability to measure functional asymmetries outside of my laboratory.
About the Plantiga Technology
I was keen on Plantiga because it addressed the gaps mentioned above. Plantiga uses an IMU measuring 16 g’s per axis placed underneath the mid foot. The IMU is fixed into a small cavity of a thin and flexible insole. The IMU has another slot to expand to a second accelerometer so higher magnitude accelerations can be measured. This is in the product pipeline.
The mass of the IMU is 0.0175 grams per pod, and it measures 3.25 x 42 x 46 mm.
The IMU samples at 400 Hz, providing the type of high-fidelity data needed to derive short time frame biomechanical measures like ground contact time. Consequently, an inordinate amount of data comes in from a walk or run, and the original goal of a Bluetooth device did not give sufficient stability or reliability for transmitting data out in the field. Wireless data transmission was even more finicky.
The solution was to have onboard data storage, requiring the user to dock the IMUs after usage. But inside a single data collection or recording, the user can flag events of interest and run smaller test segments, allowing for better granularity in the post-testing analysis. I really like the tagging system, actually, because I can seamlessly flag different events of interest inside one single long-duration recording without having to stop the session.
The extra step of flagging events and activities of interest and then docking to upload data was key to bringing Plantiga up to the standard of a laboratory-grade measurement device. The bigger vision was to first tackle how to make Plantiga a research-grade tool, with the goal of scaling to the masses as a second step.
Additional considerations for the research-minded practitioner are that Plantiga allows the user to view and download the raw data and has a flagging and notification system for hardware failures. A much-improved web interface has just been released that includes a dashboard for reviewing data and generating PDF reports.
Plantiga lets a user make “teams” for data collection so they can run activities and tests on a large number of participants at the same time, says @JordanStrength. Share on XIn terms of Plantiga’s usability in individual and group settings, Plantiga lets a user make teams for data collection so they can run activities and tests on a large number of participants at the same time. Data can be collected concurrently throughout a session and then uploaded after training through a docking station. The new docking station in development does not require a computer connection.
Early Days with Plantiga
In the early days, Plantiga used analytical algorithms for event detection and reported the accelerations at the foot as a measure of mechanical workload. There were no major issues with this approach, as a lot of work went into sensor calibration and time synchronization. The acceleration at the foot measured with the Plantiga insoles provided a clean signal and lots of relevant information for the practitioner, like the interlimb acceleration asymmetry. A validation project examining the mechanical workload during running obtained with Plantiga showed a strong correlation with the internal workload measured through the sessional RPE method and heart rate.
Analytical algorithms are tricky for measuring movements, though, because they rarely account for the complexity that arises outside of a controlled laboratory environment. There are too many exceptions to the rules we devise on how people move. It also can’t drive the types of insights most practitioners would want to see for tracking either performance or recovery after injury.
While Plantiga started out with the goal of being a load monitoring device for team sports, it dovetailed quickly into the world of gait analytics and, importantly, as a tool to help practitioners monitor the recovery of their patients after sport injury using AI.
Plantiga’s Transition to an Artificial Intelligence (AI) Company
Under the guidance of Chief Technology Officer Sean Ross-Ross, Plantiga migrated quickly from analytical algorithms and workload monitoring to a data science company that uses a form of machine learning called “deep learning” to extract insights from the complex signal collected by the insole. Workload monitoring is still an important application of Plantiga, and I find this to be one of the most practical use cases of the system. The sensors are low-profile, can be worn in all types of footwear, and allow the user to track workload in a whole range of environments.
Workload monitoring is still an important application of Plantiga, and I find this to be one of the most practical use cases of the system, says @JordanStrength. Share on XHowever, I was very interested in the complexity coming from the Plantiga system. I was first made aware of the complexity of the signal through movement maps. A movement map paints a picture of the left limb versus the right limb during walking, running, and jumping (figure 1).
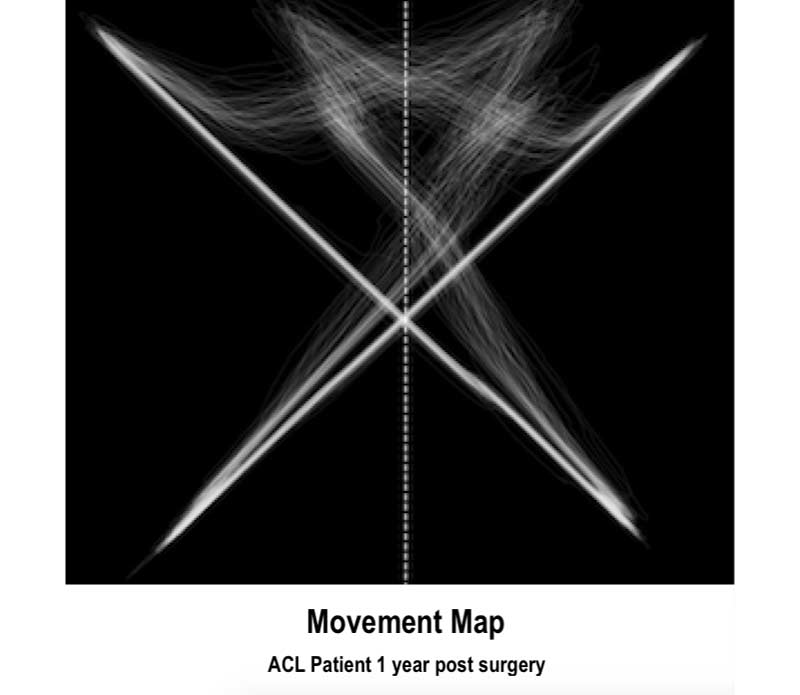
With his background in computer science and working at industry leaders like Tableau, Sean noticed right away that the complexity of the signal needed the type of deep learning that Google uses to distinguish a cat from a lion. These deep learning neural networks, called convolutional and recurrent neural networks, are adept at extracting features from complex images and data structures. Sean quickly pivoted Plantiga from a hardware company to a data science company focused on growing a human movement database that could be used to drive insights around health and performance.
This is not a trivial pursuit. Just like a human baby who enters the world dependent on its parents before it becomes a completely autonomous adult, a considerable amount of time and development is needed to grow an effective AI algorithm.
But then one day, a computer beats a human in chess, wins Jeopardy (rest in peace, Mr. Alex Trebek), and learns to drive a car. While there are well-known problems with AI—like bias, agnosticism, absence of morality, and inability to read context—it is well-suited for extracting insights from the type of movement data collected with the Plantiga insole system.
The combination of research-grade hardware and AI is what differentiates Plantiga’s trajectory from many of the other companies I have seen.
Plantiga Today
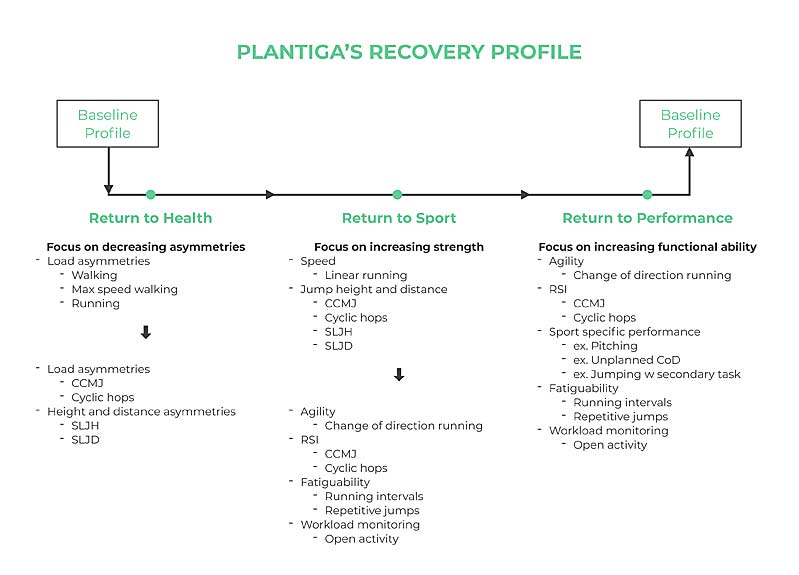
Today, Plantiga is a health and performance self-monitoring system. It measures Baseline Profiles and Recovery Profiles during walking, running, and jumping. It also allows the user to collect data in an Open Activity mode that is unrestricted. It can automatically detect walking, running, and jumping using a mode called Human Activity Recognition or HAR.
Users can perform bilateral jump tests, single-leg jump tests for height and distance, walk tests, and run tests, which output a suite of gait and jump metrics. AI drives the metrics coming from these tests. One of the algorithms, called GRIN (ground interaction), predicts when the foot is on and off the ground. This may seem easy, but I can assure you it is a lot harder than you would think.
Here is how the system has been validated. (Disclosure: There is still more work to be done here).
Participants (n=30) wore the Plantiga insole system and performed a series of vertical jumps on a dual force plate system (AMTI Accupower Force Plates, sampling at 1500 Hz). Running sprints were also performed on a Mondo track and on a treadmill at two different speeds.
In the first version of the GRIN algorithm, the data from the force plates was used as the gold standard to train the machine learning algorithm for measuring when the foot was on and off the ground. In the most recent version of the algorithm, the team at Plantiga has now progressed to using an additional reference point, including a generalized likelihood ratio test that predicts events of interest around the timing of the foot hitting and leaving the ground.
They have painstakingly gone through the training data set to ensure that the various features line up properly (i.e., a human has verified that in the training data set, things are as they should be). The second pass has greatly improved the accuracy of GRIN, and like all AI algorithms, the expectation is that GRIN will become increasingly more accurate with larger data sets.
The accuracy of Plantiga for detecting foot-ground interaction using GRIN is shown below in figure 3. This figure shows the reactive strength index (RSI) obtained from five consecutive countermovement jumps (CMJ).
The RSI can be assessed different ways, but it is typically reported as the vertical jump height to ground contact time ratio or the flight time to ground contact time ratio. RSI is most often measured in the vertical drop jump, and when the RSI is measured in the CMJ, it is referred to as the modified RSI.
Shown below in figure 3 is the percent measurement error for the first GRIN algorithm (left panel) compared to the second GRIN algorithm (right panel) for RSI measured as the flight time to ground contact time ratio in the consecutive CMJ test. Participants performed a series of consecutive CMJs with a variety of techniques and effort levels to help train and test the model.
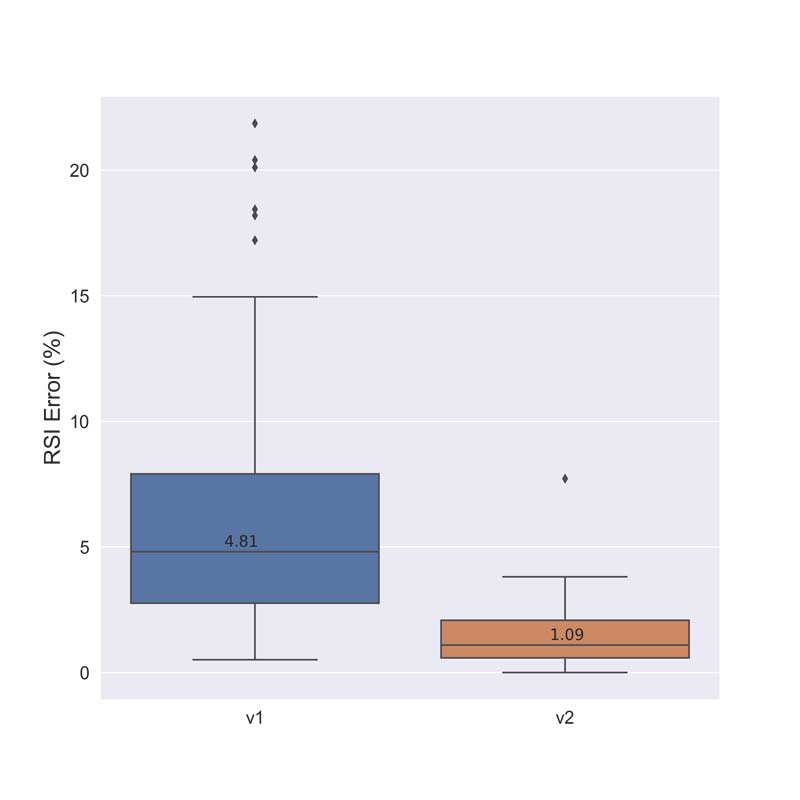
As you can see, the percent error in RSI measured with Plantiga compared to the gold standard force plate improved from 4.81% with the first algorithm to 1.09% with the most recent version. Notably, there are fewer outliers in the newest version. This speaks to the bench cases that GRIN had trouble figuring out initially, but with refinement were identified and corrected, leading to a substantial reduction in outlying values. This is the promise of AI and Plantiga—it gets better with time.
Figure 4 shows a strong correlation between RSI measured with Plantiga and RSI measured with a force plate alongside an improvement in the most recent version of GRIN (R2 = 0.99) compared to the first version of GRIN (R2 = 0.97).
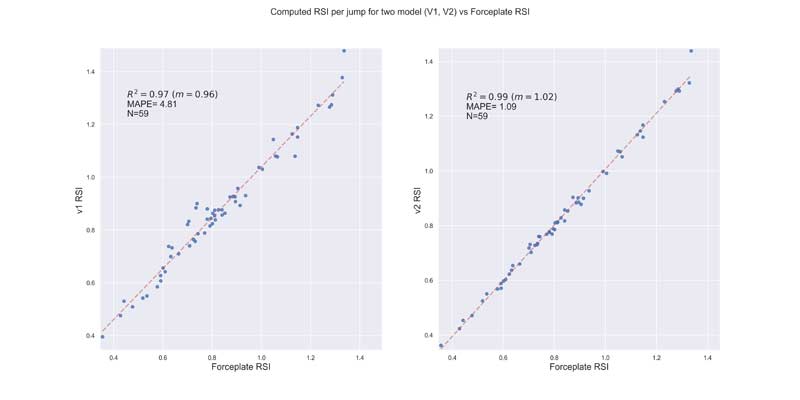
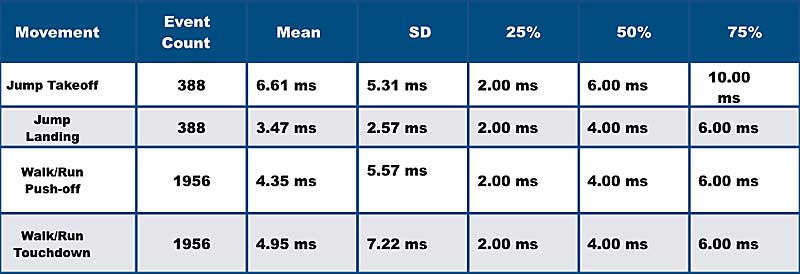
Table 1 shows the absolute difference in milliseconds of the predicted versus actual timepoint for takeoff/landing in the vertical jump and push-off/touchdown in walking and running. Notably, the mean measurement error ranged from 3.47 milliseconds in the vertical jump landing to 6.61 milliseconds in the vertical jump takeoff. The absolute measurement error for push-off and touchdown in walking and running were 4.35 milliseconds and 4.95 milliseconds, respectively.
Users may also be interested in the measurement error for ground contact time (GCT) in running. With the second version of GRIN, the absolute measurement error for GCT is 5.60 ± 5.80 milliseconds and the percent error is 1.95 ±2.10%.
However, an important limitation at the present time is that the data set used to train the running model did not include very fast runners or very slow runners. Also, GRIN has never seen world-class sprinters.
This is a critical future step for Plantiga. The database needs to grow to include very fast and very slow humans so that it can make accurate predictions across a broad range of scenarios. Just like the AI in a driverless car that may not be able to differentiate a green hexagon that says free cucumbers from a stop sign, the GRIN algorithm needs refinement for bench cases. This is part of the technology road map.
Nevertheless, today Plantiga’s AI approach solves lots of unique problems, including providing increasingly more accurate biomechanical gait measures and external load prediction (i.e., how much load someone carries on their body—like a heavy rucksack), and as you will see below, they are predicting the presence of movement patterns associated with injuries.
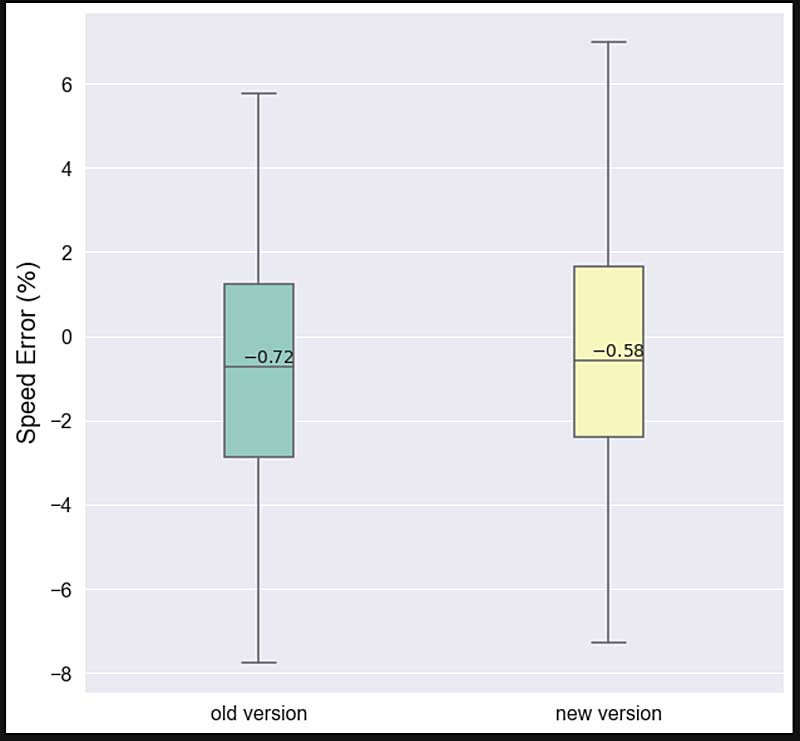
Today, Plantiga’s AI approach solves lots of unique problems, including providing increasingly more accurate biomechanical gait measures & external load prediction, says @JordanStrength. Share on XPreliminary speed validation appears promising (figure 5). Using the flying 30s performed by roughly 30 athletes and ex-athletes on a Mondo track measured with a Brower timing system, the average speed over 25- to 30-meter splits was obtained. The subsequent speed from the Plantiga system over the same time intervals was then obtained.
As shown below in figure 5, the mean percent error was 0.72% using the first version of GRIN and 0.58% with the newest version. It should be noted that a Brower timing system is not considered a gold standard measure of running speed, and average speed through a 5-meter split may not address all use cases, but it gives an indication of the accuracy of Plantiga’s speed algorithm.
However, as stated above, Plantiga needs to expand their training data set to include very fast runners to improve the accuracy of the speed algorithm with future iterations of GRIN. As we have seen with RSI, GRIN does have the potential to become more accurate as the database grows, and Plantiga has been amenable to working with their partners to improve functionality in specific ways.
Future Steps
In addition to the future plans to improve GRIN, here are a few areas that Plantiga is looking to address in 2021 and beyond:
- Improve the web interface to enhance the user experience.
- Provide user alerts that are based on an n=1 approach—basically, this means alerting the user when something has changed according to a baseline profile.
- Improve hardware stability including extending battery life.
- New technology that eliminates the need for docking.
- Partnership with orthotic and insole companies so that users can purchase customized insoles.
- Designing smaller and lighter sensors.
However, I am most excited about how Plantiga will use AI to help with primary and secondary injury prevention—this is the Plantiga Baseline and Recovery Profile.
The Recovery Profile is in development and will be used for post-injury management to help guide return to health, return to sport, and return to performance. Here, GRIN allows the user to obtain interlimb asymmetries in a variety of time and spatial gait parameters. Asymmetries of interest include stride length, stride time, ground contact time, limb speed, and flight time. Measures like limb speed and stride length require validation, and they are a beta release.
But a really novel and exciting algorithm in development is called the Plantiga Injury Score. Plantiga is developing a machine learning model that can predict whether our movement patterns look like someone who is injured. This can complement the various biomechanical measures coming from GRIN to allow a practitioner to gain insight on an athlete or group of athletes to determine who might have a hidden functional deficit.
Plantiga is developing a machine learning model that can predict whether our movement patterns look like someone who is injured, says @JordanStrength. Share on XTo me, interesting applications of the Plantiga Injury Score include:
- Remote monitoring of patients and athletes.
- Movement assessments for those of us who provide online programming.
- Monitoring an injured athlete in their hometown as they work with their own performance team.
- Monitoring in harsh environments like during military training.
- Self-monitoring for the active individual who wants to optimize their health and avoid injury.
- Identifying functional deficits in a cohort of athletes who are being evaluated for the first time.
Using Plantiga to track my own personal training—including running, heavy bag workouts, and tempo run sessions—has been great because, at least on an anecdotal basis, changes in my gait metrics and asymmetry profile such as the left versus right workload asymmetry have lined up with the occurrence of few overuse injuries and my overall effort level.
I have had the occasional hardware issue, but these have mostly been a result of a pod not fully charging. It’s been great to get a call from Plantiga after a session when there has been a hardware error to let me know how to troubleshoot. I also find the new web app to be a massive improvement over the previous version. I use Plantiga more often because I can easily record activities and find what I need.
I have used other apps to measure my run distance and speed, and so far, Plantiga appears highly consistent with these measures. I find it valuable to track my running and outdoor workouts in a more detailed manner. Not only can I track my speed and distance but also my biomechanics. I have even used the occurrence of an aberrant asymmetry score to modify a planned training session and introduce more mobility and tendon strengthening in a proactive manner. (I suffer from the occasional bout of Achilles tendinopathy.) Feedback from Plantiga is changing my behavior.
In closing, Plantiga is an AI company that measures how we move to drive insights on our health and performance. Plantiga measures performance in running, walking, and jumping through a suite of biomechanical metrics. Plantiga also provides interlimb asymmetries across all their measures that can be used to identify functional deficits, and they are working on an AI algorithm that can predict the presence of a movement pattern associated with an injury. Validation is under way, and while there is more work to be done, Plantiga appears to hold a lot of promise to measure what matters in the real world, where it matters most.
Since you’re here…
…we have a small favor to ask. More people are reading SimpliFaster than ever, and each week we bring you compelling content from coaches, sport scientists, and physiotherapists who are devoted to building better athletes. Please take a moment to share the articles on social media, engage the authors with questions and comments below, and link to articles when appropriate if you have a blog or participate on forums of related topics. — SF
References
1. Kenneally-Dabrowski, C.J.B., Serpell, B.G., and Spratford, W. “Are accelerometers a valid tool for measuring overground sprinting symmetry?” International Journal of Sport Science & Coaching. 2017;13(2):1-8.
2. An, W.W., Au, I.P.H., Cheung, R.T.H., et al. “Shoe-mounted accelerometers should be used with caution in gait retraining.” Scandinavian Journal of Medicine and Science in Sports. 2019;29(2).
3. Zrenner, M. Küderle, A., Roth, N., Jensen, U., Dümler, B., and Eskofier, B.M. “Does the position of foot-mounted imu sensors influence the accuracy of spatio-temporal parameters in endurance running?” Sensors (Switzerland). 2020;20(19):1-21.

