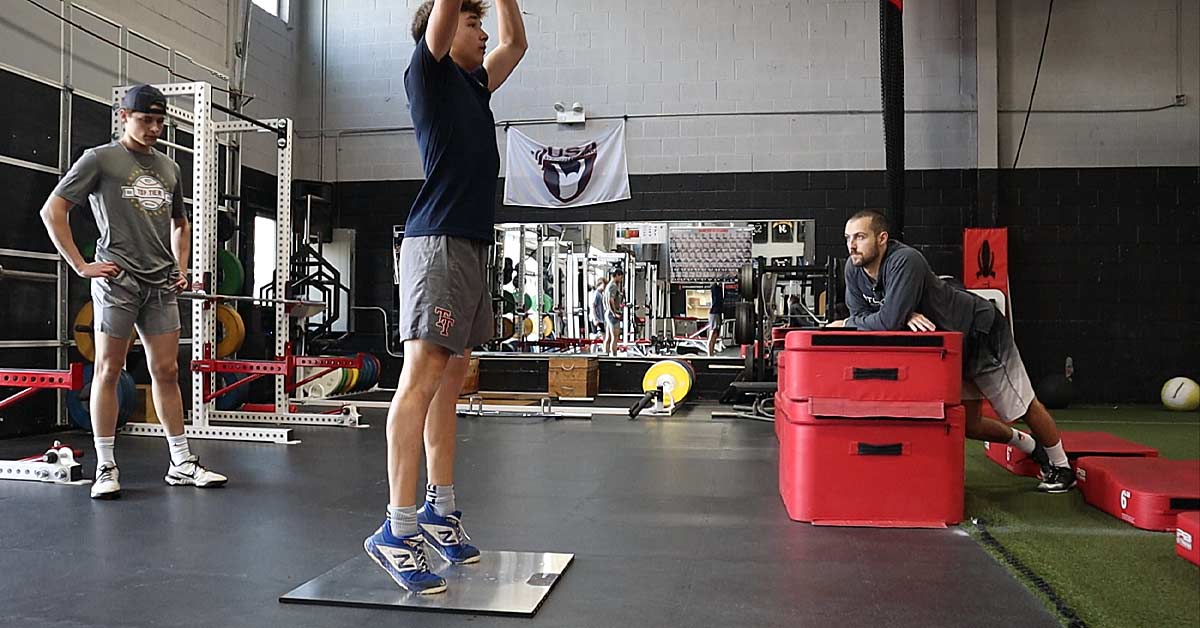
Athlete readiness is a popular topic: can we use tests to collect data to gain insight into an athlete’s physical state, ultimately helping make decisions and modifications (if any) about the training later that day? The thought is that these modifications will help maximize what the athlete is truly ready to handle that day, whether it be doing more, doing less, or simply providing reassurance to stay the course.
These optimized days then add up over the course of a training microcycle, mesocycle, and macrocycle to produce even better results. But what test is simple, repeatable, and engaging for athletes to perform and trackable consistently over time? The vertical jump.
Here’s the logical framework connecting sprint readiness to jump readiness:
- Ninety-five percent of an athlete’s best sprint is fast enough to cause speed gains.
- How often do athletes hit 95%, and are they ready for a high-intensity speed training session? Around 13% of the time, they are UNDER 95%.
- What is a similar threshold for vertical jumping?
Coming from famous speed coach Charlie Francis and endorsed by many others, we know that 95% of an athlete’s best sprint time or faster is a high enough intensity to cause speed gains.
Anecdotally, 95% is a good threshold that lines up with an athlete’s readiness to train that day…to perform high-intensity speed training. But how does 95% line up for vertical jumping? Share on XAnecdotally, 95% is a good threshold that lines up with an athlete’s readiness to train that day—the data I’ve collected shows that my athletes are only under that number around 13% of the time. This means, on average, in almost nine of every ten speed sessions, my athletes are ready to perform high-intensity speed training. But how does 95% line up for vertical jumping? Should that number be higher or lower? How often are athletes below it?
Athletes and Data Collection
From the data I collected at TCBoost Sports Performance, I used measurements from 42 athletes (33 males and nine females; 37 high school athletes and five college athletes). The criteria to be included in the vertical jump analysis was at least 10 vertical jumps. The criteria to be included in the combination jump and sprint analysis was at least 10 sprint times, and of those 10 times having at least five days of both a vertical jump and a sprint time (fly 10 or 5–15 acceleration). Thirty-four athletes had at least five days of both a vertical jump and fly 10, 30 athletes had at least five days of both a vertical jump and 5–15, and six athletes had at least five days that included a vertical jump, fly 10, and 5–15.
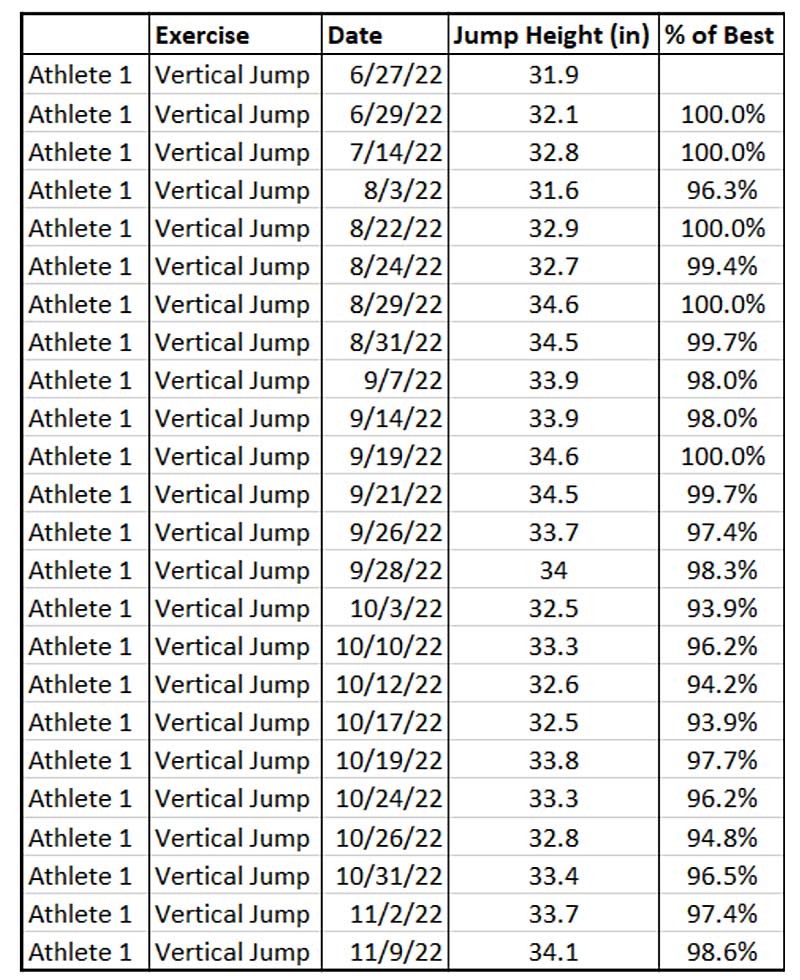
In total, from the 42 athletes, there were 868 daily vertical jumps used for analysis. Of those jumps, 826 were assigned a percentage of that athlete’s best (as everyone’s first daily jump can’t be compared to their best).
Of the 34 athletes who had at least five fly 10 times on the same day as a vertical jump, 519 fly 10s were used for analysis. Four-hundred eighty-five of those sprints were assigned a percentage of that athlete’s best. Of the 30 athletes who had at least five 5–15 times on the same day as a vertical jump, 483 5–15s were used for analysis. Four-hundred fifty-three of those sprints were assigned a percentage of that athlete’s best.
Jump and Sprint Analysis
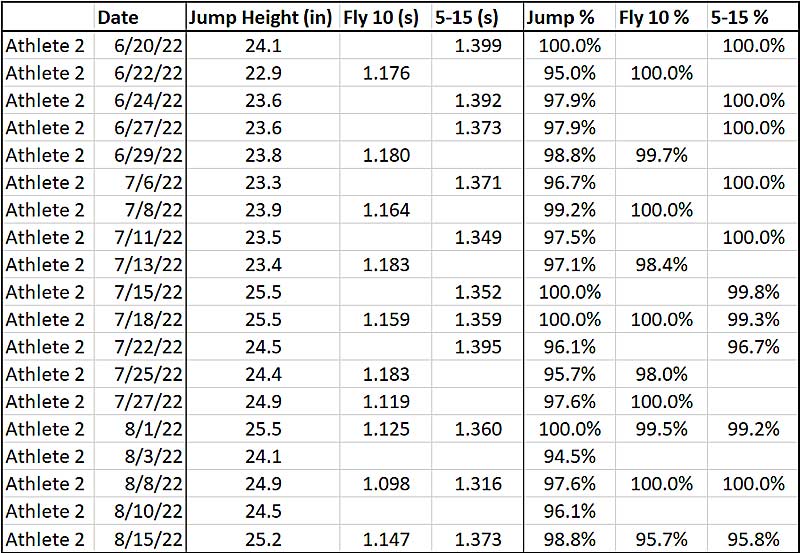
Since the premise of this article and analysis is what we know about Charlie Francis’s 95% threshold and my previous data, we need to compare the sprints and jumps. The first thing to note is the larger variability between daily jumps and sprints. Vertical jumps were much more inconsistent, with the average of an athlete’s best to worst jump varying by 16.6%, while the fly 10s and 5–15s only varied by 9.0% and 7.1%, respectively.
Note the larger variability between daily jumps and sprints. Vertical jumps were much more inconsistent, says @CoachBigToe. Share on XA few speculations as to why this could be:
- Jumps were performed at the end of the warm-up, so the athlete might not have been truly warmed up.
- There is a technical component to landing with a flat foot as opposed to toes first that affects the reading on a jump mat.
- “Newbie gains” might be easier to attain in jumping than in sprinting.
Regardless of the plausible explanations, this means there might need to be more flexibility or a larger range when determining a sufficient range for daily vertical jumps.
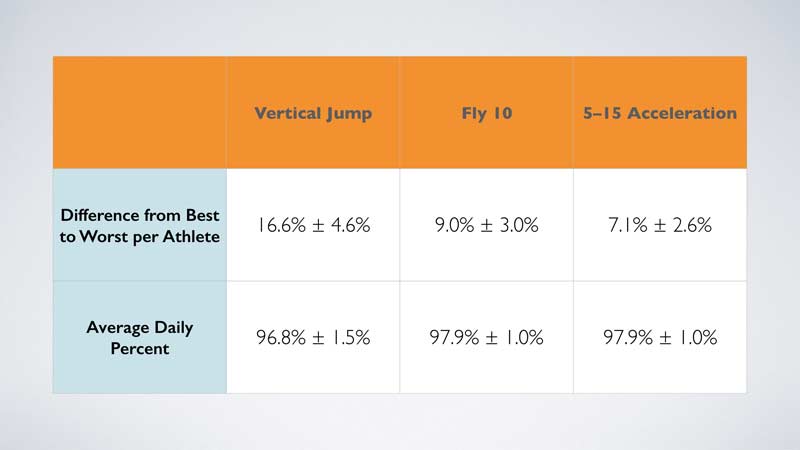
Next, the average daily percentage for vertical jumps (96.8%) was lower than that of sprinting (97.9% for both fly 10 and 5–15). This could be due to the factors mentioned above and just overall greater variability in vertical jumps.
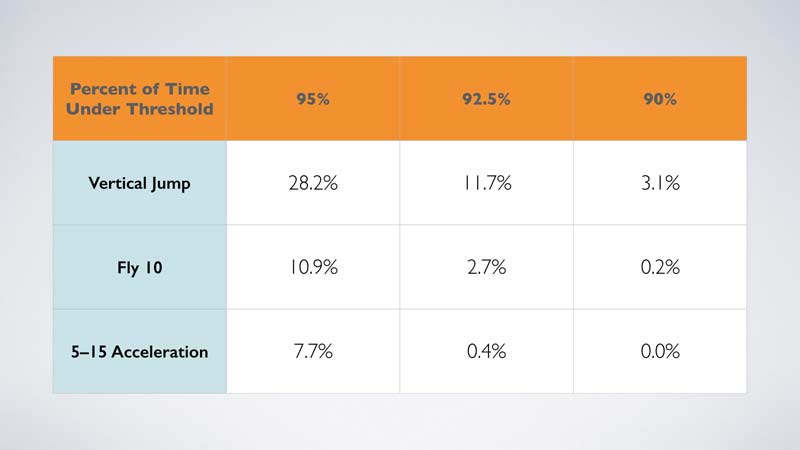
Now that we know jumping is more variable and measures at a relatively lower percentage of an athlete’s best on a daily basis, how does the 95% threshold look as a gauge of readiness? From previous data, athletes sprint under 95% of their best around 13% of the time. However, it is important to note that middle school athletes were discussed in that article, and this data set was for high school and college athletes.
Clearly, 95% for daily vertical jumps is too high of a percentage, as athletes were under that almost 30% of the time. For a threshold that yields the athletes being under it closer to 10% of the time for both sprint tests, as shown below, it appears 92.5% is a suitable mark for vertical jumps. Athletes only jumped under 92.5% of their best 11.7% of the time.
Lastly, it is important to determine whether these measures were related. Can we make decisions solely based on jump data if it’s very related to and predictive of sprint performance? Believe it or not, when athletes had both a vertical jump and sprint time on the same day with a calculated percentage of their best, they were not correlated. There was no correlation between the daily jump percentage and daily fly 10 percentage (0.190), daily jump percentage and daily 5–15 percentage (0.144), or daily fly 10 percentage and daily 5–15 percentage (0.354).
Believe it or not, when athletes had both a vertical jump and sprint time on the same day with a calculated percentage of their best, they were not correlated, says @CoachBigToe. Share on XThis makes sense, as although they are both explosive athletic movements, they are different skills and movement patterns. Since sprinting and becoming faster is the foundation of speed and power training, daily sprint percentage will be the primary indicator of an athlete’s readiness and consequent decision-making (if any). However, because jumps and sprints are not correlated, jump readiness can be used as a quick snapshot to create context and open up a conversation with an athlete about how they’re feeling.
Limitations
Here is my commentary on why vertical jumps may be more variable than sprints, why vertical jumps were not correlated to sprint times, and the overall limitations of this data:
Technology. This data spans two different jump mats and two different timing laser systems. The MyJump Just Jump Mat was used from October 2020 to February 2022, and the Swift EZE Jump Mat was used from February 2022 to November 2022. VALD SmartSpeed lasers were used for most of this data collection, with Swift lasers being mixed in intermittently.
- Because jump mats measure jump height by flight time, athletes can improve their scores simply by learning how to perform the jump more proficiently (with the whole foot touching the ground on the landing, as opposed to landing on the toes first). This could be reflected as “newbie gains,” but really, it is learning how NOT to do the test incorrectly.
Focus. Part of the reason vertical jumps are in the discussion for a plausible daily readiness measure is the simplicity of the test. Consequently, it may be easier for athletes to complete a vertical jump haphazardly when compared to a timed sprint.
Placement in the workout. An overwhelming majority of this jump data was collected at the end of the warm-up before the main workout of the day. Consequently, the athletes might not have been completely warmed up by the time the jumps were measured. On the flip side, athletes were much more likely to have truly been ready to sprint at 100% after a warm-up, jumping, and sprint drills. However, to gather the most reliable data, you should always collect jumps at the same place within the workout. Each option of jump placement will have its pros and cons; just be sure to keep it consistent when tracking over time.
Data in database. There could be a gap in the data based on whether it was entered into the database or not. Between myself and the four other coaches at my current facility, I cannot assume every sprint and jump was entered for every athlete over this two-year span. The athletes and groups that I coach had more data entered. For example, if I coached a group of athletes on Mondays when we mainly do 5–15s, and another coach had that same group on Wednesdays when we mostly do fly 10s, there could be a gap in the fly 10 data.
Training goals. Although we train our groups concurrently, private athletes have different and specific training goals. Data analysis included both group and private athletes. For example, sprint percentages over time could look much different when comparing a group of athletes who focus on sprint development to a private volleyball player who mainly focuses on jump development.
Population. This data did not include middle school athletes. Middle school athletes are much more inconsistent and jump much lower, which leads to huge relative variations in daily jumps. The 21 middle school athletes who met the vertical jump criteria varied by 18.8% ± 8.3%, which is much more variable than the high school/college athletes’ 16.6% ± 4.6%. However, this was also reflected in the decreased time under 95% for the sprint times of 10.9% and 7.7% compared to the previous article’s 13.0%.
Looking at 92.5% for Vertical Jumps
A daily vertical jump measure of readiness makes sense in most populations due to the test’s simplicity, feasibility, and practicality. With what we know about daily sprint times and comparing it to an athlete’s previous best relative to the Charlie Francis 95% threshold, 92.5% for vertical jumps may be a more realistic threshold. This is NOT to say that jumping 92.5% is a good jumping stimulus and will consequently lead to jumping improvement (which is the foundation of the 95% sprint threshold). This IS to say that if we use 95% for sprinting as an insight into how the athlete is feeling that day and their readiness to do high-intensity training for sprinting and power development, then 92.5% is similar for jumping.
If we use 95% for sprinting as an insight into how the athlete feels that day and their readiness to do high-intensity training for sprinting & power development, then 92.5% is similar for jumping. Share on XThis lower threshold makes sense, as there is a greater percentage of variation for vertical jumps on a daily basis when compared to sprinting. However, we also know that jump and sprint percentages are not related and, consequently, cannot be used in place of one another. Each readiness test will serve different purposes for you as a professional. Because sprints are more physically demanding to perform, more consistent of a measure, and the most specific test, let them be the main indicator of readiness and consequent decision-making.
The vertical jump is a simple exercise that can be used to start the conversation about daily readiness. This is not to say that as soon as the athlete jumps under 92.5%, you should abandon the plan for that day; it just means to investigate further and come to a consensus plan to help maximize the training that day for the athlete.
Since you’re here…
…we have a small favor to ask. More people are reading SimpliFaster than ever, and each week we bring you compelling content from coaches, sport scientists, and physiotherapists who are devoted to building better athletes. Please take a moment to share the articles on social media, engage the authors with questions and comments below, and link to articles when appropriate if you have a blog or participate on forums of related topics. — SF

