With a heavy calendar and very little downtime to train, finding the balance between strength and conditioning training and tactical training is not always easy.
The good ol’ days of torturous training camps are well behind us. We are more conscious about our players’ health, and injuries during pre-season camp is certainly not what we hope for–especially not for the sake of proving a point. So after hard off-season training, is there a way we can establish a reliable and safe baseline for our athletes without risking injury?
As we enter a new season with multiple athletes and sometimes many new faces, our time is limited. Processes to create baselines must be easy to implement and fast at giving us the pertinent information we need. Establishing a program that allows for each athlete to retain current physical and cognitive capacities is very difficult. But it’s a lot easier with solid data.
In-Season Fatigue Profiling: How to Create a Reliable Baseline
A reliable baseline is imperative for a coach to individualize an action plan and use the plan for monitoring an athlete. Are a 1RM and a vertical jump reliable enough to manage fatigue? It can help and can be part of the equation. But sport is about momentum and velocity.
It’s important I know as much as possible about my athletes. I’m interested in five main categories: speed, power, strength, endurance, and lower limb balance. And I attribute a different attention to the components depending on the sport and position.
Speed
First, I divide speed into multiple components, since different sports and positions have different needs. They go as follows:
- Peak Speed
- Time to reach peak speed (acceleration)
- Time to reach peak power (how fast one can deploy peak power)
- Cognitive speed, reaction time
Peak Speed
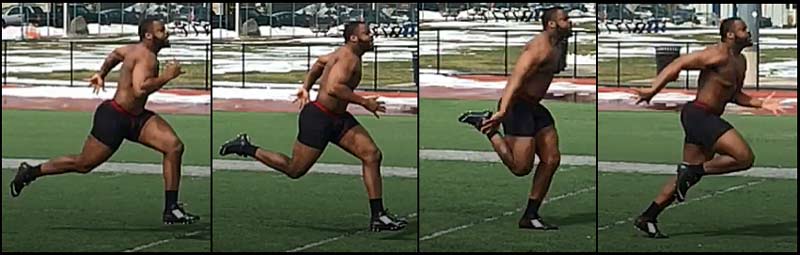
For some applications, peak speed is important data, but maximum velocity in a straight line is rarely achieved in most team sports. I still like to have this data, though, because it reveals important information. A noticeable loss of peak speed may indicate exhaustion or overtightening of hip flexors or hamstrings, leading to possible injuries. The data also helps with post-injury return-to-play protocols.
Acceleration
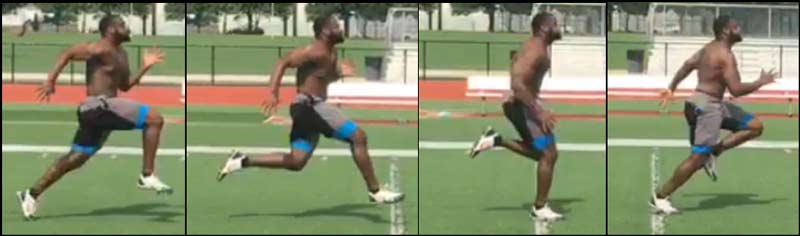
Time to reach peak speed (acceleration) is a must-have for baseline data. Most sports are defined by the capacity to accelerate and build momentum. Following the evolution and the variability of this aspect is very important.
Peak Power
For some positions, like football linemen or the front row in rugby, I want to know the speed with which they can deploy peaks amount of power (time to reach peak power). This defines their ability to efficiently deploy the first power steps so in power sports.
Monitoring peak power outputs throughout the season is a primary concern because it directly affects all other performance parameters. A significant decrease in this number will negatively affect overall speed and all the averages associated with conditioning parameters. I’ve learned through experience that a significant loss of power on a five-burst assessment is enough to raise a flag and I should start looking more in-depth for issues.
Cognitive Speed
And what about cognitive speed? If our athletes can’t process information fast enough, their physical capabilities may not be useful. This component of speed is measurable and quantifiable, and it must be part of the baseline; mental fatigue is certainly a concern throughout the season.
I also like to incorporate the vertical jump. I use the jump mat for this. I’m not concerned about how high an athlete can jump because it doesn’t necessarily represent how well they can accelerate. It is valid data, though, for monitoring fatigue and return-to-play protocols.
Strength
I want to know upper and lower body maximal strength. Again, different sports and different needs, but knowing that my athletes can retain a decent level of strength throughout the entire in-season is an important factor for success.
Endurance
It’s great to know how fast, strong, and powerful my athletes are, but can they sustain repeated bouts of exertion without losing efficiency? Can my football player repeat 60 snaps at full capacity? Or is he losing important speed and power after only 20 snaps? The ability to reproduce full momentum in a specific energy file is measurable; that’s why it is part of my baseline.
Lower Limb Balance
Finally, it’s important to know if our athletes remain balanced throughout the different phases of the baseline acquisition. Some look very well balanced during acceleration, but through repeated bouts, fatigue often reveals inconsistencies.
Sometimes an athlete shows significant imbalances on the take-off, indicating poor weight transfer on the ball of the feet. This scenario occurs regularly even with the highest level athletes. This condition is impossible to detect with the naked eye and has great negative impact on performance. It’s also indicative of possible injury, as the overused side will eventually not sustain the extra forces applied. A simple mechanical correction on weight distribution and gait control can fix this. But we can’t fix it if we can’t measure it.
Interventions: Combining Strength Training Testing and Speed Data
I mentioned that a baseline must be easy and quick to implement. According to the list above, however, it looks complicated and difficult. It isn’t. I’ll show you how I get it done and how the numbers become my assistant coaches.
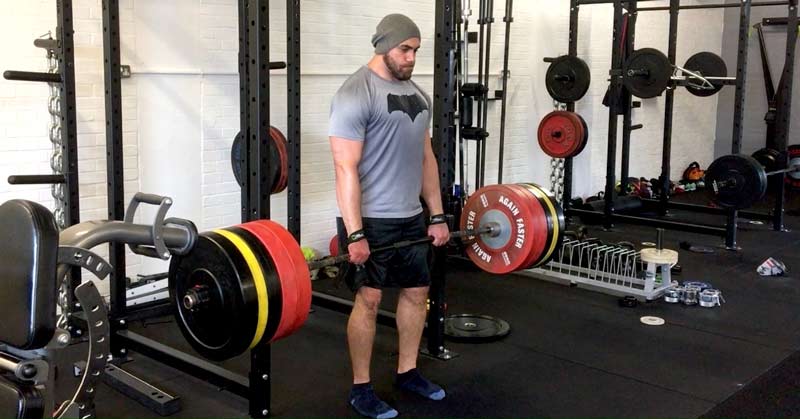
First, I love strength and big lifts; maintaining strength throughout the season is extremely important. Strength is the foundation of power and speed, so it’s a must keep. The squat, the deadlift (and their variations), and the big rows and pulls will always be part of my game plan. I use them in a calculated way, and I use them a lot.
I used to always conduct a 1-3RM evaluation period. Although I never had an incident happen during those periods, the high physical demands of most pre-camps made me reconsider. The intent behind a test day is to establish a starting point to build a strength curve and establish force-velocity ratios. In my quest to be more time efficient, it made sense to simply work with all the information I already have.
For the athletes who I follow during the off-season, I have solid data and reliable information. This means I can build an individualized plan of action for them.
For the athletes whom I don’t know, I do two things. If I have advance notice that they’re coming, I’ll reach out to them and their strength coaches and ask for numbers on specific lifts. I’ll build a progression off those numbers. I stay more conservative on the prescribed loads as I want to make sure I’m satisfied with the athlete’s technique and execution.
What about athletes whom I know nothing about? This is when technology becomes my best friend. We have very little time for trial and error–especially not errors. We all know that strength is required for power and speed. And we know that our strongest athletes are not necessarily our most powerful or the fastest. In other words, their strength doesn’t always transfer well. This is why I want to spend more time on evaluating speed, power, and acceleration.
The great thing about being a strength coach today is that we have technologies enabling us to be better at what we do. It doesn’t matter anymore if an athlete benches or squats a ton of weight if it doesn’t transfer to the task they have to perform.
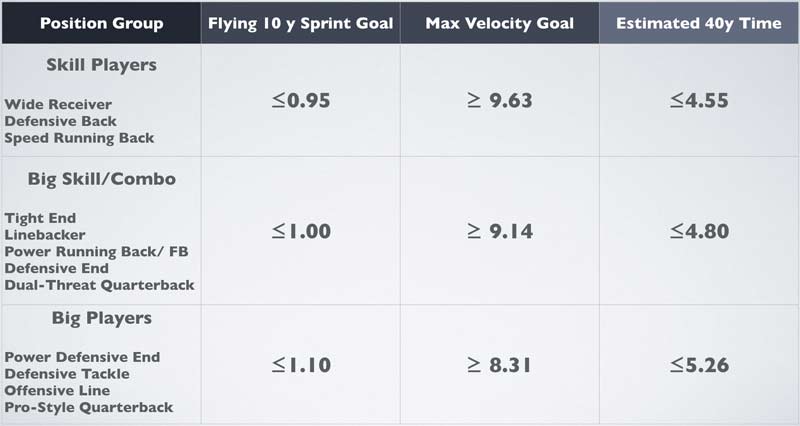
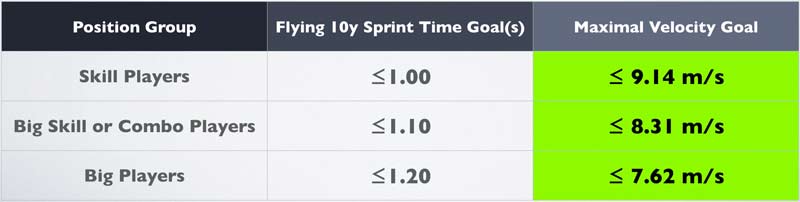
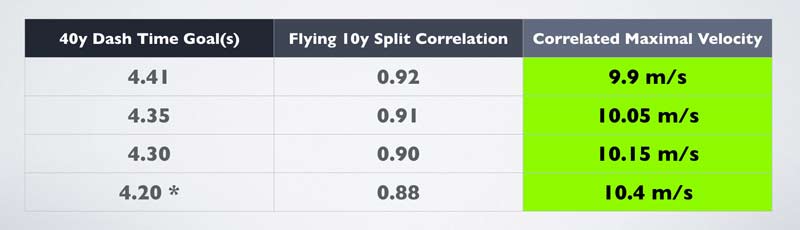
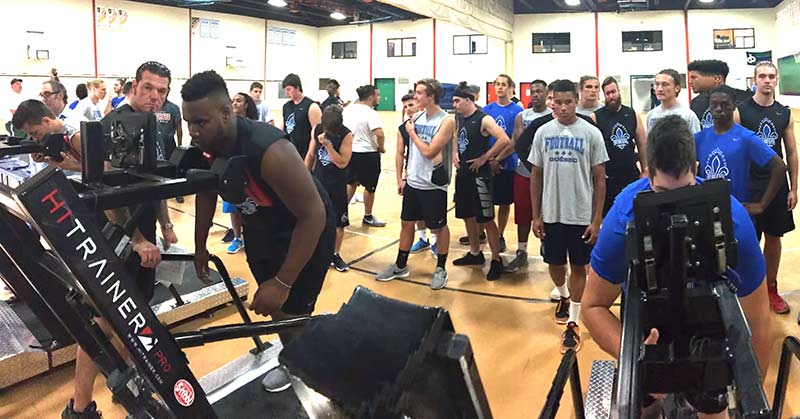
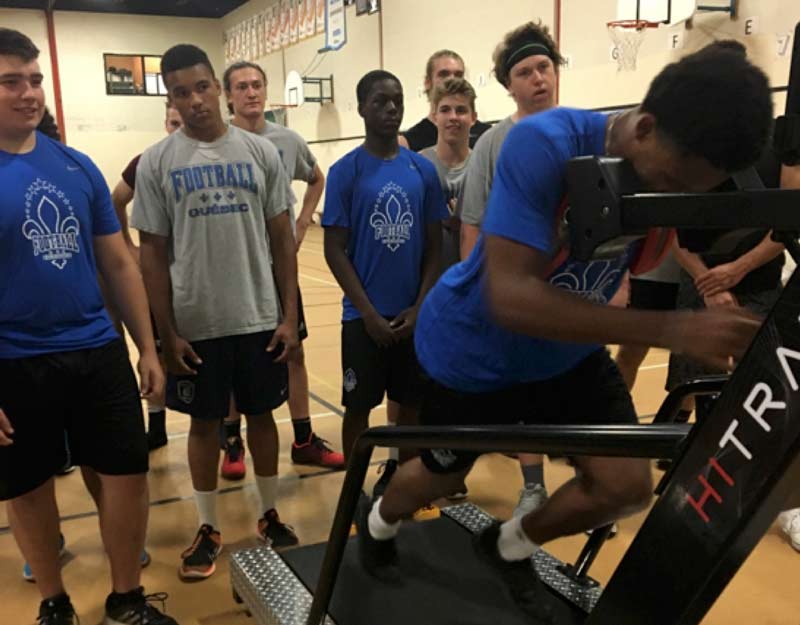
How can we establish what is sufficient speed or power or the combination of both? I use the HiTrainer to create very accurate portraits of my athletes.
I like to call this tool the “human dyno”–it’s incredibly efficient and versatile. In a matter of minutes, this self-propelled treadmill equipped with load cells and high precision tach collects all the data mentioned earlier.
The baseline protocol is very simple and fast. The athlete runs a total of five 20-yard sprints and five 5-meter sprints (total of less than 30 seconds of work).
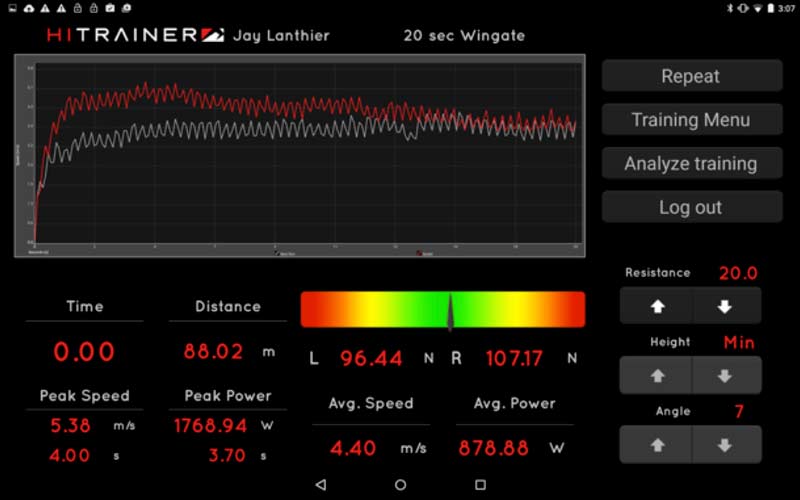
It collects the data in real time: peak speed, time to reach peak speed, peak power, time to reach peak power, as well as lower limb balance throughout each run. It also provides all averages for each component.
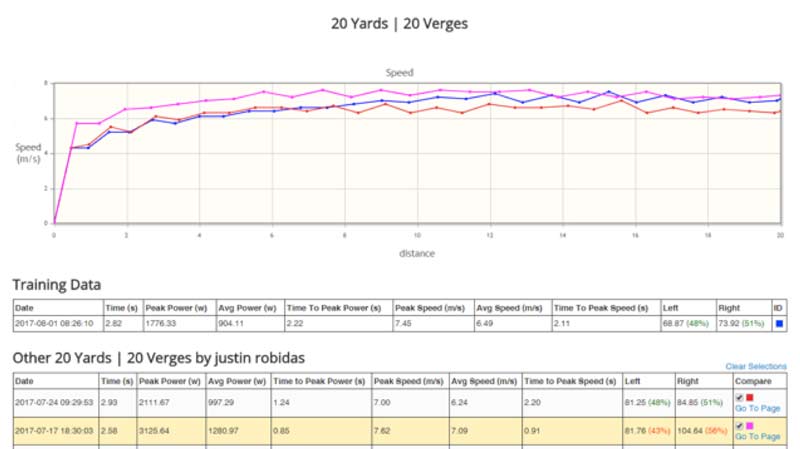
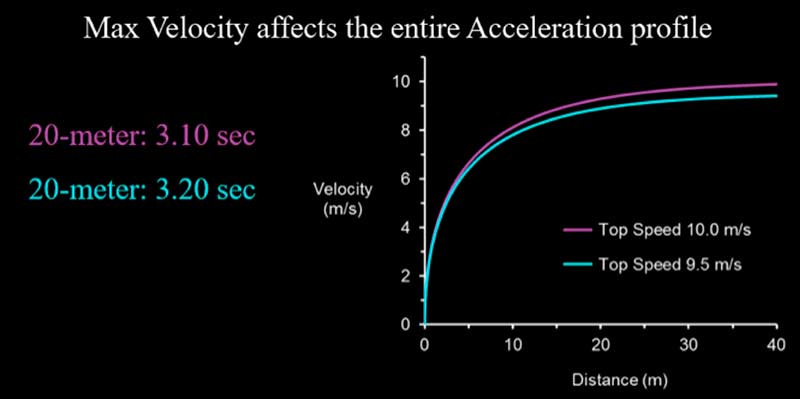
The graph above represents three separate 20-yard sprint speed curves taken at different times. Notice how the top curve (pink) is much higher than the red one and shows a much steeper first segment (acceleration). As the blue segment shows similar peak speed, acceleration is starting to decrease. Red and blue have similar acceleration, but red shows a significant drop in top speed and capacity to accelerate compared to the pink segment. At this point, we must explore why this athlete shows such a loss in performance.
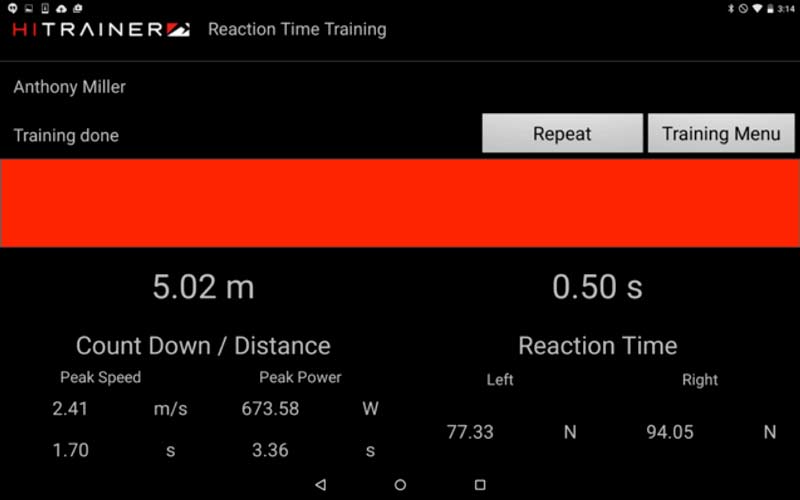
The HiTrainer Pro also assesses cognitive speed with a reaction time function. This function measures how fast an athlete can react to a visual or sound cue. This also gives me all the data mentioned above so I can see if my athletes are just as efficient while making decisions. I value this highly because, on a regular basis, I see athletes losing up to 50% of their total power output while making decisions. And most of them have a very difficult time reaching their full speed if we don’t train this specific component.
For endurance or repeatability, this device is pre-programmed for any desired sport-specific energy file. After choosing my protocol, once again, the HiTrainer gives current real-time data on the capacity to repeat bouts of maximum energy expenditure. With football, for example, I use a 10-snaps protocol. This pre-programmed feature consists of ten bouts of 5-second sprints. Each sprint is followed by a 20-second complete rest (time to go back to huddle). The screen placed in front of the athlete displays every single sprint and calculates the total averages of speed and power. It becomes very easy to establish levels of conditioning for every athlete so we can act accordingly.
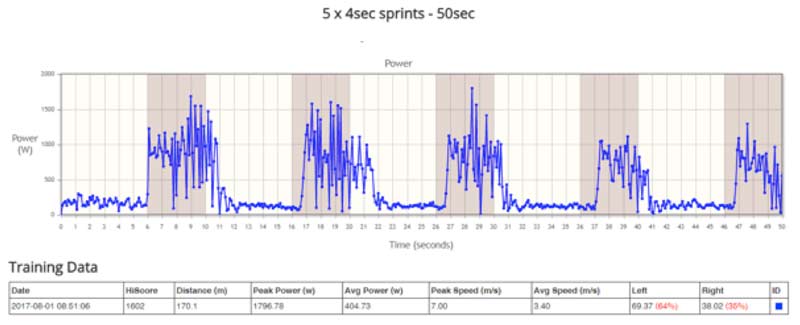
This function is used with hockey players as a representation of one shift on the ice. Notice how peaks of power significantly decreased by the fourth sprint. Also notice the red % on the bottom right. It’s red because it shows an imbalanced ratio of 64% for the left leg and 35% for the right leg. Look back at the previous graph, and we that the same athlete showed near perfect balance on a single acceleration (green % bottom right 49%-51%). It’s an important issue to address–the athlete is overcompensating under fatigue.
In about 5 to 7 minutes per athlete, I have a complete profile of current capacities. The data is very easy for the coach and the athlete to read and understand.
In only a few minutes for each athlete, I create a complete profile of their current capacities, says @hitrainer_pro. Share on XThis is how I monitor fatigue in-season. The tool is simply part of the program and, by using is regularly, the data collected provides me great insight. The machine literally becomes my assistant because it feeds me what I need to know.
Now I have an easy way to monitor all the crucial components necessary for success. As I see one of the components start to decrease enough where my athlete cannot maintain an acceptable variability, we can openly discuss it and see what’s affecting the result so much. We may not know right away what the issue is, but we can certainly raise our hand and call a timeout if needed.
I’ve been using this monitoring process for five years and have tweaked it over time. Like everything else, we must adapt to different environments and athletes.
Baselines and In-Season Training: Final Thoughts
With the very little time we have to train, this baseline assessment has provided great results and has prevented many overtraining, or as I prefer to say, under-recovery situations. It’s also allowed me to easily individualize my workout plans and tailor them to specific needs. Since the HiTrainer is used at every level of athletic development, the manufacturer has done a great job providing wattage and speed standards for gender, age groups, and levels from youth to pros.
This is one of the reasons I can greatly reduce the time needed for lifting; I know exactly what to prescribe and how much. When dealing with a heavy calendar and very little time to get the job done, we strength coaches often have our heads on the chopping block. This monitoring system provides a great insurance policy–it is safe to administer, very reliable, and allows us to make proper interventions when needed.
Since you’re here…
…we have a small favor to ask. More people are reading SimpliFaster than ever, and each week we bring you compelling content from coaches, sport scientists, and physiotherapists who are devoted to building better athletes. Please take a moment to share the articles on social media, engage the authors with questions and comments below, and link to articles when appropriate if you have a blog or participate on forums of related topics. — SF