Velocity-based training has been increasing in popularity in recent years. You can use VBT for many different means, from the incorporation of zones (probably what I am most known for) to load-velocity profiling and from force-velocity-power profiling to velocity loss. While how you use it is, of course, up to you, there are some major factors that come into play.
Since there are so many different types of systems now (camera-based, accelerometer, linear position transducer, LED, etc.), the use of one set of values may not be the best idea, especially as the validity and reliability of some units outside of a Smith rack have yet to be well tested.
However, velocity loss is one area that you can implement well with set numbers, regardless of the device, as it relates back to the device’s own measurement strategy.
What Is Velocity Loss?
Simply put, velocity loss is the percentage of decrement that occurs over the course of a set. This is a predetermined number and most commonly presented in the research as intervals of 10%, 20%, 30%, or 40%. For many individuals, 40% is approaching failure, and this is why there is no research into further velocity decrements.
Work by Pareja-Blanco1 is the most popular on this topic, and that popularity is well deserved. His study in the Scandinavian Journal of Medicine and Science in Sports illustrated two key findings: the affect on speed, strength, and jumping ability of a lower velocity loss and the differences in hypertrophy. I have included figure 1 from the paper below.
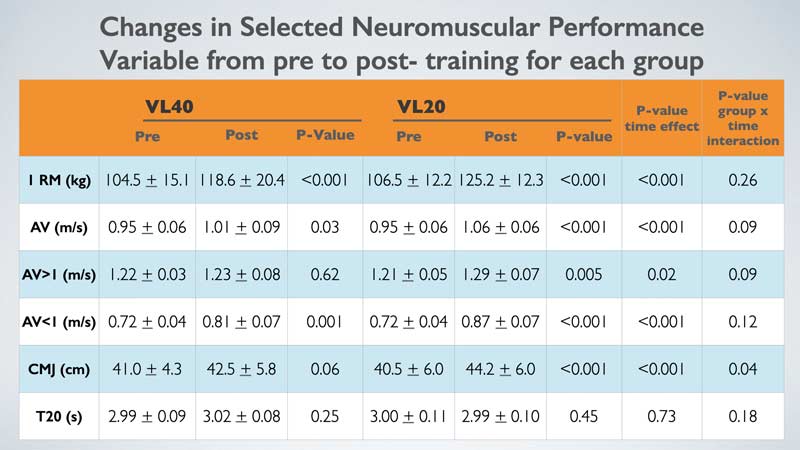
In a world where more is often considered better, this does not seem to be the case. The subjects in the 40% velocity loss group performed twice as many repetitions as the 20% velocity loss group. People would think that the biggest strength gains would come from the group that performed twice as many repetitions. This was not found to be the case, as you can see in figure 1: The increase in strength was about 19 kg for the VL20 group as opposed to about 14 kg for the VL40 group. Both groups achieved improvements in strength, with no statistical difference between the two (but the edge going to the VL20 group).
When investigating the countermovement jump, the VL20 group improved 3.7 cm compared to 1.5 cm for the VL40 group. This difference was found to be statistically significant, in favor of the VL20 group’s improvement. There was no statistical difference in the sprint times. This may simply be due to the large standard deviations. I would be interested to see what would happen with different populations of subjects such as untrained individuals or highly trained athletes as opposed to physically active sports science students.
Regardless of these facts, we can see that athletes can achieve the same results from sprinting and 1RM with half of the volume. Greater improvements in jumping ability were actually achieved with half of the volume. So much for “more is better.”
The outcome of strength, sprints, and jumps were not all they examined in this study. They also performed biopsies, as seen below in figure 2.
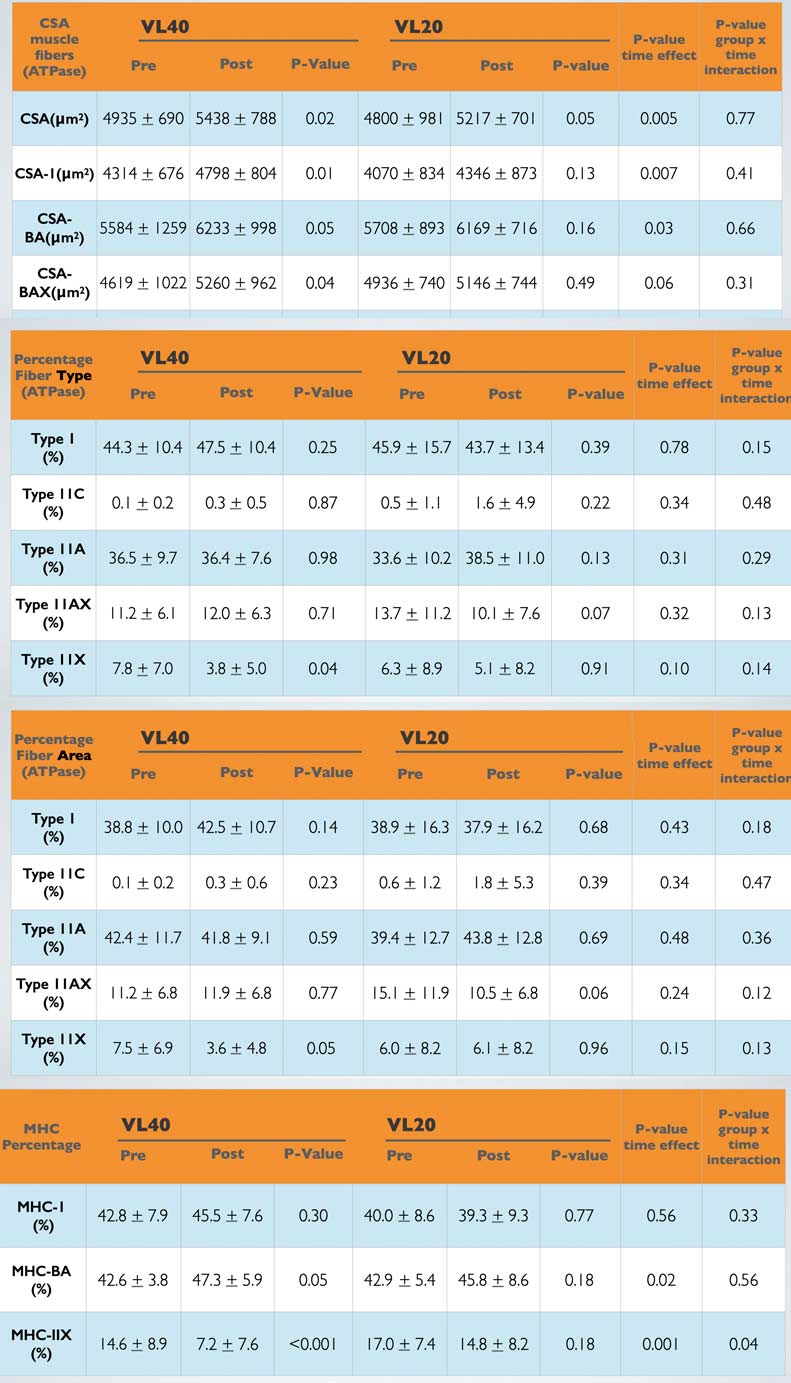
What we can glean from figure 2 is that with 40% velocity loss, we did see a greater overall cross-sectional area, (CSA) with just over 500 for VL40 and 417 for VL20. All of the fibers grew with both of the training protocols, but just looking at the size of the fibers, we can see that the CSA of the type 1 fibers grew the most in the VL40 group. When we examine the VL20, we can see that it was the type II fibers that increased in size the most.
This reminds me of the paper on the World Champion Swiss shot putter who exhibited an extraordinarily low number of type II fibers2, yet his training allowed him to win a world championship. Although he only had 40% of his fibers categorized as type II when considered with the actual number of fibers, they occupied 67% of the area. While it is true that type II fibers are larger in comparison to type I and thus will occupy a larger space, this is usually somewhere in the neighborhood of a 7% difference (i.e., if you possess 30% type II fibers, they occupy 37% of total space). This was not the case for this athlete, as there was a 27% difference, indicating that his training allowed for specific hypertrophy. His training was something that S&C coaches around the world enjoyed watching, with him bounding up stairs, over barriers, and onto and over boxes, with everything performed explosively. The training he did allowed him to maximize his potential over the course of his career.
When examining the sections below, it may be important to examine the hybrids (IIC and IIAX), as their shift may tell an important story. In the VL40 group, we see a slight decrease in IIA fibers and IIX fibers and an increase in IIAX fibers. The story this tells me is that we are shifting away from the most explosive fibers toward type I fibers to cope with the increased metabolic demand seen from training to near failure. In the VL20 group, we see a decrease in percentage of type I, IIX, and IIAX fibers and an increase in the IIC and IIA. This indicates a shift toward the IIA from the type IIX and I fibers.
As a quick aside, some athletes and coaches may see the shift away from the IIX fibers and become concerned. They may look at this and think, “all of my explosive fibers are going away from either sort of training. This is not good.” I know I would have thought that before. What we have to understand is that type IIX only show up in great frequency in elite-level speed and power athletes3,4 and for the general population are seen in the obese and inactive. As somebody in the general population begins to train, there is a shift toward IIA, so this shift away from IIX makes sense.
However, there is no indication of what is going on inside the body during training, which is where a paper by Weakley, et al.5 (myself included) comes in. In our paper, we looked at velocity with lactate, perceived measures, and countermovement jump within the session. The participants did each protocol twice over the course of eight weeks, and they rotated between the different protocols.
Basically, this indicates that the reliability of the individual is consistent over longer time periods. Those who utilized velocity in training their athletes already understood this. Share on XAn interesting finding from this (at least to me) came from the reliability portion of the study. Most studies performed the same session two weeks in a row, but in our study the protocol was done every fourth week. Even with this condition, the magnitudes of the standard deviations were the same as the previous studies that performed the sessions in subsequent weeks. Basically, what this indicates is that the reliability of the individual is consistent over longer time periods. Those who utilized velocity in training their athletes already understood this, but it had never actually been demonstrated in peer-reviewed research for a multitude of reasons.
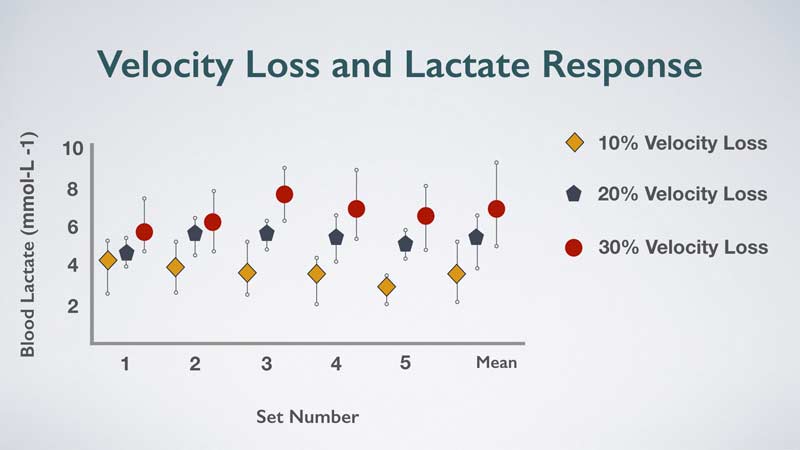
What we can see from this graph is that the lower the velocity loss, the lower the levels of lactate, and they actually tend to slightly decline through the first five sets and increase in the sixth. This trend seems to hold true for all of the velocity loss conditions. This may be a result of the “last sprint phenomenon” where, somehow, all of the athletes are able to run markedly faster on the last sprint of the session even though they have been unable to stand up on their own due to fatigue for the last several repetitions.
The RPE for the lower velocity losses was lower across all sets, of course. There was less work done, so athletes should not feel as fatigued. The relative power and peak concentric velocity were higher across all sets in the lower velocity losses, which is to be expected as there was not as much fatigue.
Statistically, magnitude-based inference was utilized to examine how likely it was that the protocols elicited a different response. Figure 4 below shows that there are “likely moderate” to “most likely large” differences in RPE-L across the five sets between the three protocols, with small to moderate changes occurring between the 10% and 20% and likely large between the 10% and 30% loss groups for RPE-B. This isn’t surprising, as more work will lead to greater fatigue.
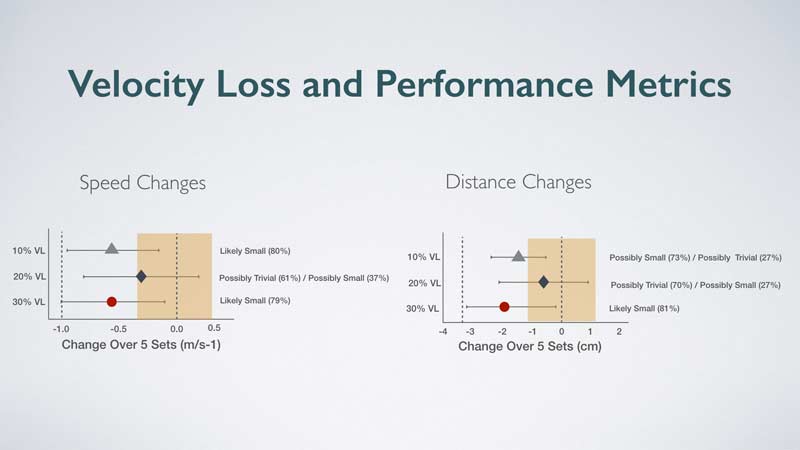
When I first glanced at figure 4, I thought to myself, “Wow, there wasn’t a difference between the jump conditions.” However, that’s not what this says. Essentially, all the protocols found a level of fatigue that stayed through the rest of the protocol.
It is interesting that the level of fatigue stayed consistent across all the sets. This most likely occurs because as fatigue accrues, you will achieve the velocity loss sooner and not accumulate increasing fatigue. In contrast, if you were to do a set prescription, as the fatigue accumulated, and the volume stayed consistent, greater and greater decreases of the jumping metrics would be seen. This could impact subsequent training sessions due to the accrued fatigue, not just the current training session.
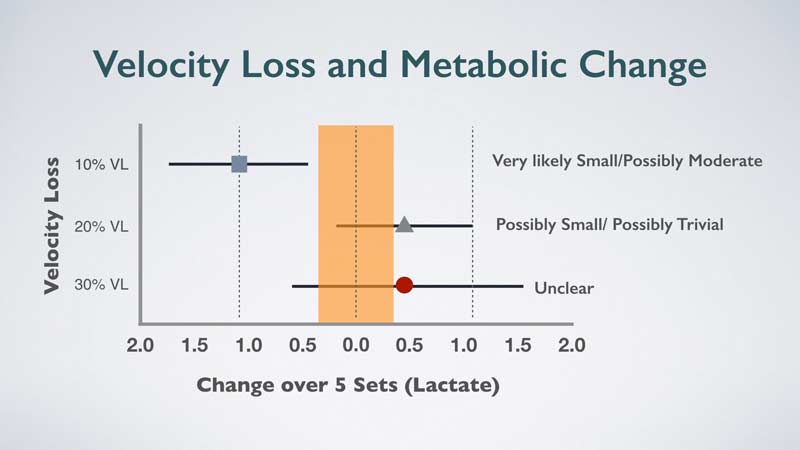
Now to get to the “why does this matter” portion of the article. These two studies quantify the adaptations with different velocity losses. There is no “single best” protocol; it is all dependent on what you’re looking for. If someone needs indiscriminate hypertrophy, say an undersized offensive lineman, going with closer to a 40% velocity loss may aid them in becoming a better athlete. Even though it’s not ideal, they need a greater mass to lead to a greater inertia to better perform their job.
If the same lineman is moving in-season, and you prefer to have set loads, you may want to go with a 10% velocity loss to control for fatigue. Conversely, if I have a sprinter and additional muscle mass would slow them down and lower their strength-to-mass ratio, then the utilization of 10% velocity loss would be ideal year-round. For greater tissue tolerance to fatigue, a higher velocity loss would also be in order.
When you understand what occurs with changes in power, lactate, and, as a chronic effect, hypertrophy, you can make the best decisions possible when training your athletes, says @jbryanmann. Share on XThere is no one way to train athletes. Each decision in the training of athletes requires context to make a decision. Hopefully, this article provides you with some insight into what the different adaptations are with the different velocity losses. When you understand what occurs with changes in power, lactate, and, as a chronic effect, hypertrophy, you can make the best decisions possible when training your athletes. I feel like I should end this article the way they would end the GI Joe cartoons from when I was a kid, where they wrapped up each episode with, “and now you know, and knowing is half of the battle.”
Since you’re here…
…we have a small favor to ask. More people are reading SimpliFaster than ever, and each week we bring you compelling content from coaches, sport scientists, and physiotherapists who are devoted to building better athletes. Please take a moment to share the articles on social media, engage the authors with questions and comments below, and link to articles when appropriate if you have a blog or participate on forums of related topics. — SF
References
1. Pareja-Blanco F, Rodriguez-Rosell D, Sanchez-Medina L, et al. “Effects of velocity loss during resistance training on athletic performance, strength gains and muscle adaptations.” Scandinavian Journal of Medicine and Science in Sports. 2017; 27: 724-735.
2. Billeter R, Jostarndt-Fogen K, Gunthor W, and Hoppeler H. “Fiber type characteristics and myosin light chain expression in a world champion shot putter.” International Journal of Sports Medicine. 2003; 24: 203-207.
3. Serrano N, Colenso-Semple LM, Lazauskus KK, et al. “Extraordinary fast-twitch fiber abundance in elite weightlifters.” PloS One. 2019; 14(3): e0207975.
4. Trappe S, Luden N, Minchev K, Raue U, Jemiolo B, and Trappe TA. “Skeletal muscle signature of a champion sprint runner.” Journal of Applied Physiology (1985). 2015; 118(12): 1460-1466.
5. Weakley J, McLaren S, Ramirez-Lopez C, et al. “Application of velocity loss thresholds during free-weight resistance training: Responses and reproducibility of perceptual, metabolic, and neuromuscular outcomes.” Journal of Sports Sciences. 2019; 1-9.

