The purpose behind the Best Evidence Rule is to prevent inaccuracies and false assertions of truth. In other words, there must be a guarantee of accuracy when claiming an objective fact, such as “my athletes are getting faster because…” by providing a document or other supporting evidence that is guaranteed to be accurate.
It’s important to know if athletes are truly getting faster because that’s how speed training programs are proven to be effective. Using misleading evidence to substantiate a speed training program is a disservice to the athlete and the speed training industry.
The Use of Maximum Velocity to Prove Speed Improvement Is Easily Manipulated
If you look at social media, you’ll see thousands of performance coaches and organizations claiming their athletes are getting faster by posting a faster mph next to a slower one. This is not good evidence, let alone anywhere close to being the best evidence. This is because this metric is easily manipulated.
All athletes get faster during a run, depending on how long the run is. Anyone can have an athlete who is actually getting slower falsely appear faster simply by taking the mph measurement at a longer distance. Another trick commonly used is to increase the fly distance before a split measurement so there is a higher entrance velocity.
Proprietary speed scores are another form of easily manipulated evidence. Some speed promoters claim to have the secret sauce behind teaching an athlete the ability to produce speed and also claim to exclusively have the secret sauce to measure this with their proprietary speed score. However, these speed scores lack any disclosed calculation. Although experienced trainers find these scores comical, unfortunately, many novice trainers rely on them without knowing what they represent and how they are calculated.
Using misleading evidence to support a claim that athletes are getting faster hurts the speed training industry because it attempts to set a standard that can easily be manipulated. Share on XUsing misleading evidence to support a claim that athletes are getting faster hurts the speed training industry because it attempts to set a standard that can easily be manipulated. It also removes a level of integrity that puts a bad light on those trainers who use best evidence to support their claims that their athletes are getting faster. Put another way, the novice speed trainers and organizations using poor evidence appear to be getting better results than the more experienced speed trainers and organizations.
This is not to say that maximum velocity is without value. The argument is that without a consistent and accurate context, the value is easily manipulated to show improvement.
Easily Manipulated Evidence
Below are examples of easily manipulated evidence used to substantiate a speed training program.
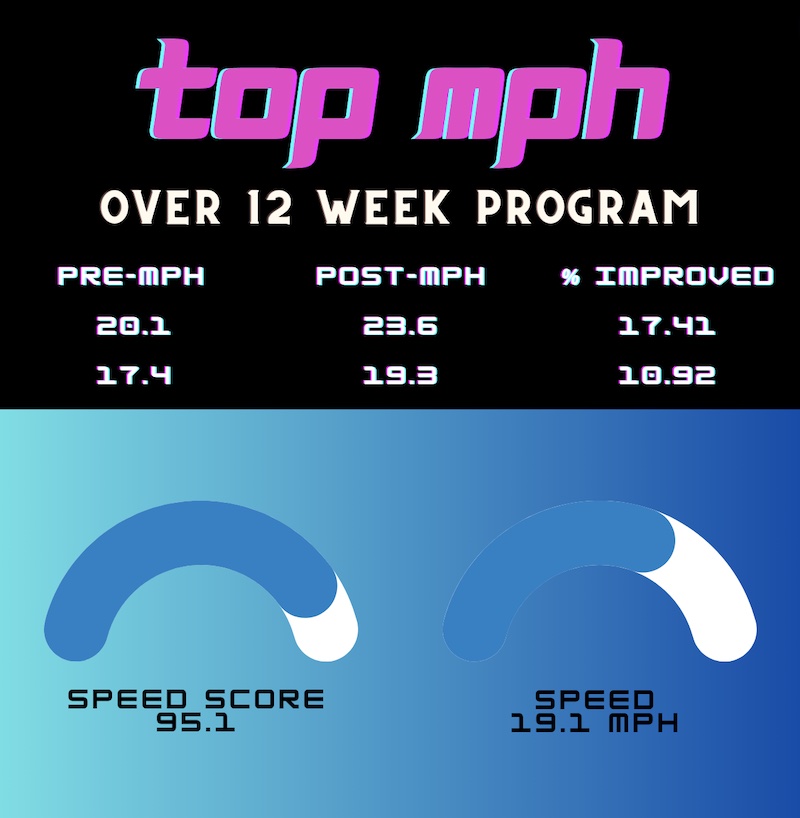
There are many examples of easily manipulated evidence used to substantiate a speed training program. And, to be fair, some very low-cost GPS systems only provide top speed, and that metric is better than nothing. At a minimum, that metric alone can get the conversation started around speed and become a starting point to grow into a more credible system.
Timing gates are another metric that can be easily manipulated. This is so because the distances of the timing gates are susceptible to human error. If the timing gates are 1 foot off, an athlete traveling at 16 mph would have a +/- of about .045 seconds. This could easily account for differences in the results below.
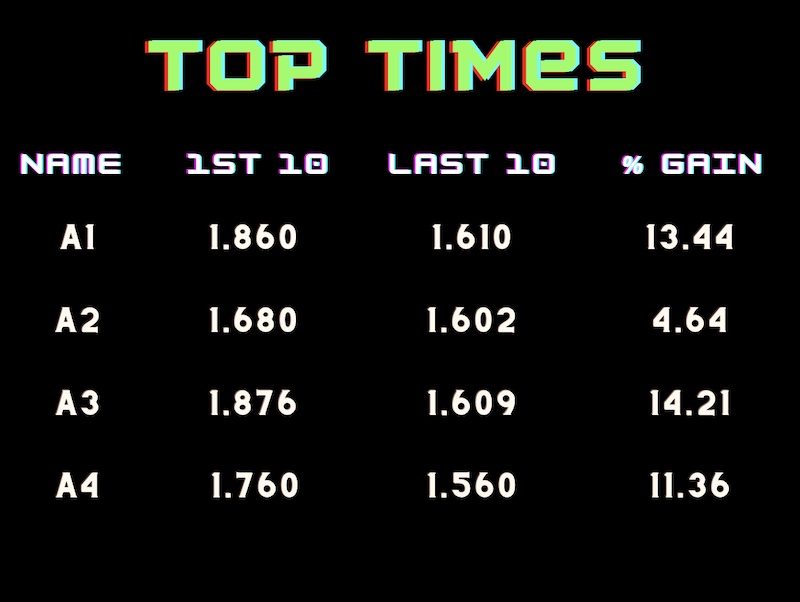
Another variable that must be constant when comparing timing gate results is the start. Some timing gates start with a pressure sensor, some with a laser, and some with an external cue, such as a gun firing. All these variables significantly affect the results. This is especially so when the start is with a laser because athletes can easily create distance before the start, thereby increasing their entrance velocity into the first laser. This manipulation can create variabilities greater than .1 of a second.
Faster Is Not Necessarily Better, even with a Consistent and Accurate Context
A faster athlete is not necessarily a better athlete. In the context of a 100m sprinter, a faster maximum velocity could be accompanied by a slower time if the acceleration phase, transition phase, or velocity maintenance phase decreased. Yet, just posting a faster maximum velocity time would give the illusion that the athlete is better when, in fact, they are worse.
Just posting a faster maximum velocity time would give the illusion that the athlete is better when, in fact, they are worse. Share on XThe same holds true for deceleration and COD training. Eric Lichter provides a clear definition of COD performance, stating:
“Let’s define COD performance in no uncertain terms: it is how quickly you can accelerate, decelerate, re-accelerate, stop, and change direction on the athletic field (and not necessarily in that order). It’s any combination of those skills. This is likely the biggest athletic factor that determines success over your competition in most field sports. Acceleration refers to speed and how quickly it can increase over a given time frame or distance. The same can be said for deceleration and how quickly speed can decrease over a given time frame or distance. What I’m referring to with change of direction performance is the ability to maintain body control, foot placement, and movement efficiency while combining all the components of COD.”
A faster entrance velocity into a 10-yard deceleration could result in a loss of speed control and, ultimately, result in injury or poor deceleration mechanics if the athlete is unable to control their center of mass or lacks judgment and experience to know how far they need to slow down or stop.
Curvilinear runs are another example where maximum velocity can be misleading. This is because curvilinear runs require the athlete to find that balance between speed and control. An athlete’s maximum velocity can increase beyond the athlete’s control, thus leading to a poor-quality curve that results in a greater distance needing to be run. This is an example where faster and farther don’t necessarily mean better. Think of a defensive back or a linebacker who needs to get to a spot on the field in as little time as possible.
How to Prove Athletes Are Getting Faster
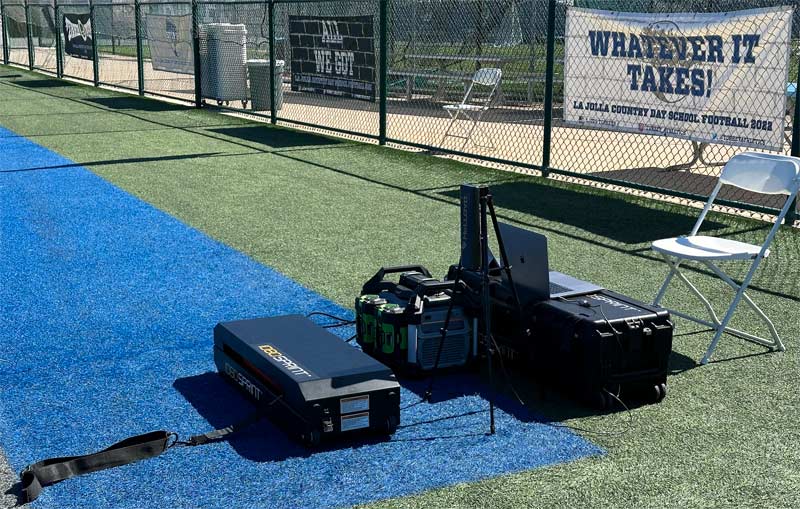
Below are two devices that provide credible evidence of whether an athlete is getting faster: McLloyd GPS and 1080 Sprint.
When most people claim their athletes are getting faster, they really mean their speed is improving. The definition of speed is distance divided by time.
This is a very simple definition, and the result is not easily manipulated if two elements remain constant: starting position and time or starting position and distance. This makes perfect sense when thinking about track athletes because the starting position is always the same. The distance for the event is always specified, so when you compare one 100-meter time against another, you get an accurate representation of whether the athlete got faster or slower because the time either decreased or increased.
Distance as a unit of measure is not yet common practice, but it’s the best evidence to show whether an athlete’s getting faster or slower. I also think it’s the easiest to understand. Share on XThe inverse is true if you keep the starting position and time constant. This unit of measure is not yet common practice, but I believe it is the best evidence to show whether an athlete is getting faster or slower. I also think it is the easiest to understand—especially at the youth level. This is so because even the youngest athletes can conceptualize distance.
An example of this occurs when you line up two youth athletes and have them run for four seconds, holding a coin in one hand. At the end of four seconds, they drop the coin and see how much distance separates them. If there are 5 feet of distance between the coins, each athlete can easily understand what that distance represents. This is because distance is much easier to conceptualize than time.
Distance Is Easier to Conceptualize Than Time
Every day is filled with time that seems to go by fast and time that goes by slowly. However, we never come across a 1-foot ruler that seems longer than another 1-foot ruler. This is because our brains are wired in a way that makes it easy to conceptualize distance much better than we can conceptualize time. The perception that distance is easier to conceptualize than time can be attributed to several factors:
-
- Three of the five senses measure distance: The distance between objects can immediately be seen. We can sense short distances physically when we grasp or touch objects. Sound also provides us with a sense of distance, like whether an ambulance is close or far and whether it’s traveling toward or away from you.
-
- Tangible experience with distance: Humans interact with space and distance daily. Whether walking, reaching for an object, or navigating an environment, our daily experiences are filled with spatial interactions. This constant interaction makes distance something tangible and concrete in our minds.
-
- Measurement tools: Humans have had tools and methods to measure distance for millennia, from simple ruler-like instruments to more advanced tools. In contrast, accurate tools for measuring time (like clocks) are relatively recent inventions.
-
- Physical boundaries: Distance often has clear physical boundaries or endpoints. For instance, the distance between two cities has a definitive start and end point. Time, however, is continuous and abstract, without the same kind of physicality. Sunrise and sunset represent the timeframes day and night, which constantly change throughout the year.
-
- Abstract nature of time: Time becomes an abstract concept, especially when considered beyond our daily experiences. For example, comprehending the span of a millennium or even just a century can be challenging. We often rely on events or milestones to give context to these large spans of time.
- Cognitive load: Processing time, especially in abstract terms, requires a cognitive load. For example, thinking about how long 10 years feels is more abstract than visualizing a distance of 10 miles.
The Best Evidence
The pursuit of excellence in athletic performance has always been underpinned by the drive to measure and validate improvements accurately. In the digital age, with a plethora of metrics and claims circulating on social media, the onus on showcasing genuine progress has never been greater. The “Best Evidence Rule” emerges as the gold standard in this context, emphasizing the imperative of accuracy and reliability when proclaiming an athlete’s speed improvement.
In the digital age, with a plethora of metrics and claims circulating on social media, the onus on showcasing genuine progress has never been greater. Share on XRather than relying on superficial metrics like top speeds, which can be easily manipulated and misconstrued, this section dives into a more nuanced, evidence-based approach. By employing one-second time segments to assess distance from a static start, it offers a more granular, objective, and consistent measure of an athlete’s acceleration and overall speed. As we navigate through this insightful piece, the importance of using GPS technology as a linchpin for this assessment method is highlighted, underscoring its precision, versatility, and credibility in athletic performance analysis.
It’s important to note that even though many GPS units only measure in .1-second intervals, depending on how the unit measures time, the accuracy of that interval can be in the nanoseconds. This is because the timekeeping systems in GPS satellites are the most accurate in existence due to their atomic clocks. Just for reference, a nanosecond in decimal form is 0.000000001 seconds. Therefore, you can be very confident that the time segment from one second to two seconds is exactly one second, give or take a few nanoseconds.
One-Second Time Segments
Imagine if all speed trainers and organizations used one-second segments to measure distance as evidence that their athletes are getting faster. Every speed training program could be compared to another, and the most effective programs would become easy to spot.
If all speed trainers and organizations used one-second segments to measure distance as evidence that their athletes are getting faster, every speed training program could be compared to another. Share on XUsing one-second segments to measure distance, especially from a still start, can offer several benefits when assessing the performance and progress of athletes. Here are some of the benefits:
-
- Detailed performance analysis: Breaking down an athlete’s performance into one-second intervals allows for more granular analysis. This can help identify specific segments where an athlete might be underperforming or excelling.
-
- Acceleration analysis: By measuring the distance covered in each one-second segment from a still start, coaches and trainers can assess an athlete’s acceleration capabilities. This is crucial in many sports where the ability to accelerate quickly can be a game-changing skill.
-
- Identifying fatigue and strength deficiency points: By comparing the distance covered in each segment, it’s possible to identify points where the athlete’s performance starts to decline, possibly due to strength or fatigue. This can guide training regimes to address these weak points.
-
- Progress tracking: Using consistent, one-second intervals provides a standardized method to track an athlete’s progress over time. If an athlete covers more distance in the same timeframe in subsequent tests, it’s a clear indication of improvement.
-
- Tailored training regimens: Understanding performance at these granular levels can help coaches tailor training regimens to focus on specific segments where improvement is needed.
-
- Feedback and motivation: Providing athletes with detailed feedback about their performance in each segment can be a powerful motivational tool. Athletes can set specific, measurable goals for each segment, leading to more focused training.
-
- Consistency in evaluation: Using standardized timeframes ensures consistent performance evaluation across different athletes and training sessions.
- Technique refinement: Analyzing performance in short segments can help identify technical flaws in an athlete’s movement or form that might be affecting their speed or efficiency.
One-Second Segment Examples
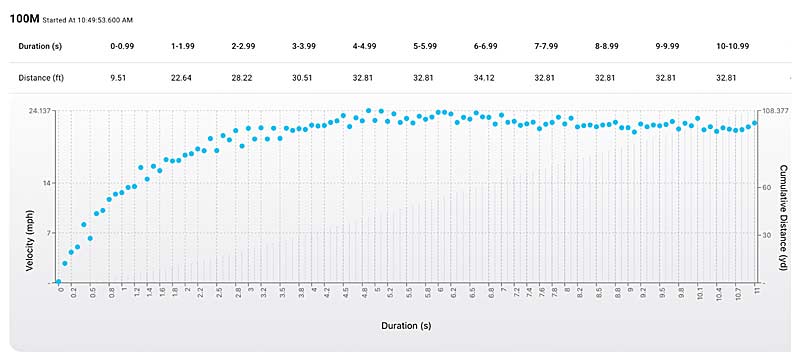
Below are examples of 100m sprint data from the same athlete. Data was captured using a McLloyd GPS unit worn inside a lightweight vest. The first data set is from the opening meet, and the second set is from the following meet one week later. Each time segment analysis is described below. A data point of 0 mph is included rather than the athlete’s first movement because this is a meet where a starting gun initiates the clock.
Opening Meet
2nd Meet

The First One-Second Segment (0–1)
A one-second distance can range from 6 feet for beginner athletes to 14 feet for Olympic-level athletes. One-second distance is a good measurement to isolate the earliest acceleration phase, so the metric is specific to the start. This is a great segment to analyze starting mechanics and force output.
Notice how, in the first meet, only 9.51 feet were covered in the first one-second segment. After this event, the athlete primarily worked on starting mechanics while using the 1080 Sprint with the goal of improving early phase acceleration. This resulted in a significant improvement.
In the second meet, nearly 2 additional feet were covered in the first time segment. Using this analysis, it is easy for everyone, including the young athlete, to see that the athlete is improving.
The Second One-Second Segment (1–2)
The second one-second segment typically measures a segment starting after the third or fourth step. It usually captures the highest rate of speed increase, often resulting in more than twice the distance being covered than in the first. This is a great segment to analyze and compare acceleration qualities and trends.
In the first meet, the athlete covered 22.64 feet in the second time segment. In the second meet, the athlete covered 23.37 feet in the second time segment. Using this analysis, it is easy for everyone, including the young athlete, to see that the athlete is improving.
The Third One-Second Segment (2–3)
The third segment is good for analyzing the transition from the acceleration phase to maximum speed. But that isn’t to say the acceleration qualities aren’t inherently included because the better an athlete is at accelerating, the farther this distance will be.
Here, the athlete goes from 22.22 feet in the first meet to 28.74 feet in the second. Using this analysis, it is easy for everyone, including the young athlete, to see that the athlete is improving.
The Fourth One-Second Segment (3–4)
This segment is where speed really begins to level off. Athletes—in all sports—typically reach 90%–95% of their maximum velocity potential by four seconds. This segment captures the acceleration phase as well as the athlete’s ability to reach their top speed as quickly as possible. If you had to pick one segment to represent an athlete’s ability to accelerate and their ability to run at high velocity, this segment would be it.
Here, the athlete goes from 30.51 feet in the first meet to 31.34 feet in the second. Using this analysis, it is easy for everyone to see, including the young athlete, that the athlete is getting better.
The Importance of Using GPS as Best Evidence in Assessing Athletic Speed
In the age of technology, the role of precise and accurate data collection in sports performance cannot be overstated. Given the emphasis on the “Best Evidence Rule” in the analysis of athletes’ speed improvements, GPS technology stands out as a pivotal tool. Here’s why:
-
- Precision and accuracy: GPS technology provides exact measurements for distance and speed. This precision is essential when evaluating the nuances of an athlete’s performance, especially in instances where mere fractions of seconds or inches can signify meaningful progress or regression.
-
- Scalability: GPS technology can be used on many athletes simultaneously instead of queuing athletes to perform one at a time.
-
- Objective data collection: Relying on subjective or visually assessed data can lead to biases or inaccuracies. GPS technology provides objective data, ensuring assessments and evaluations are based on concrete evidence rather than perceptions or estimates.
-
- Consistency across measurements: As highlighted in the article, consistency in starting positions and measuring points is crucial. GPS allows for uniform data collection points, ensuring every athlete’s performance is evaluated under the same parameters.
-
- Validation of claims: With the prevalence of misleading metrics on platforms like social media, having data backed by GPS technology ensures that claims about an athlete’s speed or improvements are validated. This adds credibility to trainers and organizations, especially when contrasting with those who might use easily manipulated metrics.
-
- Real-time feedback: GPS provides instant feedback. This immediacy is beneficial for trainers and athletes alike, allowing for on-the-spot adjustments and tailored training sessions.
-
- Versatility in application: While the article highlights the use of one-second intervals, GPS technology allows for versatile data collection across different intervals, distances, and contexts. Whether assessing curvilinear runs, acceleration phases, or deceleration mechanics, GPS provides comprehensive data.
- Historical data analysis: Over time, GPS devices store a wealth of data. This historical data can be instrumental in tracking an athlete’s long-term progress, identifying trends, and forecasting future potential.
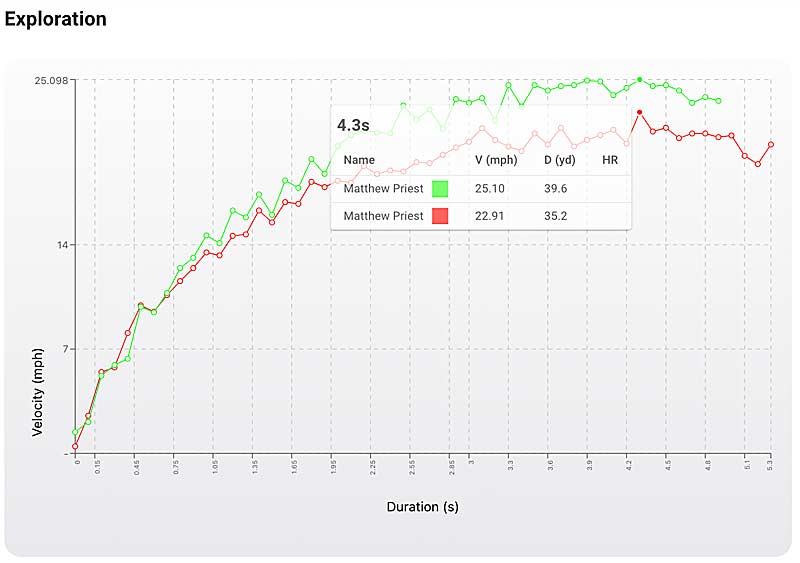
Below are two graphs automatically generated from GPS data that demonstrate how to use best evidence to show the athlete is getting faster. Keeping time at a constant 4.3 seconds, you can easily see that the athlete’s distance has increased from 35.2 yards to 39.6 yards. This is simple-to-understand evidence that the athlete is getting faster.
If we put the cumulative distance on the y-axis, it is even easier to see this athlete’s progress. Keeping time at a constant 4.3 seconds, it’s easy to see the improvement in speed and distance at this point.
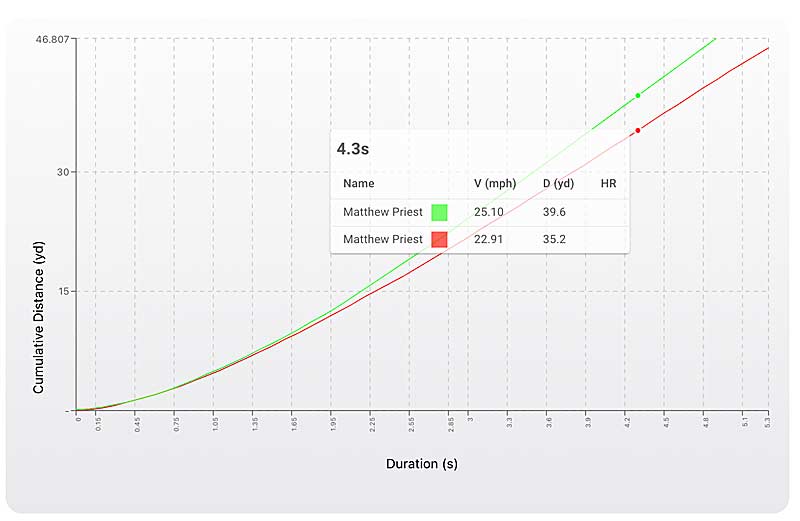
The accompanying graphs, generated from GPS data, exemplify the importance of using best evidence to support claims that an athlete is getting faster. They illustrate a clear enhancement in the athlete’s speed—a distance jump from 35.2 yards to 39.6 yards within a constant time frame. Especially with cumulative distance on the y-axis, the progress at the 4.3-second mark is vivid.
In a world where precision, trustworthiness, and evidence-driven methods reign supreme, GPS emerges as the gold standard, guiding trainers, athletes, and institutions toward informed decisions. Share on XIntegrating GPS in athletes’ speed assessments is indispensable. In a world where precision, trustworthiness, and evidence-driven methods reign supreme, GPS emerges as the gold standard, guiding trainers, athletes, and institutions toward informed decisions.
Summary
This article discussed the importance of using the “Best Evidence Rule” in assessing athletic speed improvements, emphasizing that evidence must be accurate and reliable. The current standard, which involves posting top speed metrics on social media, is misleading and harms the industry’s credibility. This article also discussed that merely being faster doesn’t equate to better performance, citing instances where increased speed might adversely impact an athlete’s performance or result in injuries.
The core proposition of this article is to use a one-second time segment to measure distance at multiple segments from a static start. Benefits include detailed performance analysis, accurate progress tracking, and technique refinement. The article presents data from two meets, showing improvements in an athlete’s performance using this method. The distance covered in one-second intervals provides a clear, objective measure of an athlete’s acceleration and speed, making it easier for both trainers and athletes to understand and visualize progress.
Since you’re here…
…we have a small favor to ask. More people are reading SimpliFaster than ever, and each week we bring you compelling content from coaches, sport scientists, and physiotherapists who are devoted to building better athletes. Please take a moment to share the articles on social media, engage the authors with questions and comments below, and link to articles when appropriate if you have a blog or participate on forums of related topics. — SF

