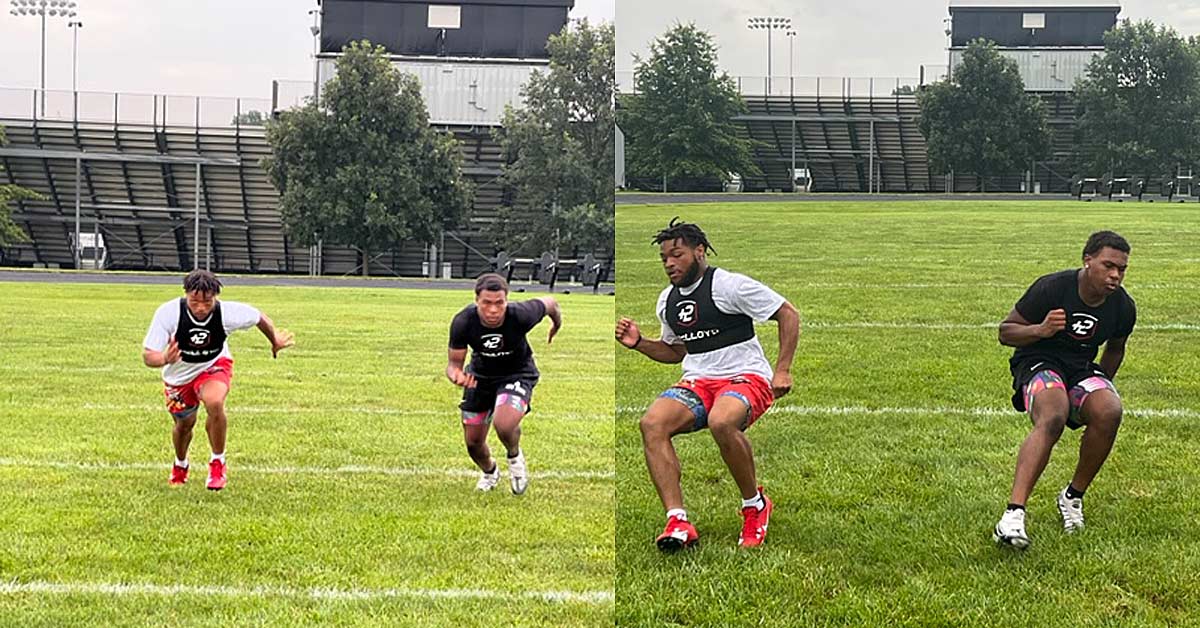
Until this point, GPS has mostly been used by large institutions or organizations with huge checkbooks to assist athletic training and sports medical staff in keeping their athletes in peak physical condition—and, most importantly, as healthy and injury-free as possible. A colleague who was on my staff while I was the Director of Football Performance at Ohio State University is now working for another Power 5 football program, and his sole role is to run, collect, manage, and report the GPS data to the assistant AD for football sports performance and the athletic training staffs.
GPS is no longer available to just the Alabamas and Ohio States; it’s become affordable for the individual end user, says @coachelichter. Share on XWe spoke recently, and he stated that in 2017, before they started tracking player intensity load with GPS, there were a total of 52 soft tissue/hamstring-related injuries in the program. That may seem like a high number of injuries, but this number includes any tightness as well as grade one, two, and three strains. Total training and competition time lost because of those injuries was approximately 789 days. In 2021, that number was reduced to 34, with days lost totaling approximately 309.
GPS player tracking provides important and very useful data that allows coaches to make better decisions in real time, as well as anticipate and alter activity in the coming days or weeks due to the clear and accurate picture that this technology provides. But let’s not stop there—let’s look beyond the obvious and dive deeper into using this technology with not just collegiate and professional athletes but with a much broader population as well. GPS is no longer available to just the Alabamas and Ohio States; it’s become affordable for the individual end user. The technology can be used in youth sports as well, where proper long-term athletic development is needed, and good training decisions lead to much better outcomes with less time missed due to injury or less-than-ideal training protocols.
My world is movement and speed training. Most of the athletes who come through our doors want to move with greater efficiency, improve their mobility and speed, and stay injury-free. We use GPS quite often, but not in the ways outlined above. The three main ways we use GPS in the private sector are:
- Track & field race modeling and monitoring.
- Change of direction (COD) performance.
- Gamify training – competitive, intentional training outputs.
Utilizing GPS for Race Modeling
Let’s define race modeling and talk about why coaches use it to help athletes achieve peak performances.
If athletes could just run all out in every race, there would be no need for a strategy or plan, says @coachelichter. Share on XIn the world of track and field, there is a multitude of events and sprint distances. Not all athletes are built or trained to be able to compete or succeed at all those events. Shorter races (60m, 100m) have different energy demands and training requirements than longer races (200m, 400m, 800m, 1500m, etc.). If athletes could just run all out in every race, there would be no need for a strategy or plan. For example, in the 400-meter sprint, athletes cannot sprint all out for the entire 400 meters without “hitting the wall” and experiencing rapid deceleration from crossing the anaerobic threshold.
Race modeling is building a strategy or plan to run your best race.
Let’s look at one of my favorite races, the 200m. Most 200m runners are taught and trained to break the race down into three parts: an aggressive acceleration for the first 40–50 meters followed by a maintenance of high speed for the next 50–60 meters while navigating the curve with control and posture. Some refer to this as floating, and the goal is to be able to run close to 95% of your maximum velocity while still maintaining some reserve for another push upward after the float.
Following this float, 200-meter runners will make one more push/drive toward the highest speed they can attain with what they have left. They take advantage of the curve to straightaway and hold on to as much maximum speed as possible throughout that last 80 meters of the straightaway to the finish. Learning to run races efficiently doesn’t happen overnight. It takes repetition, getting a feel for running each part of the race, and then putting it all together in its entirety.
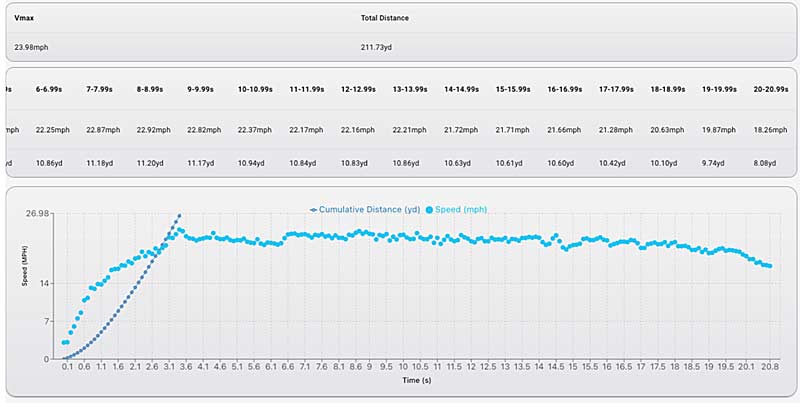
What if we could quantify this process rather than just feel it? Yes, we can train each portion of the race with a stopwatch, but that doesn’t always tell the entire story. With GPS, we can do this (and are doing this) in that exact manner. Below, you can see data from a GPS device worn by one of our sprinters during a 200-meter race.
We were able to capture speed and distance data, which is shown in the tables below in one-second segments. Additionally, we can look at this data on a graph that plots speed and time.
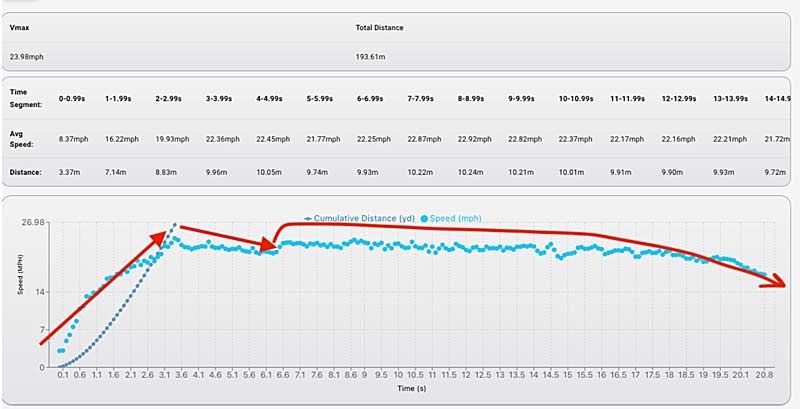
You can see the aggressive acceleration over the first 35 meters in the illustration in Figure 1 above, marked with the first red arrow. You’ll notice the distance out from the start of the race, where the athlete reached his peak speed of 24 mph. That athlete then slightly decelerated over the next 40 meters, depicted by the second red arrow. He had a slight reacceleration bump at the 7–9-second mark (77–81 meters, approximately) of the race, shown by the curve upward at the start of the third red arrow, which then slightly curves downward, illustrating the athlete’s deceleration over the remaining 110 meters of the race.
As a coach, I can compare this actual performance to the ideal performance in this manner:
First phase analysis based on Figure 1
- Actual performance—Reached peak speed at 35 meters.
- Ideal performance—Reach peak speed at around 50 meters.
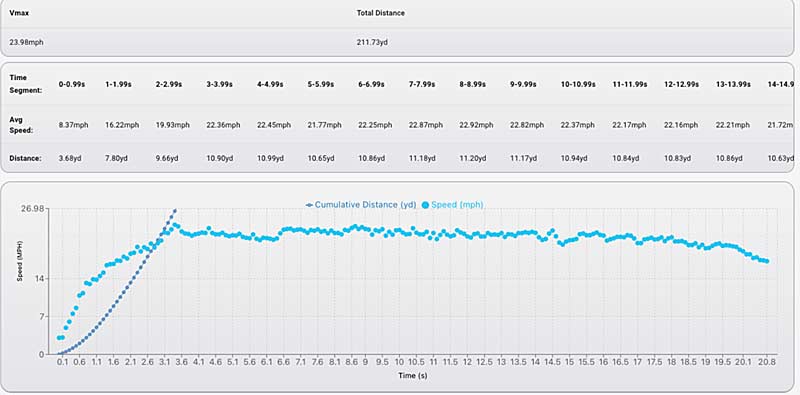
Second phase analysis based on Figure 2
- Actual performance—Lost approximately 1.65 mph over the speed maintenance zone. Zone covered was 39 meters.
- Ideal performance—Lose 1 mph, at the most, over speed maintenance zone. Zone covered would be 42–45 meters.
Third phase analysis based on Figure 3
- Actual performance—Reached second peak speed at 9-second mark (approximately 80 meters) and lost approximately 3.8 mph over remaining 110 meters.
- Ideal performance—Reach second peak at 11-second mark (approximately 110-meter mark) and lose 1.0 mph, at most, over remaining 90 meters.
To summarize, based on the actual performance, we know there is a need to increase drive phase patience and distance, work on speed maintenance training, and certainly improve speed endurance for better performance in this race.
Using GPS to Assess COD Performance
Acceleration, deceleration, re-acceleration, body control, and stopping ability are the name of the game when it comes to field sports. We call this change of direction (COD) performance; most refer to it as agility.
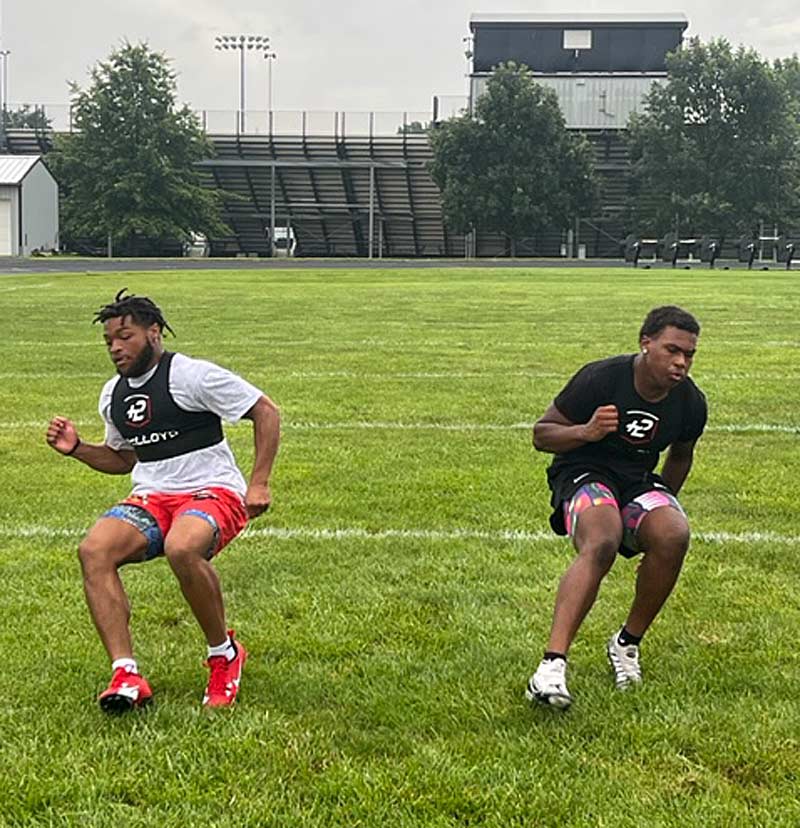
Let’s define COD performance in no uncertain terms: it is how quickly you can accelerate, decelerate, re-accelerate, stop, and change direction on the athletic field (and not necessarily in that order). It’s any combination of those skills.
This is likely the biggest athletic factor that determines success over your competition in most field sports. Acceleration refers to speed and how quickly it can increase over a given time frame or distance. The same can be said for deceleration and how quickly speed can decrease over a given time frame or distance. What I’m referring to with change of direction performance is the ability to maintain body control, foot placement, and movement efficiency while combining all the components of COD.
Change of direction performance is the ability to maintain body control, foot placement, and movement efficiency while combining all the components of COD, says @coachelichter. Share on XOne of the COD performance sessions that we run athletes through while measuring, tracking, and comparing their performances over time is what we call “the vector cut tree.” This is comprised of either a one-cut or two-cut change of direction. For example, one of the vector cuts is a 10-yard linear starting sprint with a 45-degree cut for 5–10 yards after the prescribed cut around the 10-yard mark. Another example is the same 10-yard starting sprint with a 90-degree cut to the right or left and carrying that cut for 5–10 yards following the prescribed cut.
With GPS, we can measure distance, acceleration, speed, and other metrics during this entire movement. In this particular example, we are looking for the highest speed attained over the first 10 yards, the least amount of speed loss during the cut or change in direction of movement, the highest amount of speed regained or achieved in the 5–10 yards of the new linear path of movement following the cut, and a smooth curve or trend line that isn’t scattered about (showing choppy movement or loss of smoothness in the movement).
Let’s look at two athletes performing the linear to 90 cuts in the same session.
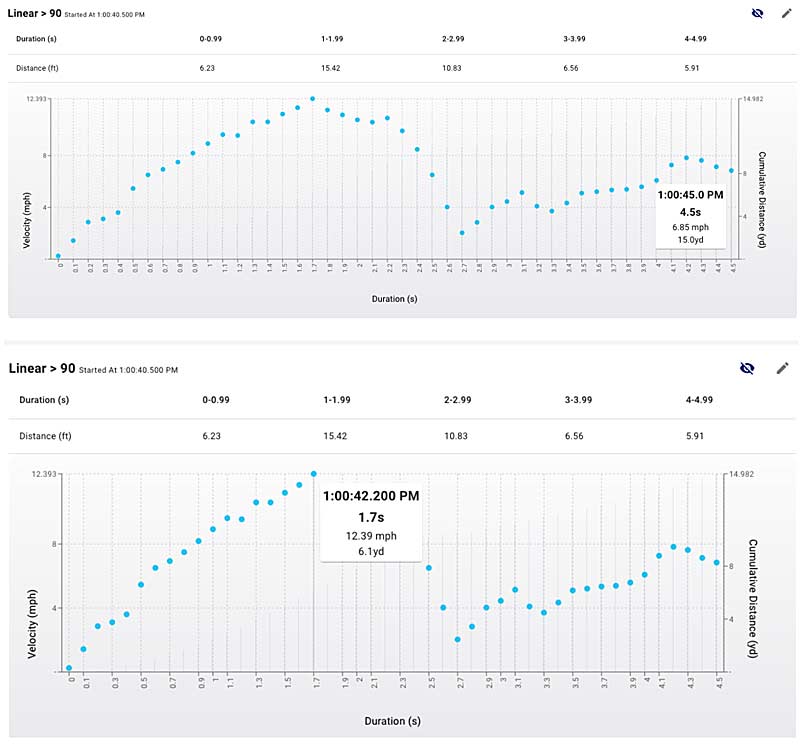
Athlete #1: Analysis based on Figures 4 and 5
- Covered 15 yards in 4.5 seconds.
- Peaked at 12.39 mph at the 6.1-yard mark.
- Had a choppy, inefficient deceleration, evidenced by the scattered dots that form a rough curve.
- Lost approximately 10.89 mph during the 90-degree cut.
- Reached a peak speed of 7.83 mph in the second direction of motion following the 90-degree cut.
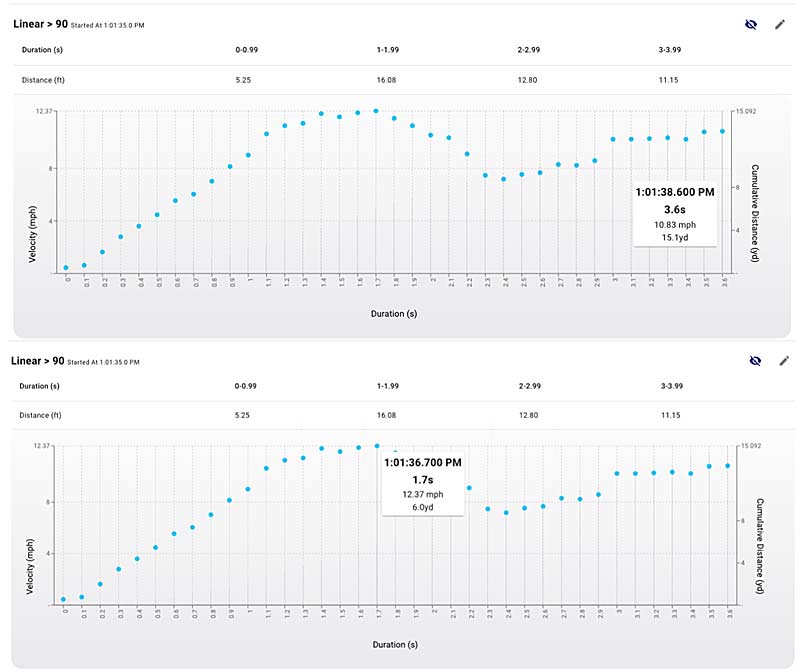
Athlete #2: Analysis based on Figures 6 and 7
- Covered 15 yards in 3.6 seconds.
- Peaked at 12.37 mph at the 6.0-yard mark.
- Had a smooth deceleration evidenced by the smooth curve.
- Lost approximately 2.97 mph during the 90-degree cut.
- Reached a peak speed of 10.83 mph in the second direction of motion following the 90-degree cut.
In summary, Athlete #2 had a much better performance in that movement pattern. He completed the entire required distance in less time. While both athletes reached the same speed on the first line of movement around the same distance out from the start, Athlete #2 was able to change his direction of movement sharply with much less speed lost. Then he accelerated again in the new direction and reached a higher speed at the conclusion of the movement.
Gamify Training with GPS!
Speed coaches know if you time a sprint or movement, the athlete will run as fast as they can. Training and moving with intent are extremely important for improving the quality of training sessions, repetitions, and drills.
I remember a day when my coaches and I were looking over fly sprint times and wondering why our athletes weren’t performing as well as we were expecting them to at a particular practice. We had deloaded their training for a week or two leading up to this session and were giving them maximum rest between sprints. This made us believe we would see lots of new personal bests for this benchmark sprint on this day.
Most of the athletes were just stale, running the fly 20-meter sprints against timing gates. The speaker that we play music on was dead too (no charge), and even though we were timing their runs, they just didn’t have the juice. I told my coaching staff to set up a second and third lane with timing gates, organize the sprinters in groups of three by comparable speed, and race them.
Sometimes, timing them isn’t enough to create the intentional efforts needed, so by adding a competitive race to the equation—mixed in with a few friendly wagers on each race—we got the results we were looking for over the next two sprints. PBs started popping off like crazy! Times, on average, improved by .15–.2 seconds, in some cases.
Sometimes, timing athletes isn’t enough to create the intentional efforts needed, but adding a competitive race gave us the results we were looking for, says @coachelichter. Share on XThis was an example of what we call gamifying a session or drill. Build a score or win/loss around an exercise, and you will get the very best outputs from the ultra-competitive athletes you coach. You tap into their innate desire to compete, perform better than an opponent or teammate, and ultimately WIN! Just win, baby is the motto!
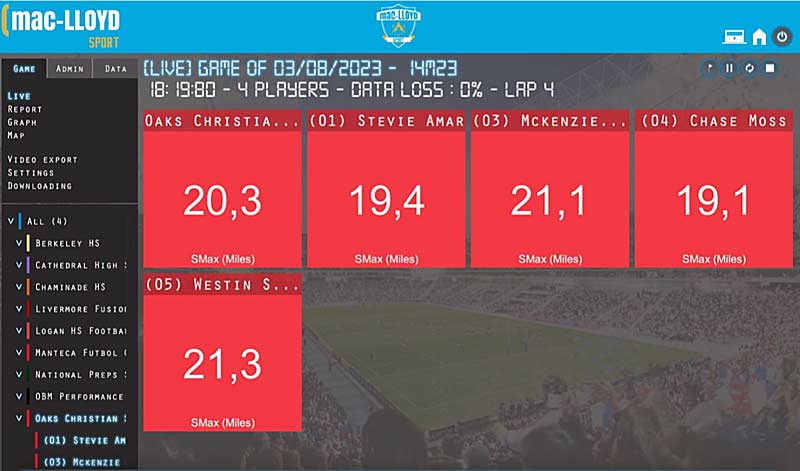
With GPS, you can gamify almost any movement, drill, or sprint. Figure 8 shows the peak velocity of the sprint with an on-screen alert set to show when each athlete being monitored hits 90% of their max output speed. You can see that all the boxes are colored red, which is the alert that was set. If the athlete did not hit 90% of their peak speed, the box would remain the default color.
This is particularly useful for us when administering true speed sessions where we want to see an athlete hit 95% or greater of their maximum speed output on each sprint rep. If they are not hitting that high a threshold, we would likely make an adjustment in the session—such as allowing for more recovery time, for example. If we see speed dropping below 90%, the session will be ended—and these alerts help us monitor that performance metric in real time with GPS.
A Precision Tool
The more precise we can be—making sure we keep the main thing the main thing and without over-analyzing the data—the more impact our programs and coaching will have. If you are a private sector coach and looking for better ways to quantify training to help your athletes lock in and crush performance and move with better precision, speed, and power, then take a serious look at adding this GPS technology into your program.
If you have questions or want to discuss, further feel free to contact me through email at [email protected].
Since you’re here…
…we have a small favor to ask. More people are reading SimpliFaster than ever, and each week we bring you compelling content from coaches, sport scientists, and physiotherapists who are devoted to building better athletes. Please take a moment to share the articles on social media, engage the authors with questions and comments below, and link to articles when appropriate if you have a blog or participate on forums of related topics. — SF

