I have had the MuscleLab Contact Grid for nearly one year. Unfortunately, the timing has not been ideal, with the many restrictions in place since mid-March. My intent was to publish this months ago, but better late than never!
This article has a simple purpose: to show how you can use the contact grid, and what data it can capture. This will be a visual-rich resource with minimal explanation. I think seeing is believing when it comes to the contact grid (which I am willing to do live for anyone who lives in the Chicagoland area), but this is the next best thing that I can offer to a wider audience.
Carl Valle has written before about the contact grid and contact times (here, here, and here), and I would encourage you to read those articles either before or after this one to fill in the gaps. A few quick items to address prior to showcasing the different tasks:
-
- The grid uses MuscleLab software on a Windows-based machine. I use a Surface Pro (not included in the purchase of the grid).
-
- One portion of the grid connects directly to the Windows-based machine, while the other section is a “floater.”
-
- Assuming you are on flat, unobstructed ground, you should be able to set up the grid in minutes. Notice the use of the word “flat” and not “level.” The grid would work fine on an inclined surface with a consistent slope, such as a parking garage ramp (perfect for acceleration work!). Tile, carpet, AstroTurf, concrete, hardwood, multipurpose flooring, and track surface all work well.
-
- If you want to use it on grass or field turf, you will likely have to slightly raise the grid. This, of course, would decrease its accuracy, but it would still allow a coach to see trends to make the necessary adjustments to programming. For those looking for precision on obstructed or undulating surfaces, IMUs make sense.
-
- I want to emphasize the importance of a flat surface. There is usually no problem when the sections of the grid are placed relatively close together, but when you move out to the maximum possible distance of 40 meters, interference is more likely. Keep in mind that while it is frustrating, it is a fault of the facility, not the fault of the grid. I have had minimal issues with extended distance indoors, but our outdoor facility has presented a challenge. The use of a laser level can allow coaches to quickly learn which areas of their playing surface are actually flat!
- At the end of the day, the possible 40-meter grid length with just two pieces of hardware, combined with the cost, is a huge strength for this product. A similar length of force plates or Optojump would cost well into six figures or more! Also, while not capturing everything Optojump or force plates collect, the Muscle Lab allows users to attain key metrics that were previously impossible to gather due to hardware cost, or too tedious in terms of time (using video to capture GCT).
Vertical Jump Tests
Video 1. Squat jump, countermovement jump without arms, and countermovement jump with arms.
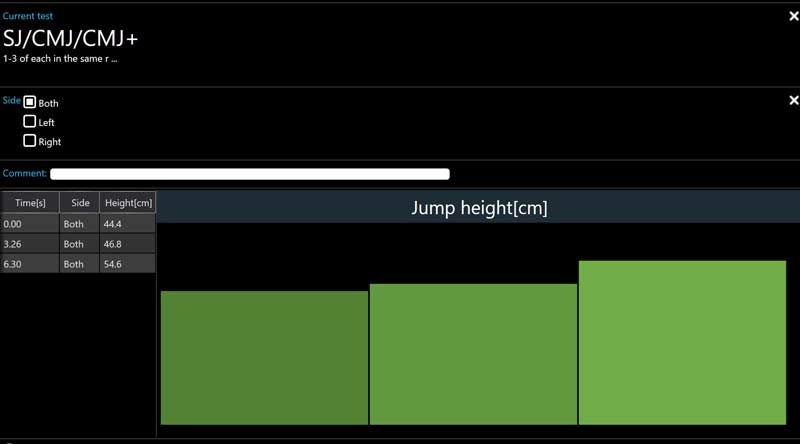
In all in-place jump tests, it is important to ensure the test is valid. Excessive drift (landing far away from takeoff) or excessive flexion upon landing leads to false scores. You will note that there are examples shown in this article which would be invalid. We were on a time crunch! I have found the use of chalk to create a “zone” that the athlete attempts to stay in can help with minimizing drift.
In the test above, I had an athlete perform a squat jump, a countermovement jump without arms, and then a countermovement jump with arms. These can be done as individual tests, but I like having the data in one place. It makes it easy to determine if an athlete favors strength or elasticity as a movement strategy.
Reactive Strength Index (RSI) Tests
RSI can be a helpful metric to assist in guiding programming. I show three RSI tests below. Each has its own strengths and weaknesses, and I encourage readers to look at this series of articles by Eamonn Flanagan for further details. In each of the tests addressed, I utilize the RSI metric given by the grid for immediate feedback for the athlete (this is calculated by (jump height/contact time) x 1,000). After the session, I look at the ratio of flight time to contact time. As with any grid or mat system, jump height is an approximation of center of mass displacement. I prefer flight time because it is not an approximation, and it creates an apples-to-apples comparison (time/time).
I have the arms in use during each of these, as I am interested in how the athletes synchronize upper and lower body movement. If I was after a true RSI metric, the athletes would have their hands on their hips.
It is also important to remember that improving RSI is not the endgame. For me, the purpose of collecting it is to raise intent and use it to assist in decision-making, which will ideally lead to improvement in actual sport.
Drop Jump RSI
Video 2. Drop jump RSI.
Attaining a peak RSI using this method is not friendly for large groups, as it takes a highly adjustable set of boxes to achieve a true mark. I prefer using this method to overload an athlete from a height that is slightly higher than what you will see in the tests below. This challenges the athlete’s eccentric ability, which allows them to become better energy recyclers.
Rebound Jump RSI
Video 3. Rebound jump RSI.
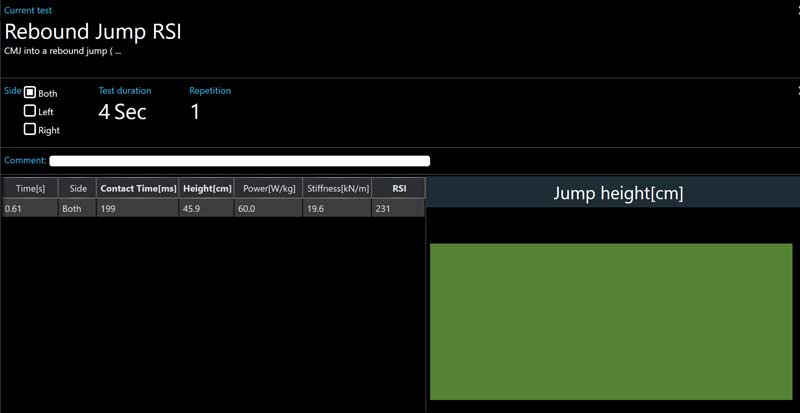
The advantage to this test is it takes much less time to assess a big group. You could argue that it is not as accurate because the athlete self-selects the height of the initial jump. Another alternative would be to jump off both legs initially, and then land and jump off either the right or left leg for the second jump. This would allow a coach to see imbalance (especially useful in return to play) or identify athletes who could excel in the triple jump.
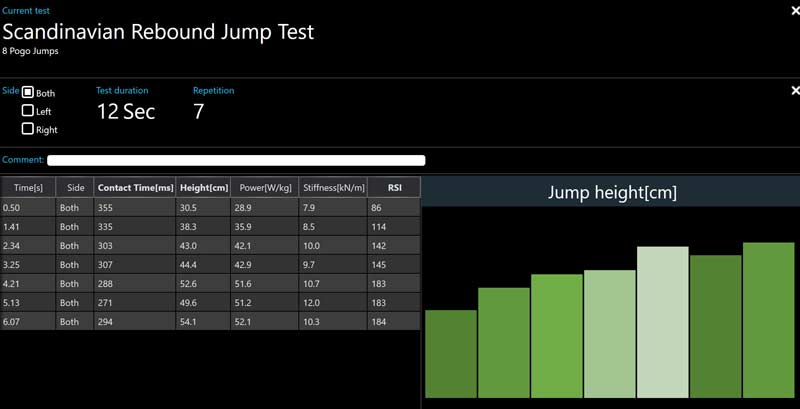
Scandinavian Rebound Jump Test (SJRT) RSI
Video 4. Scandinavian rebound jump test RSI.
Of all the RSI tests, the SJRT is my favorite because it teaches an athlete how to bounce. In the words of Carl Valle, it is “both a skill and a test.” I have found it to be a low-risk, high-reward activity, as it teaches athletes to synchronize their upper and lower body, interact with the ground more effectively, and assess their nervous system readiness. More than the other two tests, video adds an important layer to this test because a coach can identify energy leaks and review if a rep is valid. (It is a greater challenge to keep track of this due to multiple jumps.)
Sprinting Tests
In each of the sprint tests, the metric I look at is contact time. While timing sprints is a wonderful metric for both coach and athlete, contact time is an additional layer that is more useful for coaches. If an athlete showcases inefficient ground contact on one leg, the grid provides an objective measure to determine if the interventions are working.
While timing sprints is a wonderful metric for both coach and athlete, contact time is an additional layer that is more useful for coaches, says @HFJumps. Share on XAcceleration
Video 5. Acceleration
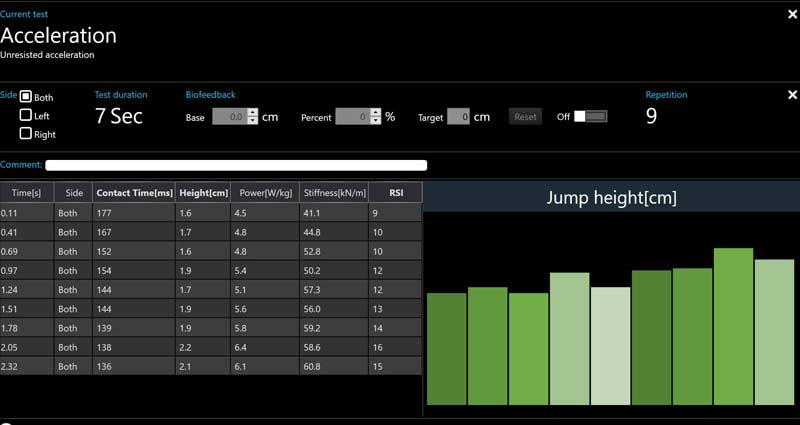
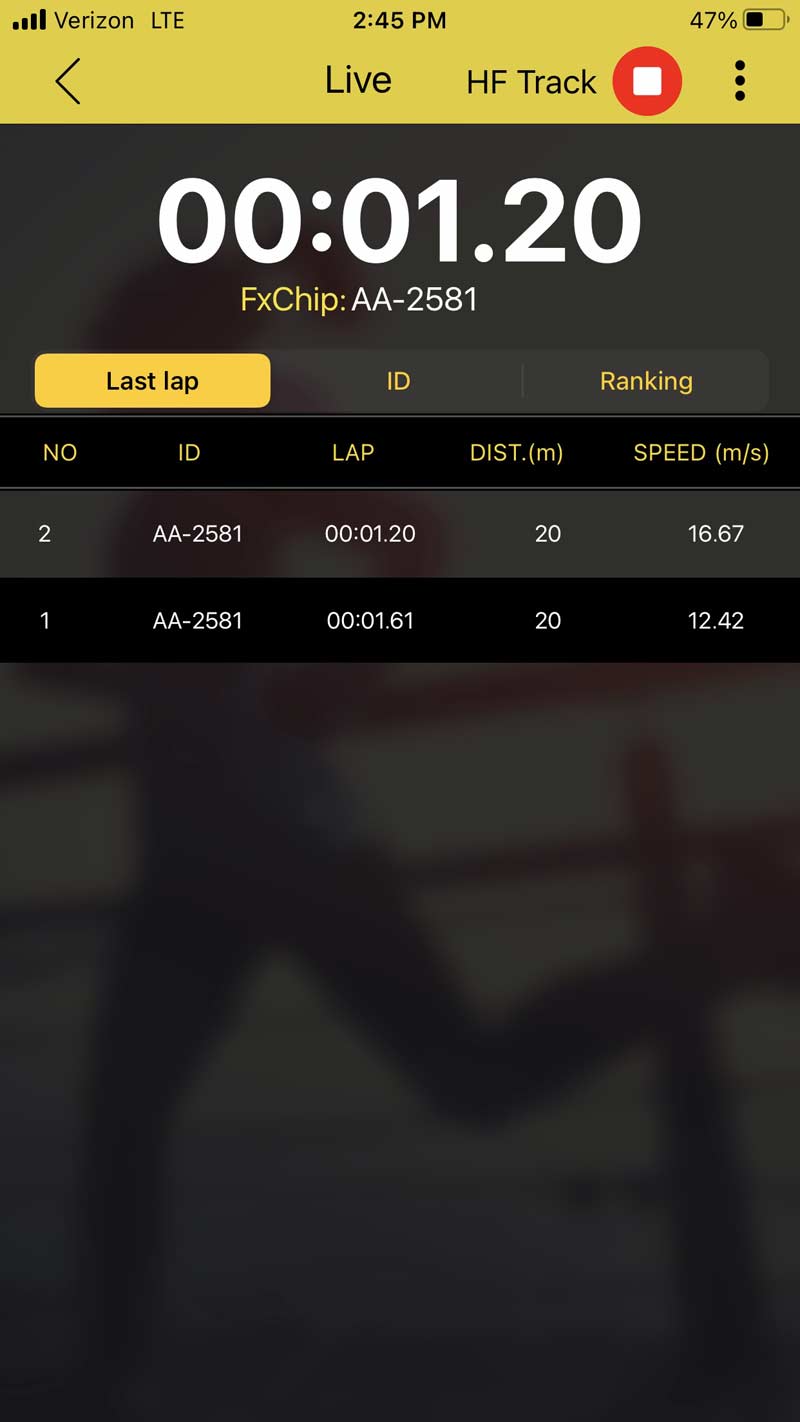
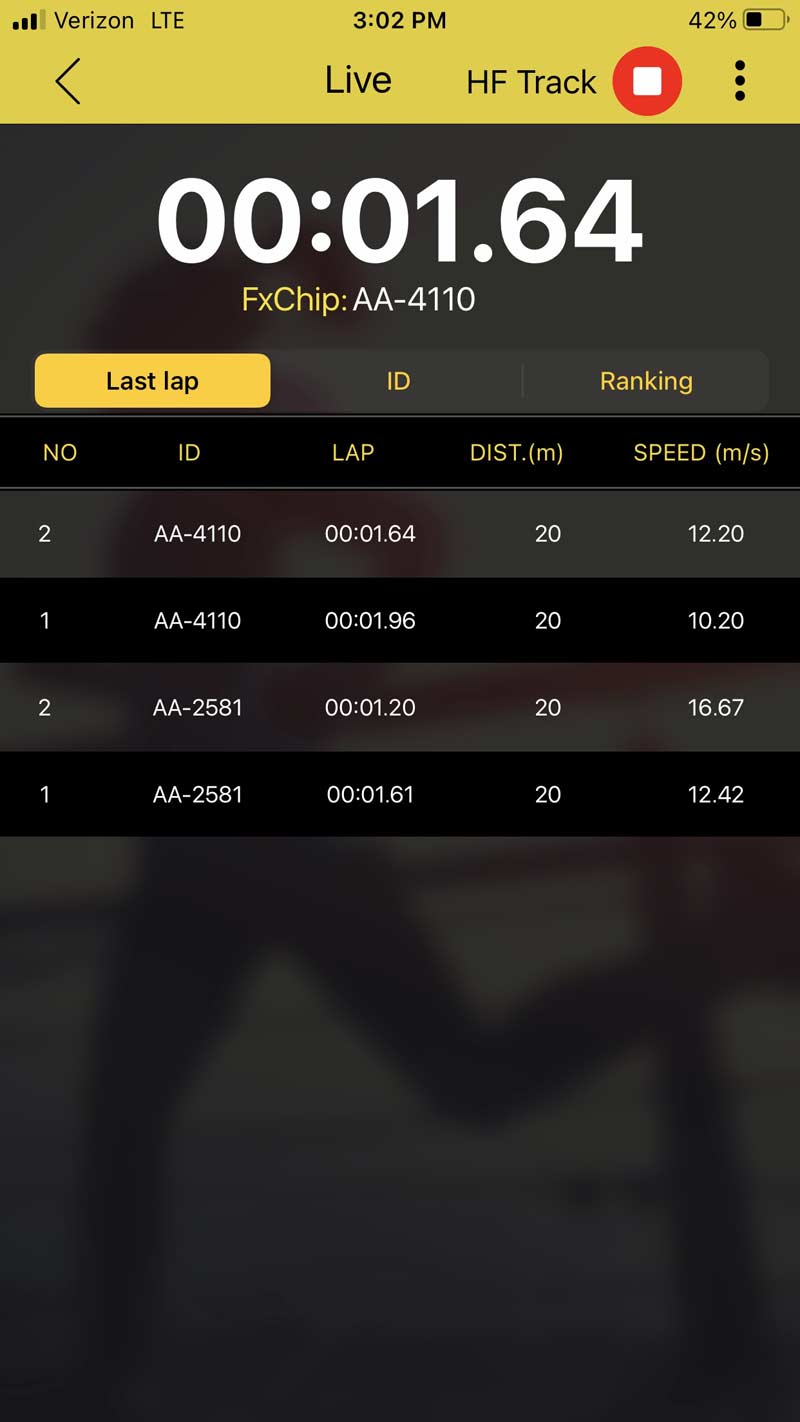
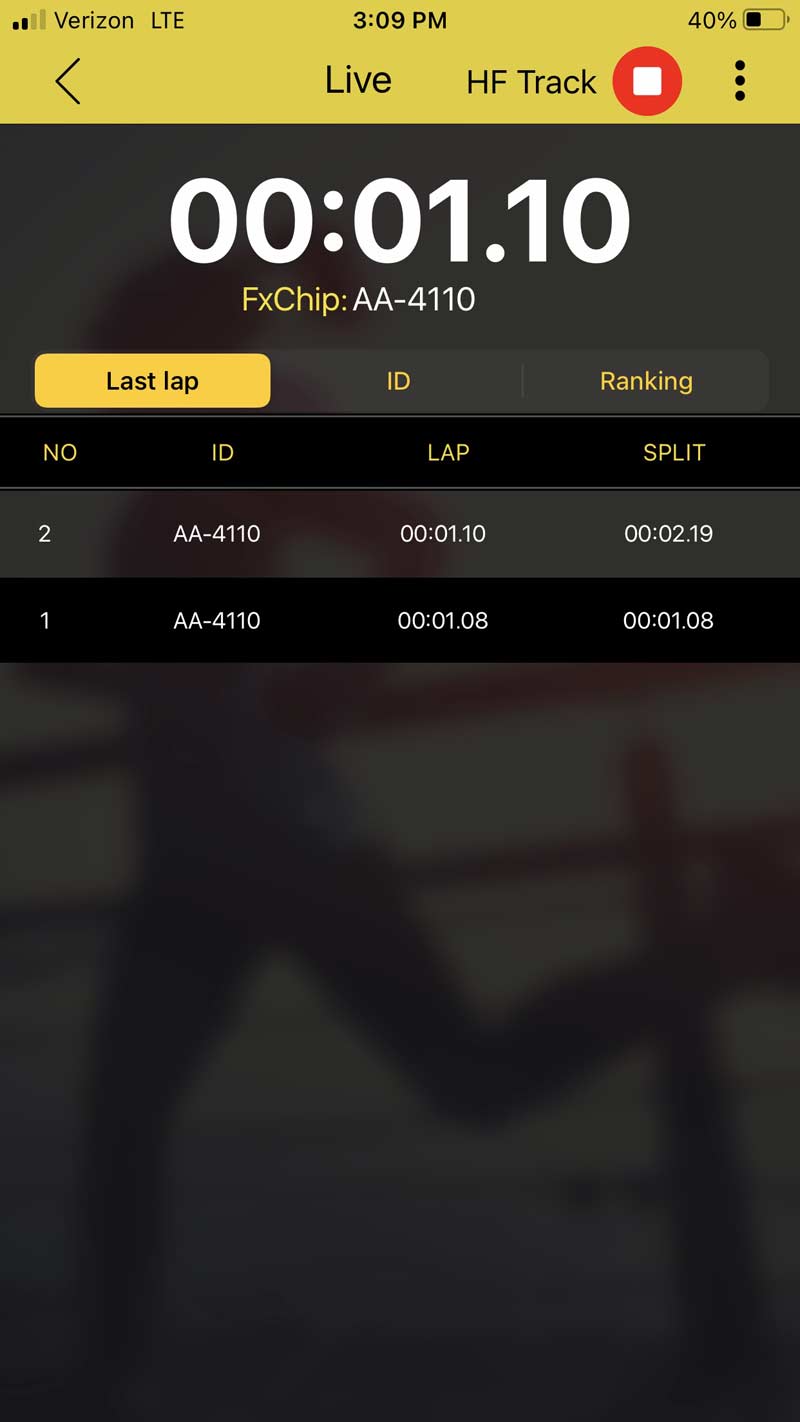
Notice the decrease in contact time as the athlete progresses. Combining the contact grid and a timing system (Freelap data shown below) paints a more complete picture.
Note: For those with a larger budget, MuscleLab has additional hardware (timing gates, IMUs, laser, and a resisted/assisted device) that integrate with one another, providing a full sprint profile.
<br/.
Resisted Acceleration
Video 6. Resisted Acceleration
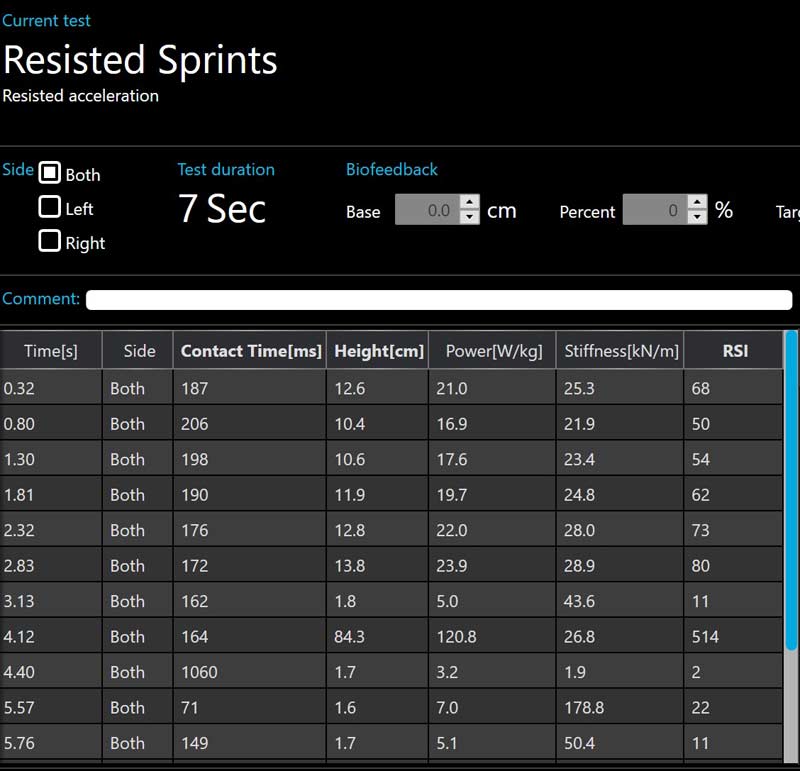
Here the athlete is attached to an Exer-Genie to provide resistance. Unfortunately, the device was sticking a bit, which led to a slight stumble. This can be seen in the data below (contact time of 1,060 milliseconds). Using a contact grid, timing system, force sensor, and resistance device can create a setup somewhat similar to a 1080 Sprint or DynaSpeed, for a fraction of the cost.
Possibly the most important component of the contact grid is that it allows for coaches to build a robust set of data specific to their population. Here, utilizing different resistances to achieve various sprint times, and the contact times associated with them, can help a coach build a complete acceleration profile.
Maximum Velocity
Video 7. Flying sprint.
Are there commonalities in right/left contact times between maximum velocity and acceleration? Once again, the contact grid can give objective answers.

Bounding Tests
Utilizing a contract grid with bounding is my favorite application of it. My previous article on bounding covers the exercise itself thoroughly, but here I will go deeper into how I use the data the grid gives.
Speed Bounds
I tend to look at two metrics with speed bounding: contact time and power. The chart below (generated by MuscleLab software) shows the data from eight different athletes completing a single repetition of 20-meter speed bounds with a 10-meter run-in. There is a qualitative evaluation that must be taken into account here.
If you look at Athlete 5, you can clearly see a much higher power value (22.28 W/kg), which also corresponds with higher average flight time (344.25 milliseconds), and higher average contact time (206.5 milliseconds) when compared to the other seven athletes. Despite receiving the same instructions as the other athletes, Athlete 5 did not perform what I would consider a speed bound. In a small pool of data thus far, our fastest high school males have average contact times less than 140 milliseconds for this drill and average power levels approaching or exceeding 9 W/kg.
Please note that the eight athletes below are all upperclassmen and pass the eye test for speed bounds. Many high school athletes do not, and they would be better served with remedial exercises to assist their progression.

Video 8. I really like watching foot contacts during bounds. Here, you will notice a forefoot biased contact more similar to sprinting (heel is slightly elevated). This minimizes GCT. In the upcoming power bound videos, you will see a heel-toe contact. This increases GCT but allows the athlete to be more powerful.
During the next two videos, please pay attention to the arm action of each athlete.
Video 9. A 10.5-second 100m athlete speed bounds.
Video 10. A 11.0-second 100m athlete speed bounds.
The first athlete is a 10.5-second 100m athlete. The second is an 11.0-second 100m athlete. The 10.5-second athlete produces better metrics (GCT and power) in this drill. His arm action is much more compact. Would a more compact style for the second athlete lead to better metrics in this drill? Could that transfer to faster sprinting? This is a way in which the contact grid can assist in technical considerations.
Power Bounds
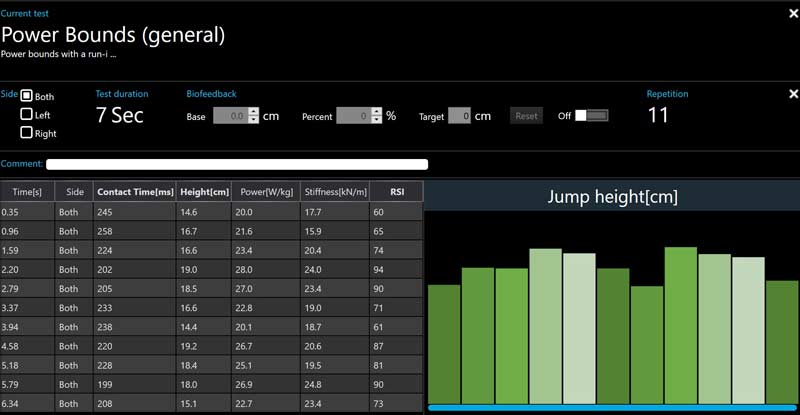
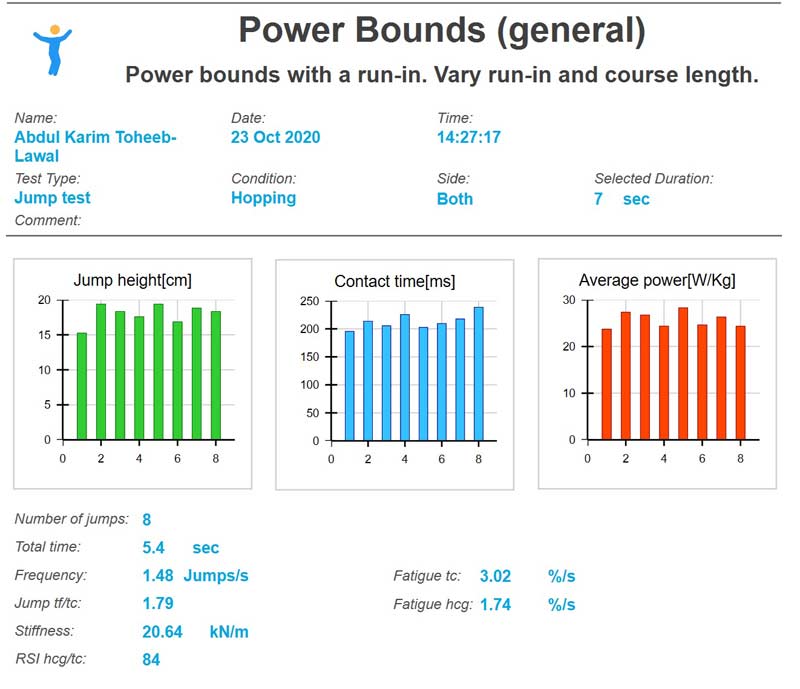
As a jumps coach, I am a huge fan of power bounds. Ironically, I called them power bounds prior to having the contact grid, and it just so happens that the power metric is much higher than other forms of bounding. This drill is one of our go-to tests because of the similarities in ground contact found in the final steps in the jumps in track and field (and during triple jump). It serves as both event preparation and a unique performance measure. Our athletes get excited when we bound for power. Our best athletes have contact times around 200 milliseconds, and power outputs approaching 30 W/kg.
Video 11. Notice the heel-toe or rolling ground contacts in this power bound.
Video 12. If the athlete starts within the contact grid, it will capture the first contact. If the athlete starts outside the grid, it will not. In this case, the first contact is a signal to the grid to begin capturing data.
Bound Bleeds
Video 13. An example of a bound to sprint bleed.
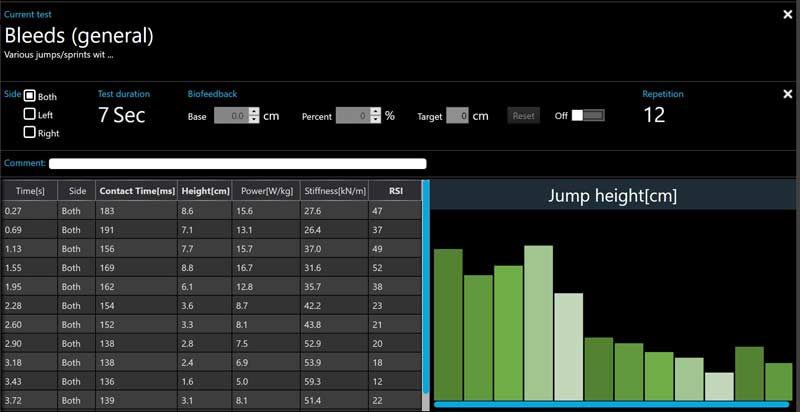
In this example, the athlete was instructed to begin the time within the contact grid with three power bounds, followed by three speed bounds, followed by a sprint. Like the SJRT, it is a skill and a test, and I like the coordination demand it places on the athlete. Similar to the first test in the article (SJ, CMJ, CMJ + arms), I find value in three different tests being present on the live screen. I can foresee using this test to assist with athlete event placement.
Miscellaneous Jump/Hop Tests
The following tests are ones with which I have not done too much, but I include them to answer possible questions and spark new ideas.
Horizontal Rebound Jumps
Video 14. This is a way to utilize the grid to handle standard hurdle jumps. You could use a similar setup (with wide-based homemade PVC hurdles) for actual hurdling.
Box Jumps/Hops
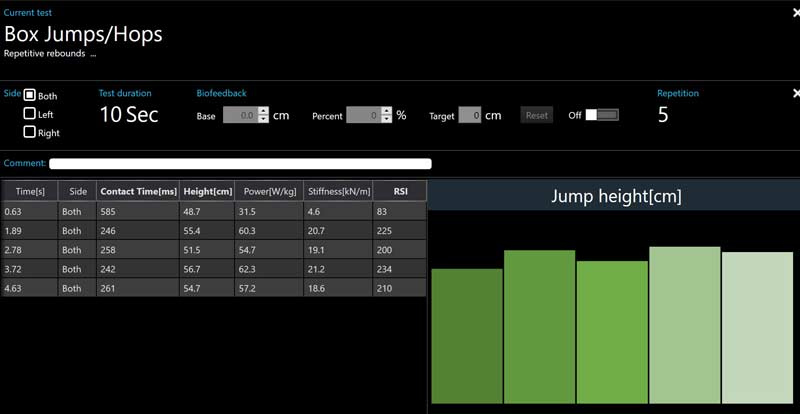
Video 15. I would look not only at contact time here, but also the frequency between contacts, or the amount of time it would take to reach a certain number of contacts. This can be a unilateral or bilateral exercise. While there is no substitute for sprinting, this exercise is a solid option in the winter months if you have limited or off-limits indoor space.
Hops
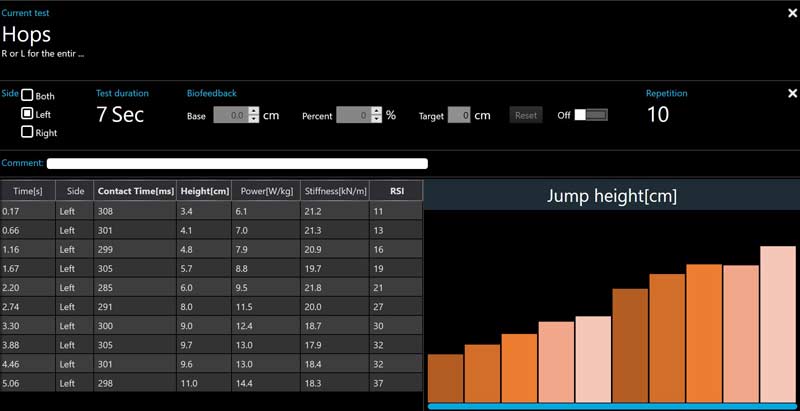
Video 16. The purpose of showing this is to choose the option for which foot contacts the ground in the live screen. This is a nice feature for reviewing data after a session is over. These can be done in place or with horizontal translation.
Sport-Specific Tests
Here, the coach is only limited by their creativity. I have provided a couple of options, but once again, the contact grid can provide valuable data itself or provide another layer coupled with additional data to help drive programming decisions.
Short Approach Long Jump
Video 17. I am still in the infant stage of using this type of test, but I know it will be one we use often once we are back in season. I plan to combine the data obtained and compare it to the IAAF Biomechanical Reports. Elite women show a strong correspondence to elite high school males. Short approaches of the pole vault and other jumps are certainly doable.
Change of Direction
Video 18. You could implement any change of direction test (such as a 5-10-5) here, assuming the athlete stays within the grid. I would advise chalk lines, tape, or field/court/track lines on the ground to assist the athlete with steering. Note: It is necessary for the athlete to have no interference with the grid in order for it to register the next contact. Because the feet may stay close to the ground (such as a shuffle) or there may be minimal flight time (the left foot contacts the ground while the right is still on the ground), the contact grid may not capture every contact during these types of tests.
Too Much Tech?
I think the 15 tests shown, combined with the extra layer of data provided, make a contact grid the next logical purchase after a timing system, says @HFJumps. Share on XI have engaged in numerous conversations with colleagues who coach at the high school level regarding technology and whether it provides signal or noise. Many own a timing system that costs in the low four figures. Assuming accuracy and workflow are not an issue, the question that we would need to answer is: Does the value of the contact grid exceed its cost? I think the 15 tests shown, combined with the additional layer of data provided (which can assist in programming decisions and technical adjustments), make a contact grid the next logical purchase after a timing system.
Since you’re here…
…we have a small favor to ask. More people are reading SimpliFaster than ever, and each week we bring you compelling content from coaches, sport scientists, and physiotherapists who are devoted to building better athletes. Please take a moment to share the articles on social media, engage the authors with questions and comments below, and link to articles when appropriate if you have a blog or participate on forums of related topics. — SF

