Finding the Measures That Matter with Sport Tech


Summary
Last year, we may have seen a critical mass of various levels of team sport making purchases. However, many of those buyers, as well as many coaches who already use sport technology, need a better understanding of the information they collect on athletes. In some cases, they need to rethink the measurements they collect, and…
There is no doubt that 2017 was a big year for the discussion and adoption of sport performance feedback technology. For some, the talk may seem like old hat, but I think last year saw a critical mass of various levels of team sport making purchases. From high school through elite levels, teams are buying force plates, velocity-based training (VBT) barbell trackers, smart medicine balls, timing gates, and the list goes on.
Tech purchases have gotten ahead of the understanding of what to do with their valuable feedback, says @Scott_Damman. Share on XHowever, I think there is a caveat to this phase of adoption. The purchases of feedback tech have gotten ahead of the understanding of what to do with the valuable information. Many have purchased the Ferrari, but do not know how to drive it. Or, as we say out where I live in rural Colorado, the cart has been placed before the horse.
Don’t Get Caught in the Past: Update Your Metrics
I get most of my support calls from high school coaches who made a VBT tech purchase and now need to know what to do with the information. If you spend the money on a Ferrari, you damn well need to know how to drive it, right? The point is, the recent investments on the table will demand that we step up our collective game to figure out how to create best practices around the array of tech options.
The part that alarms me a bit is that much of this sport tech has been around for decades, but we are still living in the 1990s with its applied use. The big-budget teams have had access to these tools (for example, VBT tech) for more than 20 years and still often get stuck on one metric: full range-of-motion concentric AVG speed. In other words, the VBT mullet of metrics.
Let me share the athlete experience I had nine years ago—the experience where the light bulb came on regarding the measurements that may really matter. In 2008-09, I was working with a National Alpine team, applying the Myotest device for jump performance baselining and fatigue monitoring. For those who may not be aware of the Myotest, which is no longer available, it was a Swiss company that created the first field-use and wireless accelerometer sport feedback tool. The product was pioneering, and much of what you see today related to team VBT applications (estimates of 1RM, force/velocity profiles, power profiles, etc.) originated with the Myotest.
Video 1. The Canadian Cowboys in 2009, testing muscle stiffness properties—kilonewton meter (kN-m)—using the Myotest plyometric jump protocol. Here is a two-time World Champion hitting 67.3 kN-m. Matt Price (second from the right), who is currently the L.A. Kings (NHL) Head of Strength & Conditioning, was the Director of Sports Performance for Alpine Canada at the time. I’m on the far right.
One of the monitoring protocols set up by Matt Price, the Alpine Director of Sport Performance (now with the NHL’s L.A. Kings), was a body weight squat jump. This called for strict adherence to the protocol for testing: static position with NO countermovement. They used this protocol, along with a few other jump protocols (like you see in Video 1) to monitor fatigue during the grueling World Cup season. I met up with the team when they came through Colorado (Beaver Creek) for a World Cup stop, and assisted with some data collection and analysis. In 2009, this stuff was very new, so Matt and I spent a good deal of time “talking shop,” and Matt was forward-thinking in how he could best apply this feedback.
Understand which metrics or analysis from an athlete’s #data represent the difference-making stuff, says @Scott_Damman. Share on XI was always curious to understand how the Myotest data helped define the athlete. In other words, which metrics or analysis I could pull from the instant feedback that represented the difference-making stuff. Instead of looking athlete to athlete, I started with a wide comparison of a world-class ski racer vs. a regular Joe: comparing the two-time World Champion skier in the above video to me.
The Surprise Results and the Light Bulb
You can see the comparison report below: Test 1 is me, Test 2 is the athlete. If you look between the two yellow arrows, you will see our comparison results for power, concentric force, speed, and jump height. Today’s mainstream performance feedback conversation, especially VBT with the barbell, definitely tilts on the side of speed (meters per second), along with power (watts).
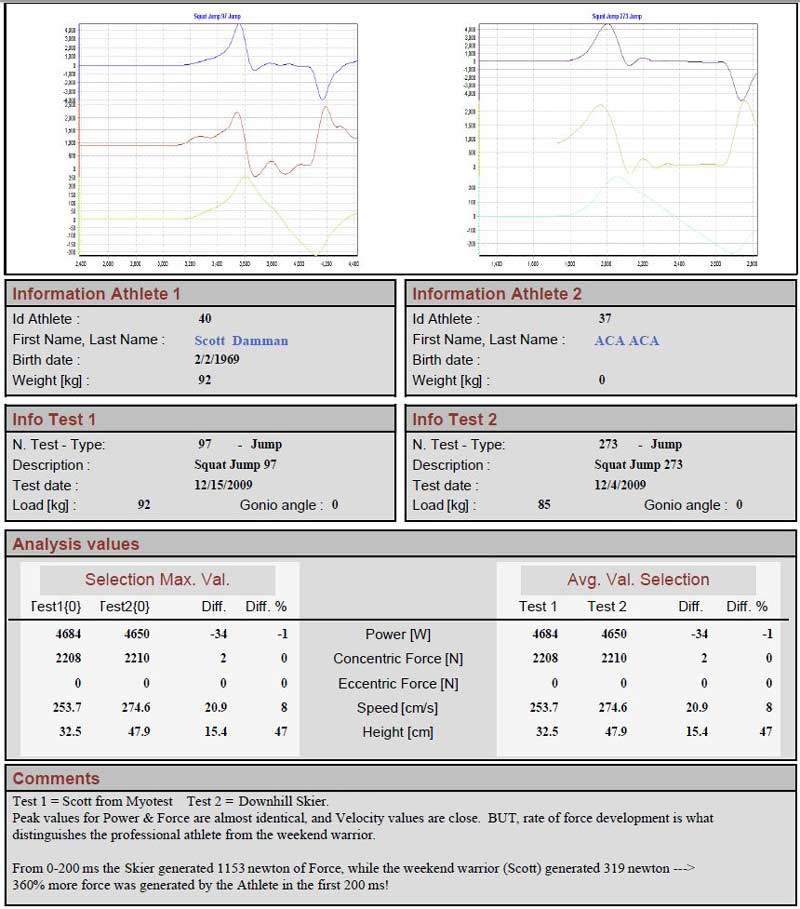
If we only look at the two popular performance indicators, speed (m/s) and power (watts), for this comparison report, we see that the power output was virtually identical and the difference in speed was 8%. The concentric force output was identical, with 0% difference. On paper, these two guys look very close. Comparing speed and power is a fairly typical performance evaluation these days. However, these comparison results sure did not make much sense to me, and they certainly did not help answer my question of finding the measures that matter; measures that define the true athlete. But, upon digging a bit deeper and analyzing the force curve, the picture starts to get clearer.
The black arrows in the report point to two very different-looking forces curves. Using the Myotest software, I set triggers to look at force production from 0-200 milliseconds (ms). Instead of looking at the full range-of-motion jump outputs, the 0-200 ms time “window” represents rate of force development (RFD). The elite athlete created 1153 newton during that time window, while the regular guy created 319 newton. The athlete generated 360% more force within the initial 200 ms of the squat jump. Light bulb. The takeaway is that this RFD measure may be a measurement that really matters.
It’s Time to Update and Evolve
With the recent and rapid adoption of sport tech feedback tools, let’s make sure the conversation and modern application make the purchases worthwhile. It is the responsibility of the thought leaders and innovators to help the entire market evolve.
Last year I wrote, “Is It Time for Coaches to Rethink Velocity-Based Training?,” with the intent to spur conversation about the measurements that matter and redefine how we apply sport tech feedback. Specific to this case, velocity-based training. Since this article was published, the public discussion has been alarmingly low. The VBT mullet still reigns, and that, quite frankly, is a bit of a sad state of affairs.
