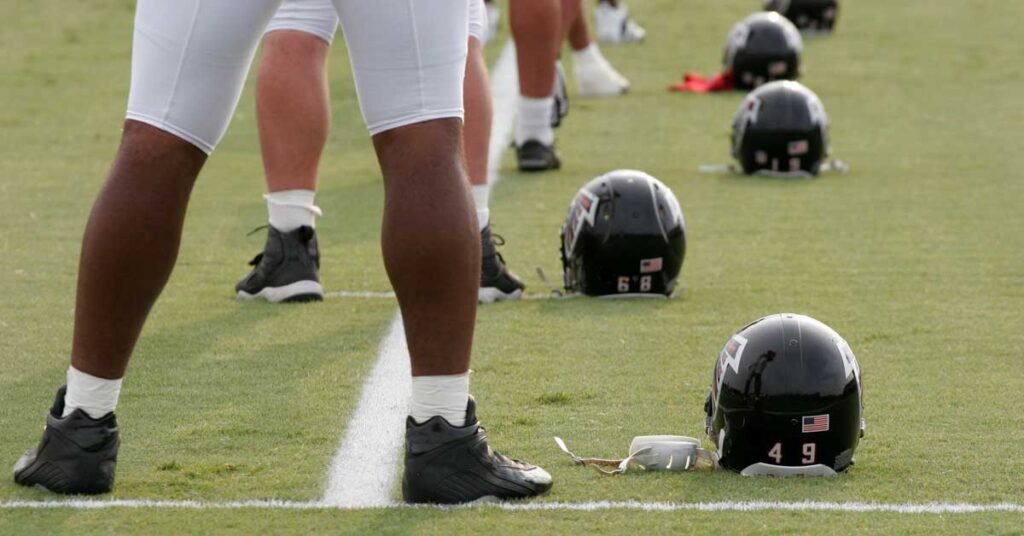
When I first walked into the weight room at the University of Nebraska Kearney (UNK), I was greeted by an exciting, newly renovated space. The school had just purchased 18 Samson racks, complete with new Olympic bars and bumpers at each. I was, however, surprised by the complete lack of technology being utilized in the weight room. I’d been hoping to see at least a few pieces of technology: perhaps a jump mat to monitor readiness or a few old Tendo units to use on occasion. We had nothing—not even a TV.
Clearly, I was in a different world than the more privileged one I had been in before. I knew then, with limited resources to go around, that it would be a challenge to convince our administration to help usher in a new age of strength and conditioning at UNK.
I knew then, with limited resources to go around, that it would be a challenge to convince our administration to help usher in a new age of strength & conditioning, says @dgleaszn. Share on XLeading up to my graduate position at UNK, I’d been fortunate to learn how both Husker Power and Prentiss Hockey Performance (PHP) use technology to enhance athletic ability. Technology in our field has absolutely exploded, and I did not want to be stuck in an analog world after seeing how high tech was successfully leveraged at my previous stops along the way.
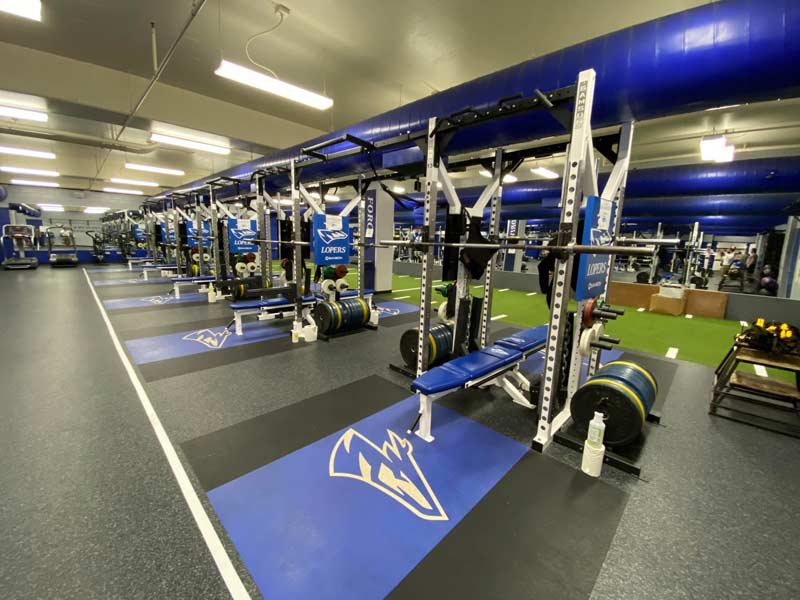
Upon arriving at UNK in 2020, I pushed hard to get a velocity-based training system installed in the weight room, and last year we were finally able to get it done. Luckily, that was just the beginning. Even at the D2 level, we have found a way to integrate more technology into the weight room without overstretching our limited budget. We utilize a combination of VBT, GPS, jump mats, body composition testing, and recovery wellness questionnaires to shape our programming and philosophy.
Technology can add so much value to any program, at any level. With a well-thought-out, strategic approach to integrating technology into the weight room, coaches at schools with any type of budget can leverage technology to make more informed decisions and accelerate athlete development.
The purpose of using technology with our athletes is to make informed decisions, but the implications are deeper and more expansive. Our goal is to create an integrated approach to sports science and strength and conditioning. At the surface, we can use many data points to see how athletes trend from day to day or week to week, but that’s just one piece of the puzzle.
By assembling more puzzle pieces from other data sources and technology, we can unveil a bigger picture of where our athletes stand and what they need. For example, at one point last season, our sports science team alerted the football staff of some alarming trends in our players’ recovery and wellness surveys during the week. The football staff then adjusted their practice plans to allow for more recovery leading up to game day that week, and we were able to come away with a key win on the road.
Forge Athletic and Academic Partnerships
In addition to the football team, we use technology with many of the Olympic sports on campus. Managing countless data points while also coaching on the floor for hours each day can be quite a challenge. We have been lucky enough to get the additional help and support we need by partnering with the Kinesiology department on the academic side of campus.
Our greatest resource is the people we work with, and we were able to work with some superstars last year who provided the strength staff with much-needed support. Dr. Joe Eisenmann helped us integrate and leverage new technology before leaving for his current position as Head of Strength and Conditioning at IMG Academy. Our strategy for data management was many hands make light work. We were able to utilize undergraduate students who needed hours for internships and data for research projects to collect and manage our data. This ability to use undergraduate students allowed us to focus on coaching while still gathering valuable information during workouts and practices.
If you’re looking to establish a sports science program on a budget, make sure you take full advantage of all resources on campus. Develop a working relationship with academia, says @dgleaszn. Share on XI can’t stress enough how important it is to develop a working relationship with academia on campus—they are typically a free resource that will jump at the opportunity to help athletics. Plus, most of the time you’ll come away smarter after getting to know those involved. So, if you’re looking to establish a sports science program on a budget, make sure you take full advantage of all the resources on campus first. They might even be willing to share their equipment if you’re lucky.
Velocity-Based Training System
Out of all the technology we’ve utilized in the last year, my favorite is our velocity-based training system from PUSH. At UNK, we decided that an accelerometer-based VBT system was more practical and budget-friendly than a system that used cameras or linear encoders.
Initially, when approaching our administration with the idea, we were a bit nervous to ask for an expensive system that they might not see as necessary. Before going directly to our AD with what we wanted, we made a detailed presentation explaining all the potential benefits of a VBT system and how it could be leveraged. We then presented our ideas to the sport coaches and the administration.
We provided them with three options: a cheap option; the one we wanted; and then, of course, the most expensive, top-tier option. That way, asking for a $20K system would seem more practical than asking for a $40K system. After a couple more conversations and further explanations of the possibilities, we ended up with the one we wanted.
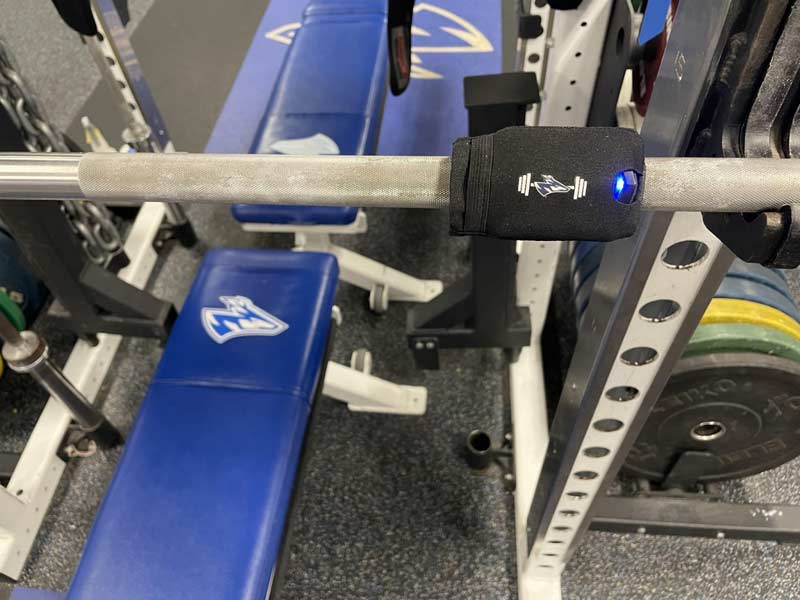
Thus far, we’ve primarily used our sensors with football and track & field. We let every athlete on our football team use the VBT sensors immediately; with our track team, however, we held off until our athletes demonstrated strong technical ability in each of our main lifts.
I recommend this approach: start by implementing your VBT system with a smaller portion of athletes, and then let the rest of the athletes use it when they’re ready. This makes it easier to manage the few systems being used while also coaching. Then, eventually, the athletes who have learned how to use the technology will be able to help teach others how to navigate it.
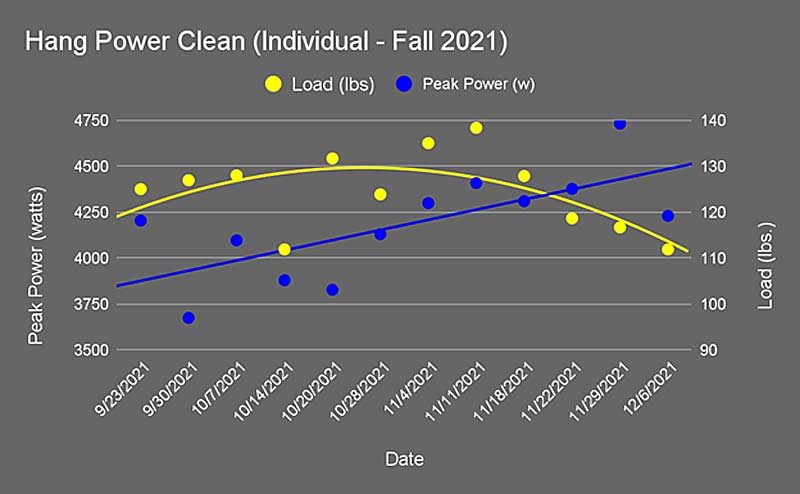
We use VBT to improve our athletes’ power production abilities, and so far, we have tracked strength and power exercises ranging from squats and trap bar deadlifts to hang power cleans and snatches, and every exercise in between. In the last semester, we collected data for more than 5,000 reps of hang power cleans from our track & field athletes alone.
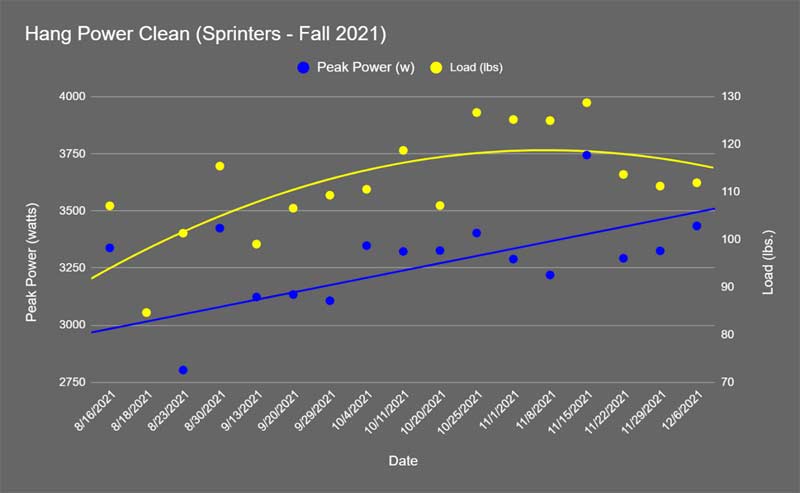
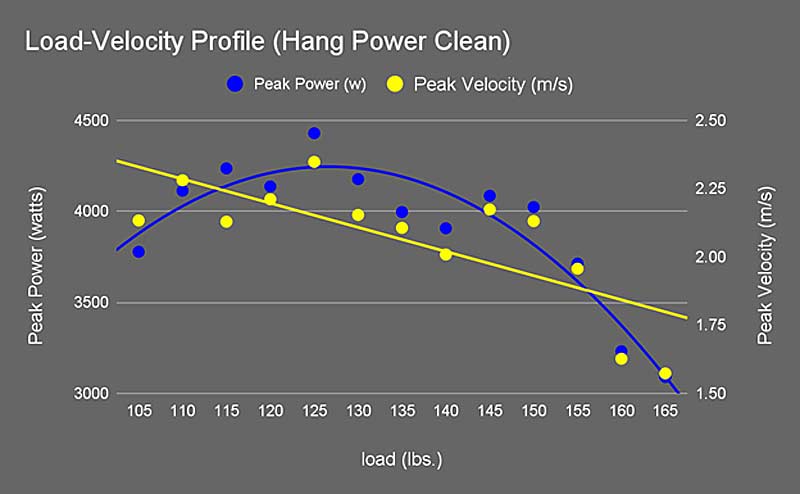
We also developed load-velocity profiles for every athlete on the track team and used that information to set up more individualized peaking blocks leading up to the end of the fall semester. We used the graphs to determine what weight and velocity each athlete should target to reach their peak power output in the hang power clean exercise. Our findings indicated that peak power output usually ranges from 70–80% of their 1RM, which is consistent with the already established research.¹
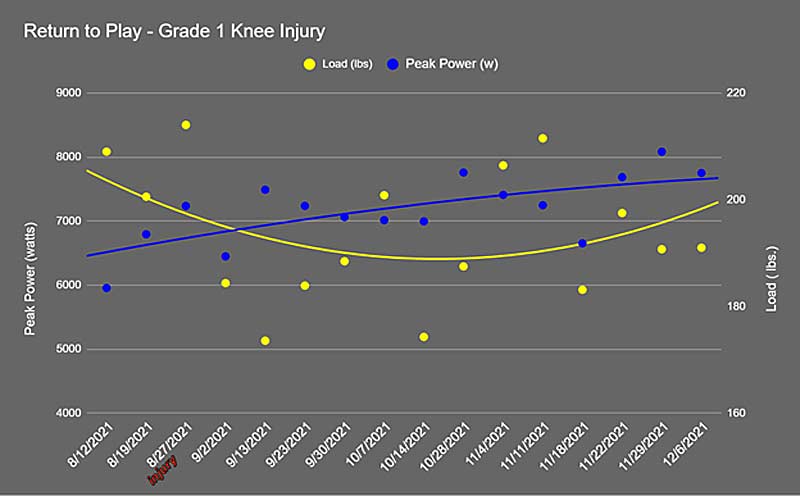
In addition to preventing unnecessary injuries, we were able to track return to play programming and metrics. With our PUSH system, we can see where an athlete was prior to an injury and then track their progress on their way back to competition.
Overall, this velocity-based system adds an incredible amount of value to our strength and conditioning program. The athletes were quick to grasp the ins and outs, and it’s a great driver of intent and performance.
We try to foster a competitive environment by posting a live leaderboard that ranks the athletes based on who has the fastest peak velocities for Olympic lifts during each workout. Taking it a step further, we hand out a thick gold chain to the person with the fastest peak velocity on their Olympic lifts each day. This gives the athletes a sense of pride, fuels their competitive edge, and lets everyone know who the top performer is that day. Athletes have gotten into this new tradition and want to win. Sometimes, in the middle of a busy session, athletes will ask where the chain is or who’s won it—the system really takes things to another level.
By showing them the value our work with this technology brings to the program, it becomes easier the next time we ask administration for extra funding or new equipment, says @dgleaszn. Share on XPerhaps the most important result of the VBT system was that we were able to take our data to our head coaches and athletic director. By showing them the value that our work with this technology brings to the program, it becomes easier the next time we ask the administration for extra funding or new equipment. That’s where technology has a huge impact—it shows just how much value your performance team brings to the table.
Jump Testing
Last year, the staff at the Nebraska Athletic Performance Lab (NAPL) turned us on to the idea of integrating our KPI testing into weekly training sessions. In this way, testing is training, and training is testing. In addition to the data gathered from our VBT system, we also regularly conduct jump testing to track athletic performance. We utilize the Just Jump System twice a week, measuring both the countermovement jump (CMJ) and 4-hop test during the week.
- The CMJ test is a reliable measure of lower body power.²
- The 4-hop test measures an athlete’s ability to use stored energy.³
We also use both as proxy tests to monitor readiness throughout the season.
We learned that the most efficient way to conduct jump testing was to bake it into our warm-up before lifts and used undergrad research students to record and monitor the data on Google Sheets. Having undergrad students conduct the jump testing frees us to coach on the floor, which is essential with teams coming through every 30 minutes for several consecutive hours.
We learned that the most efficient way to conduct jump testing was to bake it into our warm-up before lifts and used undergrad research students to record and monitor the data on Google Sheets. Share on XIt only takes about an additional five minutes to conduct jump testing during a training session, so in the grand scheme of things, it is a small time commitment. We test the CMJ at the beginning of the week when we train a longer or slower stretch-shortening cycle (SSC). Then, in the latter part of the week, closer to competition, we conduct the 4-hop test in conjunction with the training of faster or shorter SSCs. I like this schedule of jump testing because it potentiates the athletes for their training that day and perhaps for competition as well.
Similar to the VBT data, we were able to monitor trends in jump testing through Google Sheets. The data that our undergraduate students collect is graphed and combined with the data from the VBT system to give us a clear picture of how an athlete is progressing throughout the semester.
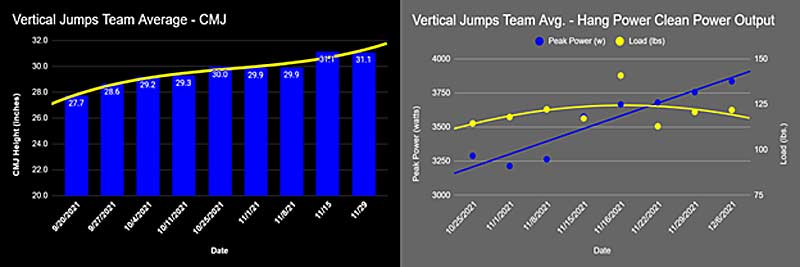
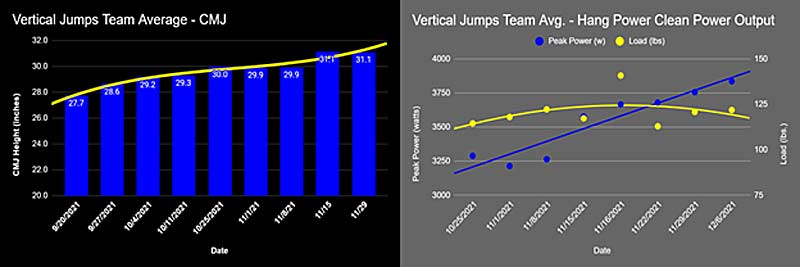
Jump testing is a good indicator for athletes who may be struggling and opens the door for conversations about what athletes are dealing with and how they’re feeling. From that point, it’s easier to adjust. At one point last semester, we noticed one of our best track athlete’s CMJ numbers going down from week to week. Having the objective data to spot a negative trend allowed us to have a conversation with the athlete and their coach before things got progressively worse. After talking with their event coach and making some programming changes, we were able to get them back on the right track.
Having the objective data to spot a negative trend allowed us to have a conversation with the athlete and their coach before things got progressively worse, says @dgleaszn. Share on XRecovery-Wellness Survey
In addition to the insights provided by weekly jump testing, we also utilize a recovery-wellness dashboard to monitor our athletes’ health and habits. With this dashboard, we can monitor trends from day to day or week to week. We track a multitude of metrics across the semester, ranging from body weight to residual soreness. Like the jump testing data, we can visualize trends for both the team and the individual. Our dashboard collects data through Google Forms that is then automatically filtered into Google Sheets and graphed.
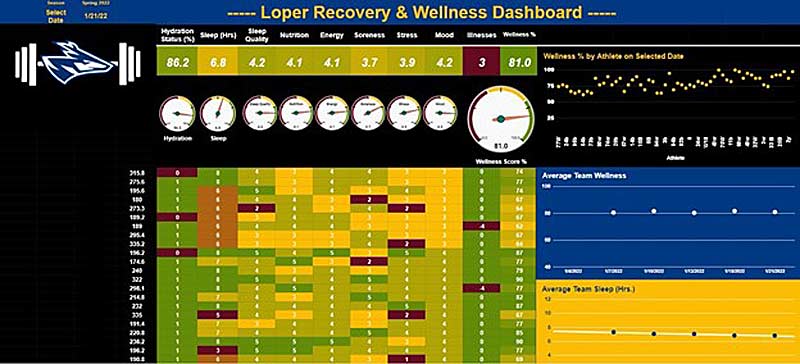

We found the best way to use the dashboard is to have our athletes take the recovery-wellness survey right as they come into the weight room. We have iPads stationed at every rack so they can take the survey, which only takes about two minutes to fill out. This allows us to see their survey results before the beginning of each training session.
Usually, there are a few athletes with undesirable results that need to be addressed. Sometimes we have a hunch that something is off with an athlete, and the survey gives us the objective data to support our coaching sense. As with our jump testing trends, these results are a good conversation starter that allows us to check in on athletes’ well-being and address issues before they become a bigger problem.
For example, the thing I have been stressing the most is the importance of getting a full eight hours of sleep. They need this constant reminder, because college kids aren’t great when it comes to their sleep habits. Simply put, the survey takes the guesswork out of the important questions around sleep habits, nutrition, soreness, mental and physical well-being, etc. The dashboard really helps us stay on top of the smaller details that have a big impact outside of the weight room.
GPS
Aside from these “big three” technology tools that we use daily, we also use a GPS system from SPT. This type of technology can be extremely expensive, which is another reason creating a relationship with academic departments on campus is incredibly important. They are a resource that can provide so many benefits if you’re willing to do a little in return. Fortunately, the Kinesiology department on our campus was willing to invest some of their own funds into sports science equipment for teaching and research purposes, including this GPS system.
The GPS system is a massive resource when used for conditioning. For our football team’s summer conditioning program, we were able to prepare for the exact demands the players would see in games and practice. The big advantage with a GPS system is sharing the data with the coaching staff. It was a great tool to help them get a sense for what a weekly practice schedule should consist of and how to taper volume throughout the week.
The GPS system is a great tool to help coaching staff get a sense for what a weekly practice schedule should consist of and how to taper volume throughout the week, says @dgleaszn. Share on XOur main message to the coaching staff was to ensure players weren’t playing “multiple games” in one week; meaning, they shouldn’t be running the equivalent of a full game’s distance during practices. Were we perfect on that? No. However, we made some much-needed changes after what we saw in the spring season.
As a strength coach, I’m not trying to dictate what they do at practice. My goal is only to inform the coaches so they can make the best decisions for their teams. If I’ve done that, then I have done my job.

What the players really liked about the GPS system is that it helped settle some longstanding disputes. We were more than happy to help with that problem. They don’t really care all that much about how much hard running they do in practice or conditioning, but they do care about who is the fastest person on the team. The top speed data is fun to look at and provides us with a much-needed KPI.
The athletes like to stop by our office after a speed session or a practice to see who the fastest player was for the day. Similar to the VBT system, the players get into the data, and the competition helps drive improvement. Our Director of Sports Performance, well known as “Sarge,” always says “the greatest equalizer in all of sports is speed.” While that may be disputed, it is cool when your starting D-lineman learns that he can hit a top speed of 18.6 mph.
An Integrated Approach
Another piece of tech we have used this year is a Dashr laser timing system, which we leverage to create force-velocity curves with the calculations published by JB Morin4. This provides valuable information on an athlete’s ability to accelerate and maintain their top end speed. Couple that with data from a BIA scale and the other technologies we use, and now we have a fairly complete athlete performance profile.
With a profile, we can start to establish normative data that should allow us to program more effectively for certain individuals. There’s no reason a 300-pound lineman should be doing the exact same training program as a 180-pound wide receiver. In this way, technology helps us see the importance of individualized training despite having a small D2 staff where it may be more challenging.
Although I have only been doing this for a few years, I think there is immense value in having an integrated approach to strength and conditioning, technology, and sports science. Technology can add so much value to your program and help prove your credibility and worth to an administration that may not understand what you’re doing or the value of your department. It can also be an incredible driver of performance and intent in the weight room and on the field.
Technology can be an incredible driver of performance and intent in the weight room and on the field, says @dgleaszn. Share on XThe right tools can eliminate the need to schedule testing days or weeks, allowing you to keep moving forward with training; those tools can also help keep athletes out of the training room if leveraged properly with autoregulation. Technology also provides valuable data in both the long and short term that can help remove guesswork from programming. Not to mention, it’s quite the recruiting tool.
Let’s face it, most of the time at the D2 level of college athletics, we aren’t able to recruit the same talent as the Alabamas and Georgias of the world. So, it’s vital that we develop athletes for our program’s success. When incorporating technology, I have two recommendations:
- Start with a single piece of technology, whether a Just Jump System or a full-on VBT system. Then leverage it to the best of your ability. If you do it right, more doors will open.
- Reach out to those around you for help. Especially those in the academic side of campus. The worst they can say is no.
Since you’re here…
…we have a small favor to ask. More people are reading SimpliFaster than ever, and each week we bring you compelling content from coaches, sport scientists, and physiotherapists who are devoted to building better athletes. Please take a moment to share the articles on social media, engage the authors with questions and comments below, and link to articles when appropriate if you have a blog or participate on forums of related topics. — SF
References
1. Takei, Seiichiro, et al. “Is the Optimal Load for Maximal Power Output during Hang Power Cleans Submaximal?” International Journal of Sports Physiology and Performance. 2020:15(1);18–24.
2. Nuzzo, James L, et al. “The Reliability of Three Devices Used for Measuring Vertical Jump Height.” Journal of Strength and Conditioning Research. 2011:25(9);2580–2590.
3. Davenport, Shane. “How Coaches Can Maximize Their Just Jump System.” SimpliFaster, 17 Apr. 2020.
4. Morin, J. B. (2018, June 6). A spreadsheet for Sprint Acceleration Force-velocity-power profiling. JB Morin, PhD – Sport Science. Retrieved December 9, 2021.


Fascinating work and article Dalton!! You are truly an expert at what you do!!
Very impressed. Keep up the good work!