The Titan Sports System defines GPS load as “a scoring value accounting for the intensity and duration of effort based on GPS readings. The score is weighted with an exponentially increasing coefficient.” In the simplest terms, this differentiates the level of intensity of each yard by assigning greater weight to those yards at higher speeds. Those yards are then examined within the time they took place, giving us a look at the actual density of the yardage. For instance, 3,000 yards with 2,500 less than 6 m/s and 500 greater than 6 m/s will score lower than 3,000 yards with 1,500 below 6 m/s and 1,500 above.
This metric digs deeper than simple volume into what is happening with our high school football athletes. For reference, you will generally see a much greater GPS load from a receiver or defensive back than any other position. This is due in large part to the percentage of yards they cover at high velocity and the distance they cover at those speeds being higher than others because of the tactical and technical roles they play within the sport.
Initially, I tracked both total and high-speed (80%+) volume—this is an effective and valuable way to prepare. GPS load brings total intensity over time into one data point. Volume is still something to pay attention to, as we have had athletes accumulate as much as 14 miles of volume in a summer passing competition over the span of 5–6 hours. That type of number, even at walking speed, can still be a factor. Load gives us a more accurate picture of the athletes’ actual activity levels.
GPS load brings total intensity over time into one data point…Load gives us a more accurate picture of the athletes’ actual activity levels, says @YorkStrength17. Share on XHere, in part 2 of my article series on using GPS to prepare high school football players, I’ll look to expand on some of the basic procedures we use with GPS. In the first installment, I discussed the dilemma facing coaches in accounting for the highly variable training gap of the athletes once the voluntary off-season ends and mandatory practices begin. How can we use GPS as a guide to ensure our athletes have prepared for the workloads they face while not pushing them past the point of meeting those demands?
In part 1, I focused on using individual and positional volume as a place to begin ensuring optimal work capacity preparations. Now, I will dive into using GPS load to increase programming precision by bringing intensity and time into the equation. Using this metric has allowed us to become even more precise in preparing our athletes for the demands of not just playing but preparing for sport.
[adsanity align=’aligncenter’ id=11155]
GPS Player Load
The charts below give a snapshot of how total volume and GPS load do not always correlate directly based on the athlete. The chart on the left shows the total practice volume over 2.0 m/s in a session. The chart on the right represents the GPS load with athletes in the same order. This is particularly helpful for athletes who play on both sides of the ball. One hundred yards walking on the sideline for a one-way player is different from that yardage for a player who plays both sides.
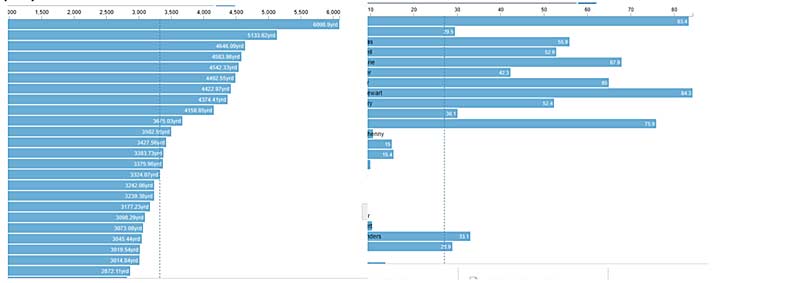
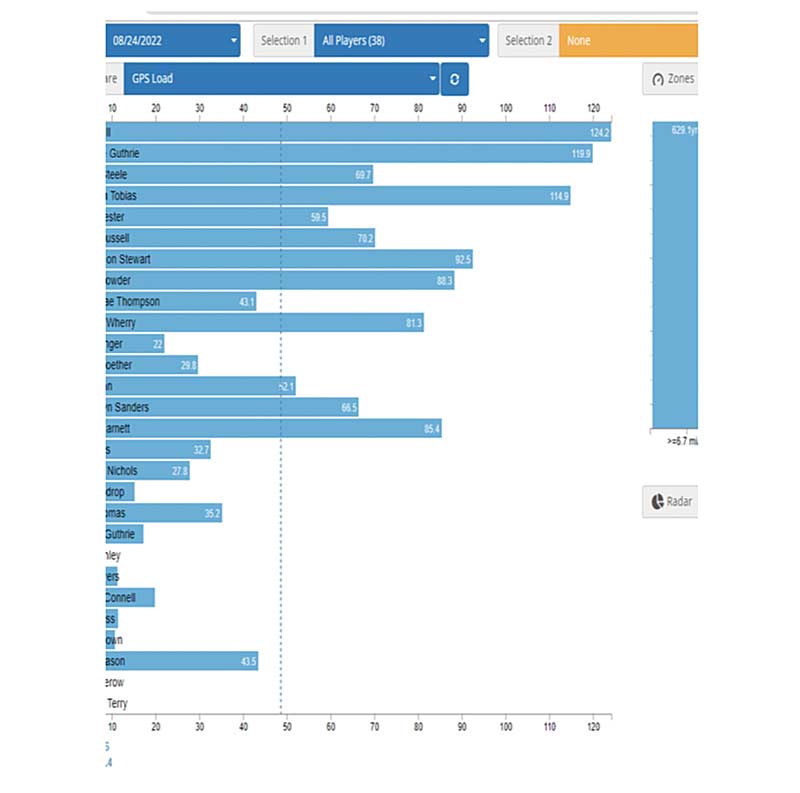
Another factor is how much a player on the sideline may cover in yardage doing things like walking to get water while a two-way player is on the field. The volume may be similar, or even more, but the intensity is much different. In both of the charts above, the top athlete is a two-way player. The player with the second-highest load (83.4 to 84.3) is, in fact, the seventh player in total volume. The load information adds depth to the process of using the data to guide us. It shows how much work an athlete has done in a session and allows us to compare that to the work levels of previous sessions.
We use GPS load not just to help guide our day-to-day sessions but also to ensure our loads do not have a great variance week to week. If they do? We need to account for that outside of sport. Our weekly pattern that has developed over the past four years for each day’s average player load is below.
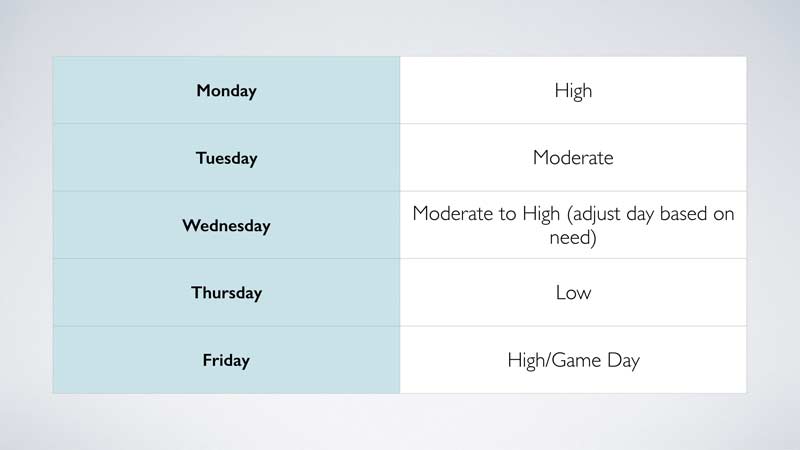
The trick for me, as a non-sport coach, is that I don’t have a direct influence on actual practice intensity. This is not a designated high-low plan. Our data is organically developed based on the coaching staff’s typical practice plan.
It is my task to use the data to educate our coaches on the impacts of day-to-day intensity on our team’s recovery and ability to produce maximum outputs of speed, acceleration, and deceleration on game night. The goal is consistent workloads avoiding peaks and valleys that have been recognized to increase injury potential. This is why GPS is so important! If I assumed (guess) that the above schedule is how our team intensity is, I’d be wrong many times. Instead, I look at the data and am able to adjust our non-practice workloads.
For the skeptics who believe GPS will always slant toward ‘less work,’ that’s definitely not the case. Less or more isn’t the goal; focusing on optimal loads is, says @YorkStrength17. Share on XFor the skeptics that believe GPS will always slant toward “less work,” I want to add that is definitely not the case. This process allows me to suggest adjustments to our staff for the next practice to fill the need or offset higher-than-expected load levels. Less or more isn’t the goal; focusing on optimal loads is. My suggestions have ranged from four to six 20-yard sprints (acceleration), to asking the defensive staff to add a 5-yard burst followed by a full-speed 180-degree wide base crossover (high-speed deceleration), to running fewer deep routes in drills and pass skell. Once you have your process, the adjustments become clear.
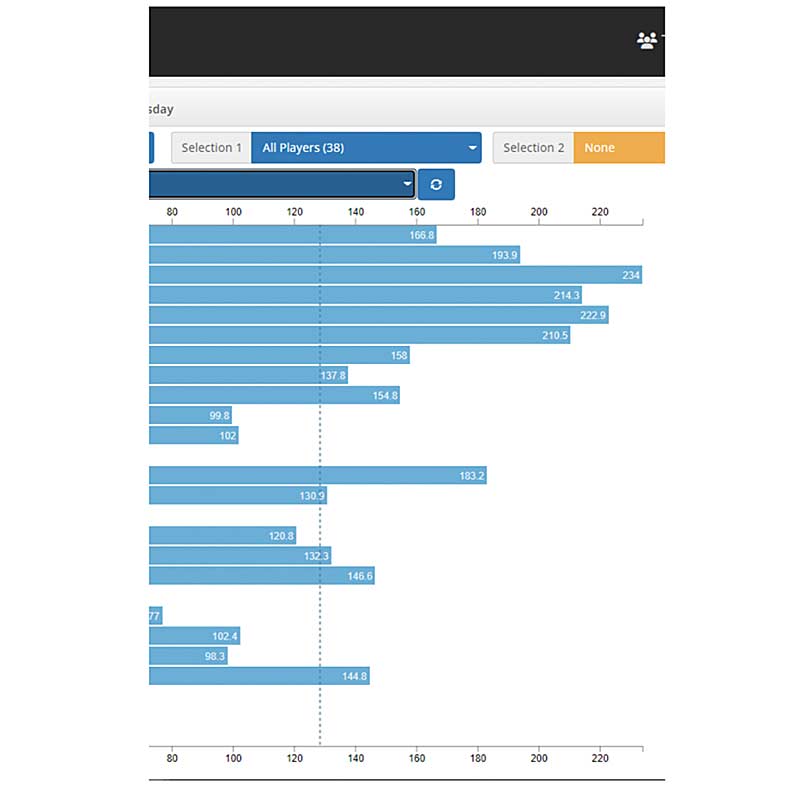
Above is an example of practice in camp with a GPS load much higher than a typical mid-week session for most players (below).
We use the data we collect not only to guide this acute weekly schedule but to ensure the chronic loads do not drop or increase significantly from week to week. For example, we want the upcoming Monday not to be a significant drop-off from the previous Monday; if it is, then we need to take a deeper dive into the high-speed distance, accelerations, and decelerations to determine precisely what buckets were shorted. We then can use time outside of sport to fill those needs.
Each day of the week varies due to the tactical and technical aspects of the practice schedule. As strength and conditioning coaches, this is where we must lean on data collection from previous seasons to help guide our process. This is also where trust and a relationship with your football staff play a vital role. I never suggest wholesale changes to practice—that is unrealistic and unsustainable, as the sport coach needs to be the driver of that process. Our role is to look at past data, get a picture of the demands, and use this to make subtle suggestions that can be easily instituted.
What I found in the three-year historical averages for our situation was:
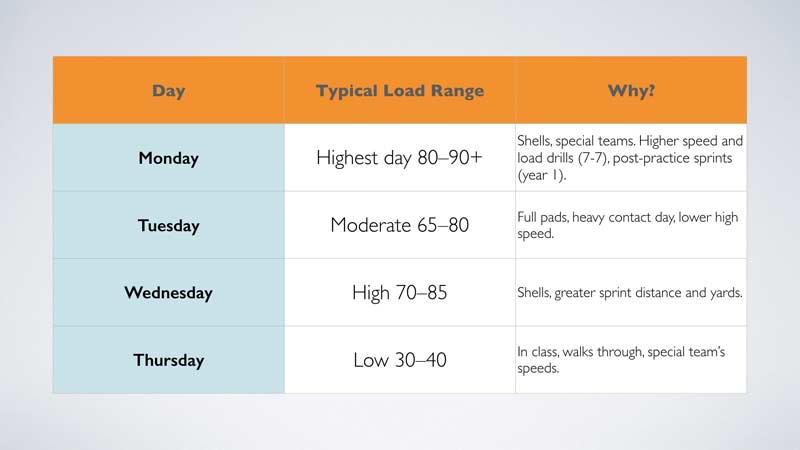
Looking at actual game demands, we see our peaks being in the low 200s and our average being in the 150 range. Since the evidence-based Acute:Chronic Workload Ratio suggests that the further past 1.5x load an athlete goes, the increased risk of injury,1 I decided to set my initial goals for the week at 225–300 total. From there, we have been using a combination of sprint speeds, peak acceleration, and “coach’s eye” to adjust as the situation demands. We found our “sweet spot” to be in the 200–260 range.
One thing you must consider when using GPS to guide practice adjustments is that each team, each coaching staff, and each season will present a unique situation, says @YorkStrength17. Share on XOne thing you must consider when using GPS to guide practice adjustments is that each team, each coaching staff, and each season will present a unique situation. You and the football staff must develop your own process based on those and many other factors. You must collect historical data from your team’s plans and tweak them within the parameters your coaches are comfortable with.
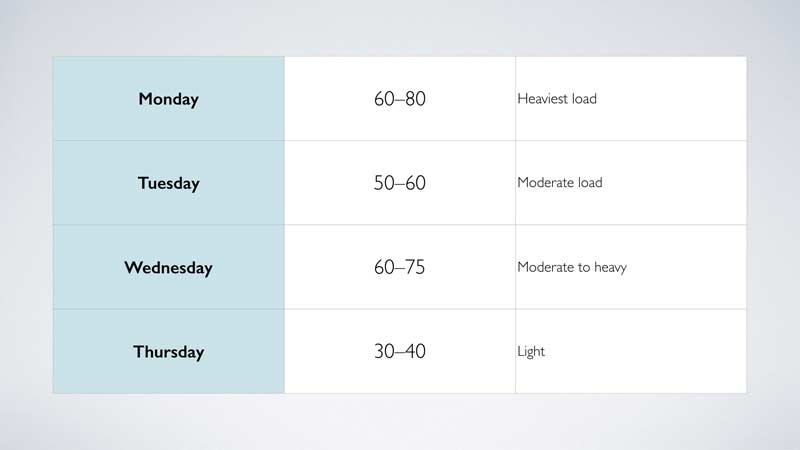
In my ideal situation, Monday is always a bit of a gamble because kids don’t really rest as much as we hope on the weekend. I’d keep this as a moderate day. Tuesday would be the heaviest load. Wednesday would be our adjustment day, and Thursday would be our lighter day.
Based on our staff plan, the following is the reality that makes the most sense for us as of the 2022 season.
Here is an example of our last three weeks, with black being the optimal load, red higher than scheduled, and blue lower than expected:
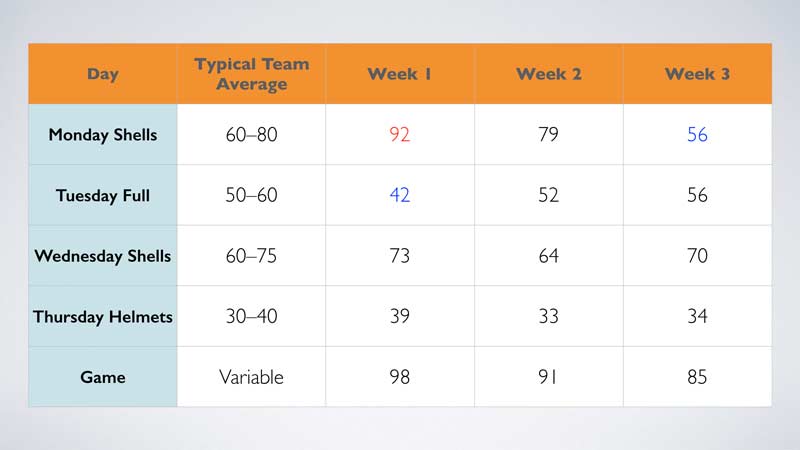
As we look over the chart, we can see a perfect example of day-to-day adjustments in week 1. Monday was one of those days that football teams sometimes have—it was longer and had much more high-speed movements. Reviewing practice with our head coach showed that our team and group sessions were extended by multiple plays each. There was also an extended special team session.
Those are all factors that are out of our control. Our job in this situation isn’t to attempt to change the way our sports coaches coach. Instead, we need to examine the results and do our best to adjust going forward in a way that culminates in our goals being successfully met.
I control Tuesday in class—this gives me a great deal of influence on our actual workload. We used Tuesday as a lighter day in our class “fill the bucket” session and in practice. However, as can happen, it ended up being a little too low (although the in-class GPS load is not calculated, which is one unavoidable hole in our process that I will discuss later in this article). Wednesday was back up a little, as the needed adjustment was made, and Thursday was higher than normal but not out of the norm by much.
Week 2 was a more typical workload. Week 3? We had a heat-related shorter practice. What isn’t reflected? We adjusted our Tuesday “fill the bucket session” to be less “max velo” centered and instead did higher volume high-speed acceleration and deceleration drills, including small-sided games. Because of the turnaround time for syncing units and washing vests, Tuesday’s class was educated guessing. We looked at what was in need and attacked it as optimally as possible. Wednesday was once again adjusted to offset a need. Thursday was typical, and Friday was a low-workload game.
The GPS data from that particular game showed less than normal max velo or high-speed acceleration. It was a defensive shutout, so very little was needed. That will factor into what we do the following week on Tuesday as well. We let the data guide the programming. Our goals for the next week? Hope for a typical Monday and adjust as needed each day to ensure we don’t have any significant increase or decrease in workload.
I cannot emphasize enough how important trust is between you and the football staff for this process to be effective. I had to go to our head coach and explain in depth why any type of running post-practice needed to be dealt with in a targeted way. If the data says we have filled our need for sprint yardage, running ten 40-yard dashes is counterproductive.
He had the combination of trust and a growth mindset to look at what I was showing him and see great value in it. If we have a deficiency in high-speed deceleration, and I ask our defensive staff to coach a hard, full-speed change of direction in drills, I must know they trust me enough to take that recommendation. Trust and willingness to comply and make these adjustments is the ONLY reason I spend the time and effort on GPS.
Using GPS load is just one of many ways to help your coaches and athletes be shielded through exposure to the demands of their sport, says @YorkStrength17. Share on X[adsanity align=’aligncenter’ id=11132]
Using GPS load is just one of many ways to help your coaches and athletes be shielded through exposure to the demands of their sport. It is part of my process, but it may or may not fit your situation or needs. That is not right or wrong—it’s perspective-based problem-solving. I encourage you to jump into the GPS pool and begin collecting data. Your process, whether the same as mine or not, will begin to develop.
This time we added depth to our process by moving from volume to load. In future installments, I will continue to layer our process by covering how we use acute:chronic work ratio to help individualize load, high speed (90%+ of max velocity) sprint data, and high-speed acceleration and deceleration as guides to fill the buckets that practice may not always succeed in doing. We will continue to explore how GPS allows us to make these decisions without a high level of guesswork and as optimally as possible.
Since you’re here…
…we have a small favor to ask. More people are reading SimpliFaster than ever, and each week we bring you compelling content from coaches, sport scientists, and physiotherapists who are devoted to building better athletes. Please take a moment to share the articles on social media, engage the authors with questions and comments below, and link to articles when appropriate if you have a blog or participate on forums of related topics. — SF
References
1. White, Ryan. “Acute:Chronic Workload Ratio – Science for Sport.” Science for Sport, 26 Nov. 2017.

