

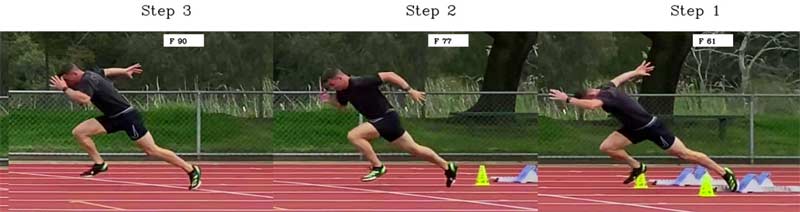
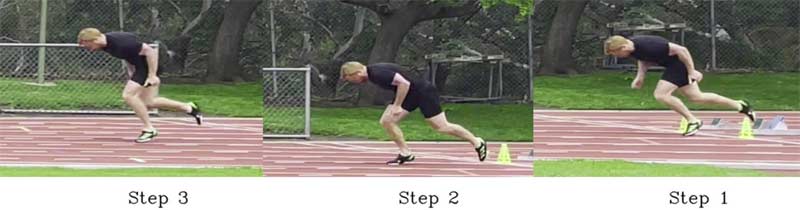
The project was to take 19 high-level sprinters and investigate the association between varying data points that could be collected utilizing the Plantiga and VueMotion software.
The sprinters were tested over 20 meters from a block start position. Data was collected on their takeoff and landing accelerations out of the blocks and the first three strides, and additionally on the time taken to run 20 meters in nine of the athletes.
The hypothesis was that there would be a high correlation between sprinting time over 20 meters and peak acceleration, ground contact time, time to first step, and total takeoff acceleration amongst the athletes. The investigation was also set up to test whether other correlations existed between takeoff and landing force, as well as landing forces and peak acceleration and time to 20 meters.
The Equipment
The Plantiga device was used across all 19 athletes, and VueMotion only over nine. I have written about Plantiga in two previous articles for SimpliFaster, which can be found here and here, where we demonstrate the technology’s utility for determining acceleration outputs in the sprinting stride.
VueMotion is an automated software tool that uses video capture uploaded from your mobile phone. It then automatically breaks down the data into usable visual and objective metrics.
In this article, I only utilize the VueMotion to obtain the time to 20 meters, though there is so much more you can use VueMotion for in athletics. Find out more on the VueMotion website.
The Athletes
The athletes, aged 16–26, were all specialist 100m sprinters who compete at the national level. Their legal wind personal bests ranged from 10.23 to 11.1, putting them in the top echelon of their age group nationally.
The Data Collected
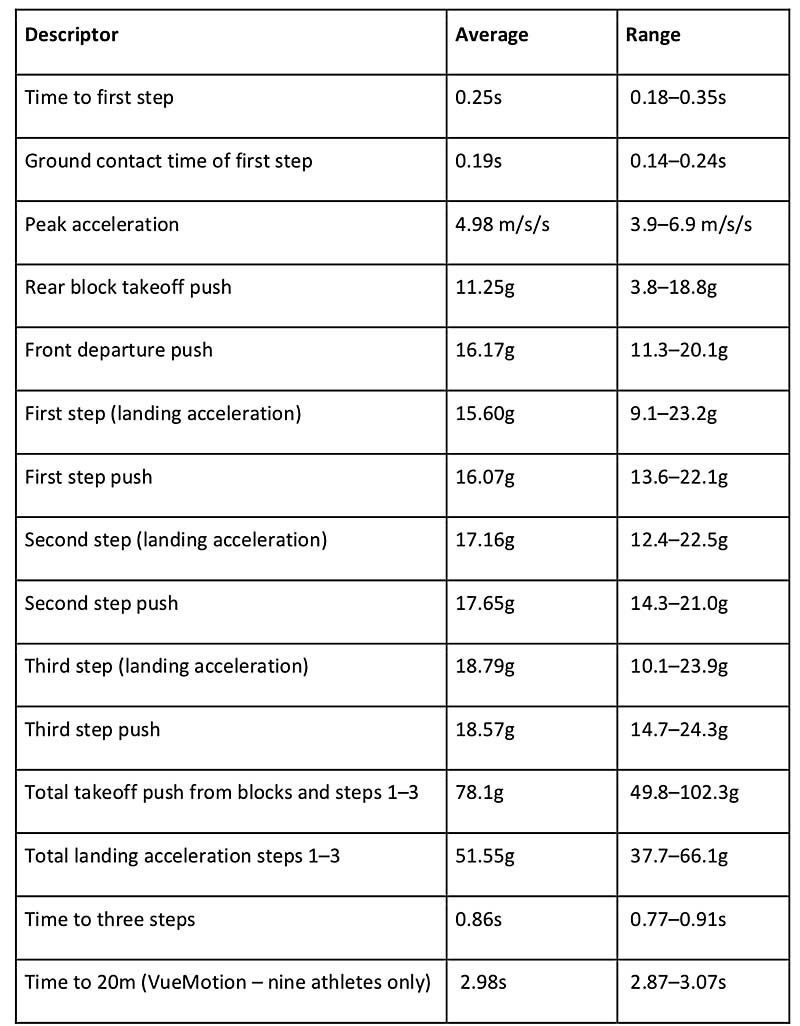
The table below summarizes the data collected from the Plantiga for the 20-meter acceleration across the 19 athletes. Due to extenuating circumstances, the VueMotion was only captured in nine of these 19 athletes, and we were able to achieve further correlations using this data.
With only 19 athletes tested, we must consider the analysis with a grain of salt. However, with the publication of this as a start, and support from Plantiga, I hope this can be collected into a better example of normative ranges that coaches and athletes can utilize in the future to gain inferences on their starting technique compared to other athletes.
What Does the Data Show?
We utilized a Pearson’s correlation coefficient calculation across multiple pairs of data collected from the table in figure 2. The first table below (figure 3) displays the significant correlation values with peak acceleration.
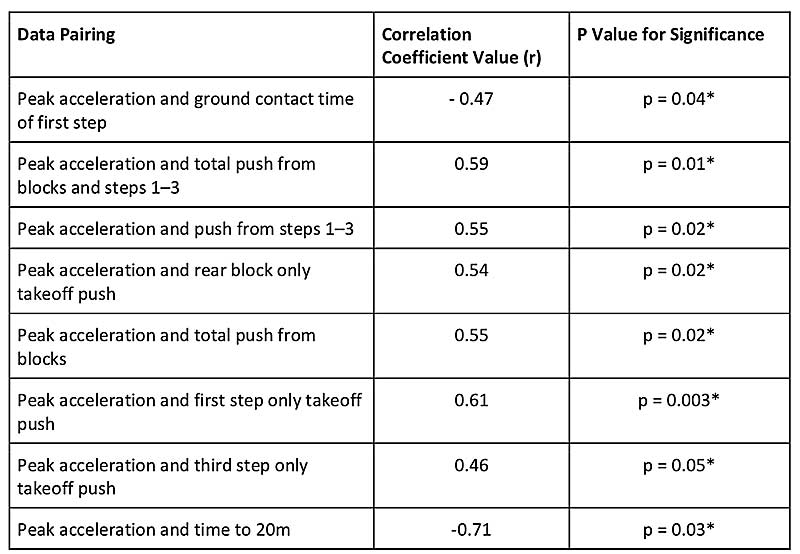
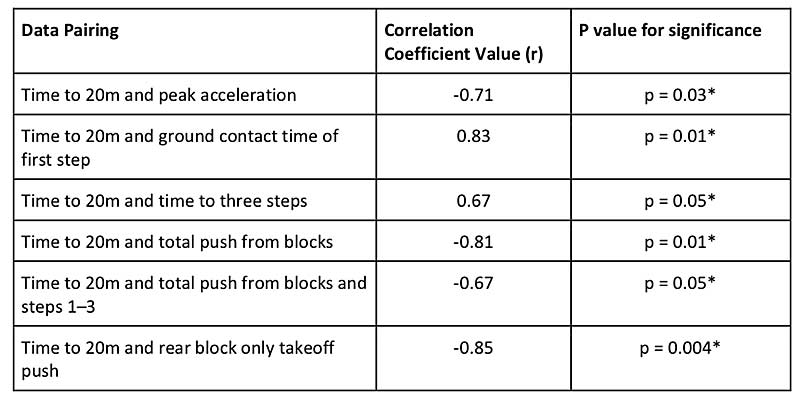
Figure 4 displays the significant correlation values with time to 20m.
Looking at the data, there are many things obvious to the coach and a number of interesting items as well.
The data we gathered shows many obvious things to a coach, but also a number of interesting items. Share on XThe ground contact time of the first step out of the blocks, total push accelerations out of the blocks and first three strides, push acceleration out of the blocks only, and push acceleration from rear block only first and third steps only were all highly correlated with peak acceleration and time to 20m.
This makes sense: the better push out of the blocks and push acceleration of the first three strides led to a better time over 20 meters and acceleration.
What was interesting was what was not correlated…
What Does the Data Not Show?
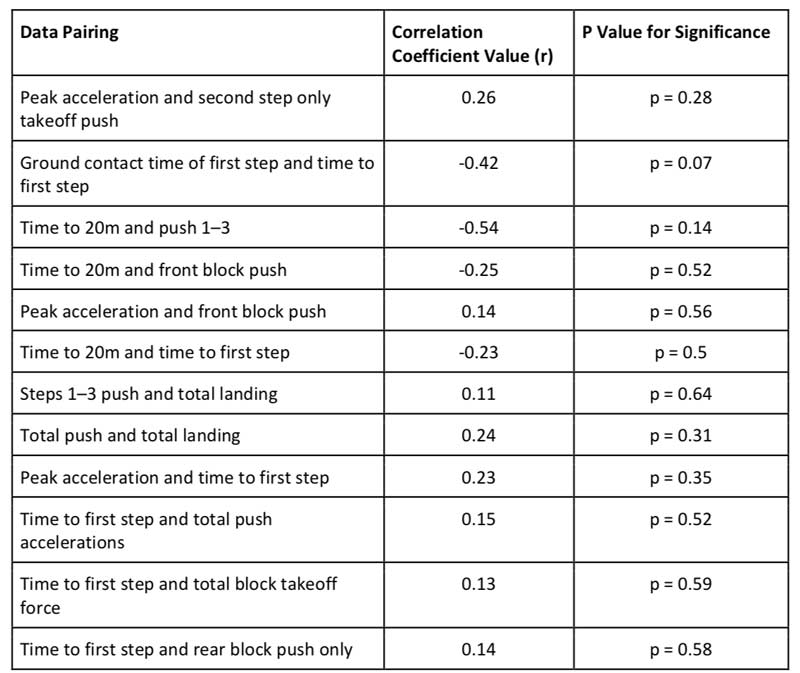
The table below outlines a number of correlations that did not reach significance but theoretically may have been expected to.
Front Foot Push Out of the Blocks
While the rear foot takeoff acceleration out of the blocks was significantly correlated with 20-meter time and peak acceleration, the front foot takeoff acceleration was not.
Second Step Takeoff Push Acceleration
While the rear foot takeoff acceleration out of the blocks, along with the push acceleration of the first and third steps, was significantly correlated with 20-meter time and peak acceleration, the second step was not.
Interestingly, the front foot and second step measure the same leg, whereas the rear, first, and third steps also measure the same (opposite) leg.
This leads to a number of questions:
- Could this be an area for training focus?
- Could an improved Reactive Strength Index (RSI) of the front foot improve outcomes, or is that leg not as important as the rear leg in block starts?
- If a coach wants to be the most efficient in their intervention, should they focus mainly on developing the takeoff acceleration capability of the rear block leg, as this has a better predictive outcome of yielding better 20-meter start times?
With only 19 athletes, the data is presented to promote discussion, not conclusions—but the art of coaching will find these variables interesting to manipulate to get the best results.
Total Landing and Pushing Accelerations
Total landing accelerations showed no correlation with any of the data sets. The instruction often given to athletes is to hit the ground to push back up—but certainly, in the first few steps, there is no need for that instruction, as there is no correlation. That is not to say there is no correlation in other phases of the sprint cycle, but this warrants more investigation.
Out of the Blocks
Takeoff acceleration from the blocks (front and rear) was significantly correlated to time to 20 meters, yet the push accelerations of the first three steps were not. This demonstrates the importance of pushing out of the blocks in the first 20 meters, particularly from the rear foot, as mentioned earlier.
Ground contact time on the first step and time to first step (TTFS) were moderately correlated, though not significant. This data set would be worth monitoring with more athletes tested to determine conclusions.
Time to first step did not correlate with peak acceleration or takeoff push accelerations from blocks, all three steps, or a combination of both. This suggests that the limb velocity required for a rapid TTFS is a separate skill from the acceleration-dependent skills of the takeoff accelerations that are highly correlated with peak acceleration and time to 20 meters.
Project Summary and Surprises
This study set out to determine which sprint metrics within the first three strides correlated highest with sprint performance to 20 meters. Not surprisingly, the takeoff (push) accelerations correlated the most, but significantly, this was with the leg starting in the rear block position, not the front position, when considering the block start and the first three strides.
Coaches have long placed the stronger leg on the front block due to its longer contact time at takeoff out of the blocks. This study suggests rear leg takeoff acceleration should instead be the focus. Share on XIt has long been the rule among coaches to place the stronger leg on the front block due to its longer contact time at takeoff out of the blocks. However, this study suggests a low correlation to performance for this limb position compared to the rear leg takeoff acceleration.
Perhaps greater emphasis needs to be placed upon which limb has the greater ability to create horizontal force from a position of more hip extension, as this has the highest correlation with sprint performance to 20 meters.
Finally, the ability to have a short ground contact time at first step was predictive of better 20-meter times and peak acceleration than the technical skill of time to first step. In fact, TTFS had no correlation with sprint performance or takeoff accelerations, leading us to question its importance as a metric in this study. However, a short TTFS is usually associated with a more acute shin angle (angle made by the tibia to the track), which aids the horizontal direction of force application. Perhaps when Plantiga is able to differentiate the horizontal force application on its own (currently in development), this metric may find significance.
Coaches can use these findings to make their block sessions more efficient by focusing on the variables that have the highest correlation with performance: ground contact time of the first step, rear block push-off, and developing takeoff (push) acceleration from that leg.


